Reports

- Global Locations -

Headquarters

Future Market Insights, Inc.

Christiana Corporate, 200
Continental Drive, Suite 401,
Newark, Delaware - 19713,
United States

T: +1-845-579-5705

Americas

Future Market Insights, Inc.

616 Corporate Way, Suite 2-9018,
Valley Cottage, NY 10989, United States

T: +1-347-918-3531

MEA

Future Market Insights

1602-6 Jumeirah Bay X2 Tower, Plot No: JLT-PH2-X2A,
Jumeirah Lakes Towers, Dubai,
United Arab Emirates

Europe

Future Market Insights

3rd Floor, 207 Regent Street,
W1B 3HH London
United Kingdom

T: + 44 (0) 20 8123 9659
D: +44 (0) 20 3287 4268

Asia Pacific

Future Market Insights

IndiaLand Global Tech Park, Unit UG-1, Behind Grand HighStreet, Phase 1, Hinjawadi, MH, Pune – 411057, India

Specimen Transport Bags Market Outlook (2022-2032)

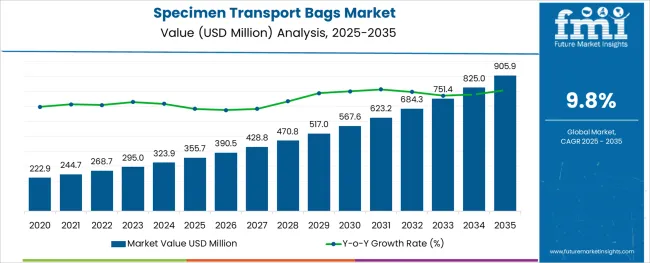
[250 Pages Report] The specimen transport bags market is expected to record a CAGR of 9.8% during the forecast period 2022-2032, up from US$ 244.7 Million in the year 2022 to reach a valuation of US$ 623.24 Million by 2032.

Report Attributes Details
CAGR 9.8%
Value (2022) US$ 244.7 Million 
Value (2032) US$ 623.24 Million 

The specimen transport bags market is anticipated to show promising growth prospects in the forecasted period 2022-2032.

Don't pay for what you don't need

Customize your report by selecting specific countries or regions and save 30%!

What are the Key Drivers to the Specimen Transport Bags Market Share

The types of path laboratories use different types of specimen transport bags. The specimen transport bags are generally used by different labs for the efficiency and precision of the diagnoses. The specimen transport bags used for chemical pathology, hematology, histopathology, and medical microbiology are the same.

In the modern world, these bags are used so things can be done more quickly and easily. Specimen transport bags are used to prevent the specimen from dust and leakage. The two-pocket specimen transport bags use a secondary watertight receptacle in accordance with shipping biological substances.
As time passes, there is a rising demand for convenient transportation of different types of diagnostic tests. There are many different types of specimen bags that can be used today to transport different types of samples, such as blood collection bags, gloves dispensers, shipping containers, smart sample GPS, tote bags, specimen labels, specimen storage, totes & drop boxes, tissue collection, and urine collection.

The market demand for specimen transport bags across regions continues to increase and convenience for transportation and sample handling. Due to government standard policy, there is an improvement in the pharmaceutical sector in India and China which results in the market growth of specimen transport bags and also increases the GDP of the country.

In the first half of the forecast period, diagnostic centers and hospitals should have the highest compound annual growth rates. As a result of the high demand for specimen transport bags, most people have more than one confirmatory test that needs to be done and blood samples are sent to different laboratories for analysis in those bags, increasing the market share.
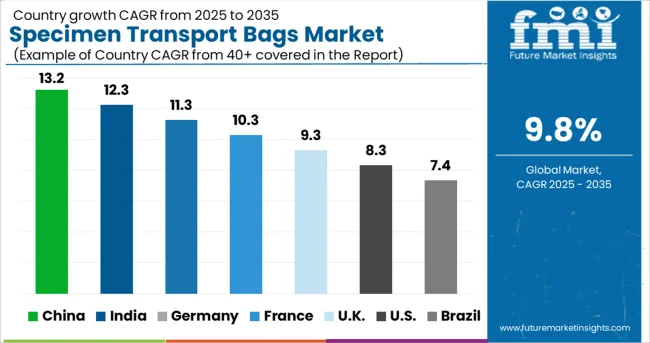
Which Region holds the Highest Growth Potential in the Specimen Transport Bags Market

Market shares for specimen transport bags are found primarily in Western Europe and North America. A significant contribution of the pharmaceutical industry in North America is predicted to propel growth in that region.

A significant increase in the growth of the pharmaceutical industry in countries like India and China is due to the standardization of country policies, which increases the value of retail sales, which is expected to drive the specimen transport bags market in the Asia Pacific region.

The specimen transportation bags market in Europe is growing at a moderate rate. According to the research, the global market for specimen transport bags is registering a healthy growth rate in the near future.
Ismail Sutaria
Ismail Sutaria

Principal Consultant

Talk to Analyst

Find your sweet spots for generating winning opportunities in this market.

How is the Competitive Landscape in the Specimen Transport Bags Market

Pharmaceutical clinical trials, diagnostic laboratories, medical testing laboratories, transplantation testing laboratories, pathology laboratories, and reference laboratories are just a few of the places where specimen transport bags are used. SIt is possible to order specimen transport bags in different colors as well as in transparent materials.

It is generally normal for different colors of specimen transport bags to be used for different diagnoses in the medical field. The specimen transport bags are generally used for the safe transportation of blood samples from blood sample centers to hospitals.

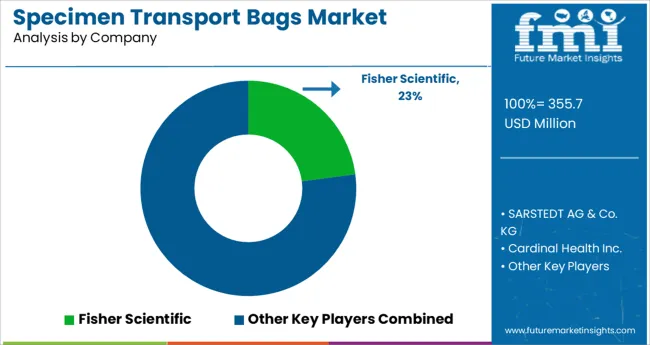
Examples of some of the market participants in the global specimen transport bags market identified across the value chain include Stellar Scientific, Andwin Scientific Softbox Systems, Heathrow Scientific, Alifax Holdings Spa, Fisher Scientific, and Sarstedt. Many local and unorganized players are expected to contribute to the specimen transport bags market during the forecast period.

Report Scope

Report Attribute Details
Growth rate CAGR of 9.8% from 2022 to 2032
Base year for estimation 2021
Historical data 2022-2032
Forecast period 2022 - 2032
Quantitative units Revenue in US$ million/billion and CAGR from 2022 to 2032
Report coverage Revenue forecast, volume forecast, company ranking, competitive landscape, growth factors, and trends, Pricing Analysis
Segments covered Material Type, Product Type, Application, End-Users, Region
Regional scope North America (U.S and Canada); Europe (Germany, France, Italy, U.K, Spain, Russia, Rest of Europe); APAC (China, Japan, South Korea, India, Australia, South East Asia, Rest of Asia Pacific); Latin America (Brazil, Mexico); Middle East And Africa Saudi Arab, South Africa, UAE)
Country scope North America, Latin America, Europe, South Asia, East Asia, Oceania, Middle East & Africa (MEA)
Key companies profiled Stellar Scientific, Andwin Scientific Softbox Systems, Heathrow Scientific, Alifax Holdings Spa, Fisher Scientific, and Sarstedt.
Customization scope Free report customization (equivalent to up to 8 analysts working days) with purchase. Addition or alteration to country, regional & segment scope.
Pricing and purchase options Avail customized purchase options to meet your exact research needs.

Get the data you need at a Fraction of the cost

Personalize your report by choosing insights you need
and save 40%!

Key Segments Profiled in Specimen Transport Bags Market

By Material Type:

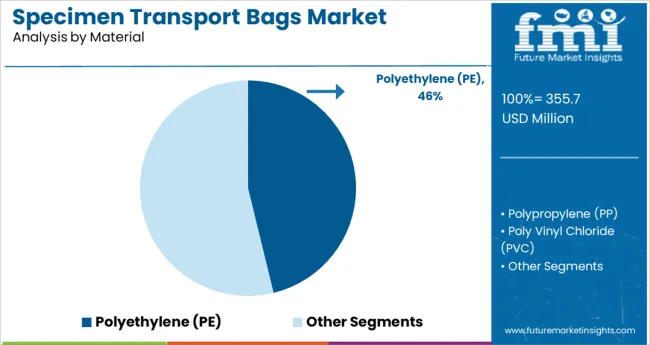
  • Polyethylene (PE)
  • Low Density Polyethylene (LDPE)
  • Linear Low-Density Polyethylene (LLDPE)
  • Polypropylene (PP)
  • Poly Vinyl Chloride (PVC)
  • Poly Lactic Acid (PLA)
  • Ethylene Vinyl Alcohol (EVOH)
  • Other Plastic

By Product Type:

  • Opaque
  • Clear

By Application:

  • Pharmaceutical Distribution Bags
  • Cash/Coin Deposit Bags
  • Evidence Bags
  • Strap Bags
  • Card & Dice Bags

By End-Users:

  • Financial Institutions
  • Courier Services Companies
  • Hospitals
  • Casinos
  • National Retail Companies
  • Hotels
  • Government Organization
  • Academic Institutions

By Region:

  • North America
  • Latin America
  • Europe
  • South Asia
  • East Asia
  • Oceania
  • Middle East & Africa (MEA)

Frequently Asked Questions

What is the Growth Outlook for the Specimen Transport Bags Market?

The specimen transport bags market is expected to record a CAGR of 9.8% during the forecast period 2022-2032, up from US$ 244.7 Million in the year 2022 to reach a valuation of US$ 623.24 Million by 2032.

Who are the Key Players in the Specimen Transport Bags Market?

Key players holding substantial market share include Stellar Scientific, Andwin Scientific Softbox Systems, Heathrow Scientific, Alifax Holdings Spa, Fisher Scientific, and Sarstedt.

What is the Future of the Specimen Transport Bags Market?

As per the analysis, the specimen transport bags market share is likely to be US$ 623.24 Million by 2032.

Which is the Key Driver in the Specimen Transport Bags Market?

Pharmaceutics is improving in India and China. This leads to a growth in the market for specimen transport bags and as a result, an increase in GDP.

Table of Content

1. Executive Summary

    1.1. Global Market Outlook

    1.2. Demand-side Trends

    1.3. Supply-side Trends

    1.4. Technology Roadmap Analysis

    1.5. Analysis and Recommendations

2. Market Overview

    2.1. Market Coverage / Taxonomy

    2.2. Market Definition / Scope / Limitations

3. Market Background

    3.1. Market Dynamics

        3.1.1. Drivers

        3.1.2. Restraints

        3.1.3. Opportunity

        3.1.4. Trends

    3.2. Impact of Covid-19

        3.2.1. Demand in Optimistic Scenario

        3.2.2. Demand in Likely Scenario

        3.2.3. Demand in Conservative Scenario

    3.3. Macro Factors and Forecast Factors

    3.4. Value Chain Analysis

        3.4.1. Profit Margin Analysis

        3.4.2. Raw Material Suppliers

        3.4.3. Manufacturers, Wholesalers and Distributors

        3.4.4. End Users/ Customers

    3.5. Regional Parent Market Outlook

    3.6. Production and Consumption Statistics

    3.7. Global Average Pricing Analysis Benchmark

4. Global Specimen Transport Bags Market Analysis 2015-2021 and Forecast, 2022-2032

    4.1. Historical Market Size Value (US$ Mn) & Volume (Units) Analysis, 2015-2021

    4.2. Current and Future Market Size Value (US$ Mn) & Volume (Units) Projections, 2022-2032

        4.2.1. Y-o-Y Growth Trend Analysis

        4.2.2. Absolute $ Opportunity Analysis

5. Global Specimen Transport Bags Market Analysis 2015–2021 and Forecast 2022–2032, By Material

    5.1. Introduction / Key Findings

    5.2. Historical Market Size Value (US$ Mn) & Volume (Units) Analysis by Material, 2015-2021

    5.3. Current and Future Market Size Value (US$ Mn) & Volume (Units) Analysis and Forecast by Material, 2022-2032

        5.3.1. Polyethylene (PE)

        5.3.2. Polypropylene (PP)

        5.3.3. Poly Vinyl Chloride (PVC)

        5.3.4. Other Plastics (PLA, EVOH, etc.)

    5.4. Y-o-Y Growth Trend Analysis by Material, 2015-2021

    5.5. Absolute $ Opportunity Analysis by Material, 2022-2032

6. Global Specimen Transport Bags Market Analysis 2015–2021 and Forecast 2022–2032, By Closure Type

    6.1. Introduction / Key Findings

    6.2. Historical Market Size Value (US$ Mn) & Volume (Units) Analysis by Closure Type, 2015-2021

    6.3. Current and Future Market Size Value (US$ Mn) & Volume (Units) Analysis and Forecast by Closure Type, 2022-2032

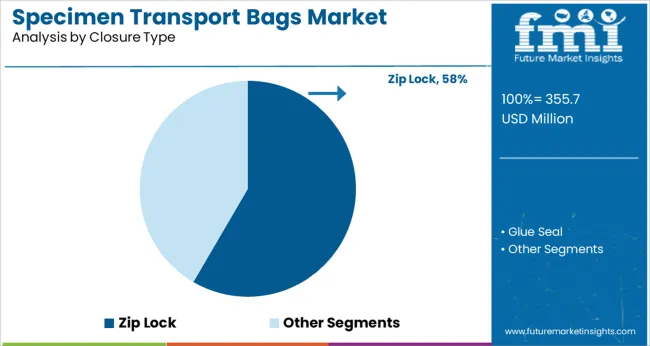
        6.3.1. Zip Lock

        6.3.2. Glue Seal

    6.4. Y-o-Y Growth Trend Analysis by Closure Type, 2015-2021

    6.5. Absolute $ Opportunity Analysis by Closure Type, 2022-2032

7. Global Specimen Transport Bags Market Analysis 2015–2021 and Forecast 2022–2032, By End Use

    7.1. Introduction / Key Findings

    7.2. Historical Market Size Value (US$ Mn) & Volume (Units) Analysis by End Use, 2015-2021

    7.3. Current and Future Market Size Value (US$ Mn) & Volume (Units) Analysis and Forecast by End Use, 2022-2032

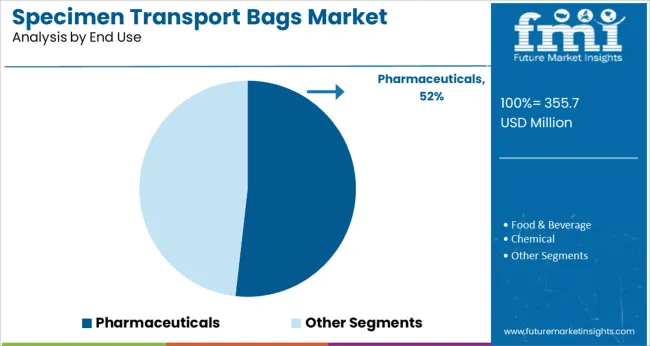
        7.3.1. Food & Beverage

        7.3.2. Pharmaceuticals

        7.3.3. Chemical

        7.3.4. Agriculture

        7.3.5. Cosmetic & Personal Care

        7.3.6. Homecare

    7.4. Y-o-Y Growth Trend Analysis by End Use, 2015-2021

    7.5. Absolute $ Opportunity Analysis by End Use, 2022-2032

8. Global Specimen Transport Bags Market Analysis 2015–2021 and Forecast 2022–2032, By Region

    8.1. Introduction / Key Findings

    8.2. Historical Market Size Value (US$ Mn) & Volume (Units) Analysis by Region, 2015-2021

    8.3. Current and Future Market Size Value (US$ Mn) & Volume (Units) Analysis and Forecast by Region, 2022-2032

        8.3.1. North America

        8.3.2. Latin America

        8.3.3. Europe

        8.3.4. East Asia

        8.3.5. South Asia

        8.3.6. Oceania

        8.3.7. Middle East and Africa (MEA)

    8.4. Market Attractiveness Analysis, by Region

9. North America Specimen Transport Bags Market Analysis 2015–2021 and Forecast 2022–2032, By Country

    9.1. Historical Market Size Value (US$ Mn) & Volume (Units) Trend Analysis by Market Taxonomy, 2015-2021

    9.2. Market Size Value (US$ Mn) & Volume (Units) Forecast by Market Taxonomy, 2022-2032

        9.2.1. By Country

            9.2.1.1. U.S.

            9.2.1.2. Canada

        9.2.2. By Material

        9.2.3. By Closure Type

        9.2.4. By End Use

    9.3. Market Attractiveness Analysis

        9.3.1. By Country

        9.3.2. By Material

        9.3.3. By Closure Type

        9.3.4. By End Use

    9.4. Key Takeaways

10. Latin America Specimen Transport Bags Market Analysis 2015–2021 and Forecast 2022–2032, By Country

    10.1. Historical Market Size Value (US$ Mn) & Volume (Units) Trend Analysis by Market Taxonomy, 2015-2021

    10.2. Market Size Value (US$ Mn) & Volume (Units) Forecast by Market Taxonomy, 2022-2032

        10.2.1. By Country

            10.2.1.1. Brazil

            10.2.1.2. Mexico

            10.2.1.3. Argentina

            10.2.1.4. Chile

            10.2.1.5. Peru

            10.2.1.6. Rest of Latin America

        10.2.2. By Material

        10.2.3. By Closure Type

        10.2.4. By End Use

    10.3. Market Attractiveness Analysis

        10.3.1. By Country

        10.3.2. By Material

        10.3.3. By Closure Type

        10.3.4. By End Use

    10.4. Key Takeaways

11. Europe Specimen Transport Bags Market Analysis 2015–2021 and Forecast 2022–2032, By Country

    11.1. Historical Market Size Value (US$ Mn) & Volume (Units) Trend Analysis by Market Taxonomy, 2015-2021

    11.2. Market Size Value (US$ Mn) & Volume (Units) Forecast by Market Taxonomy, 2022-2032

        11.2.1. By Country

            11.2.1.1. Germany

            11.2.1.2. Italy

            11.2.1.3. France

            11.2.1.4. U.K.

            11.2.1.5. Spain

            11.2.1.6. BENELUX

            11.2.1.7. Nordic

            11.2.1.8. Russia

            11.2.1.9. Poland

            11.2.1.10. Rest of Europe

        11.2.2. By Material

        11.2.3. By Closure Type

        11.2.4. By End Use

    11.3. Market Attractiveness Analysis

        11.3.1. By Country

        11.3.2. By Material

        11.3.3. By Closure Type

        11.3.4. By End Use

    11.4. Key Takeaways

12. East Asia Specimen Transport Bags Market Analysis 2015–2021 and Forecast 2022–2032, By Country

    12.1. Historical Market Size Value (US$ Mn) & Volume (Units) Trend Analysis by Market Taxonomy, 2015-2021

    12.2. Market Size Value (US$ Mn) & Volume (Units) Forecast by Market Taxonomy, 2022-2032

        12.2.1. By Country

            12.2.1.1. China

            12.2.1.2. Japan

            12.2.1.3. South Korea

        12.2.2. By Material

        12.2.3. By Closure Type

        12.2.4. By End Use

    12.3. Market Attractiveness Analysis

        12.3.1. By Country

        12.3.2. By Material

        12.3.3. By Closure Type

        12.3.4. By End Use

    12.4. Key Takeaways

13. South Asia Specimen Transport Bags Market Analysis 2015–2021 and Forecast 2022–2032, By Country

    13.1. Historical Market Size Value (US$ Mn) & Volume (Units) Trend Analysis by Market Taxonomy, 2015-2021

    13.2. Market Size Value (US$ Mn) & Volume (Units) Forecast by Market Taxonomy, 2022-2032

        13.2.1. By Country

            13.2.1.1. India

            13.2.1.2. Thailand

            13.2.1.3. Malaysia

            13.2.1.4. Indonesia

            13.2.1.5. Rest of South Asia

        13.2.2. By Material

        13.2.3. By Closure Type

        13.2.4. By End Use

    13.3. Market Attractiveness Analysis

        13.3.1. By Country

        13.3.2. By Material

        13.3.3. By Closure Type

        13.3.4. By End Use

    13.4. Key Takeaways

14. Oceania Specimen Transport Bags Market Analysis 2015–2021 and Forecast 2022–2032, By Country

    14.1. Historical Market Size Value (US$ Mn) & Volume (Units) Trend Analysis by Market Taxonomy, 2015-2021

    14.2. Market Size Value (US$ Mn) & Volume (Units) Forecast by Market Taxonomy, 2022-2032

        14.2.1. By Country

            14.2.1.1. Australia

            14.2.1.2. New Zealand

        14.2.2. By Material

        14.2.3. By Closure Type

        14.2.4. By End Use

    14.3. Market Attractiveness Analysis

        14.3.1. By Country

        14.3.2. By Material

        14.3.3. By Closure Type

        14.3.4. By End Use

    14.4. Key Takeaways

15. Middle East & Africa Specimen Transport Bags Market Analysis 2015–2021 and Forecast 2022–2032, By Country

    15.1. Historical Market Size Value (US$ Mn) & Volume (Units) Trend Analysis by Market Taxonomy, 2015-2021

    15.2. Market Size Value (US$ Mn) & Volume (Units) Forecast by Market Taxonomy, 2022-2032

        15.2.1. By Country

            15.2.1.1. GCC Countries

            15.2.1.2. Turkey

            15.2.1.3. Northern Africa

            15.2.1.4. South Africa

            15.2.1.5. Rest of MEA

        15.2.2. By Material

        15.2.3. By Closure Type

        15.2.4. By End Use

    15.3. Market Attractiveness Analysis

        15.3.1. By Country

        15.3.2. By Material

        15.3.3. By Closure Type

        15.3.4. By End Use

    15.4. Key Takeaways

16. Country wise Specimen Transport Bags Market Analysis

    16.1. United States (U.S.)

        16.1.1. Market Share Analysis, 2022

        16.1.2. By Material

        16.1.3. By Closure Type

        16.1.4. By End Use

    16.2. Canada

        16.2.1. Market Share Analysis, 2022

        16.2.2. By Material

        16.2.3. By Closure Type

        16.2.4. By End Use

    16.3. Brazil

        16.3.1. Market Share Analysis, 2022

        16.3.2. By Material

        16.3.3. By Closure Type

        16.3.4. By End Use

    16.4. Mexico

        16.4.1. Market Share Analysis, 2022

        16.4.2. By Material

        16.4.3. By Closure Type

        16.4.4. By End Use

    16.5. Germany

        16.5.1. Market Share Analysis, 2022

        16.5.2. By Material

        16.5.3. By Closure Type

        16.5.4. By End Use

    16.6. Italy

        16.6.1. Market Share Analysis, 2022

        16.6.2. By Material

        16.6.3. By Closure Type

        16.6.4. By End Use

    16.7. France

        16.7.1. Market Share Analysis, 2022

        16.7.2. By Material

        16.7.3. By Closure Type

        16.7.4. By End Use

    16.8. Spain

        16.8.1. Market Share Analysis, 2022

        16.8.2. By Material

        16.8.3. By Closure Type

        16.8.4. By End Use

    16.9. U.K.

        16.9.1. Market Share Analysis, 2022

        16.9.2. By Material

        16.9.3. By Closure Type

        16.9.4. By End Use

    16.10. Russia

        16.10.1. Market Share Analysis, 2022

        16.10.2. By Material

        16.10.3. By Closure Type

        16.10.4. By End Use

    16.11. China

        16.11.1. Market Share Analysis, 2022

        16.11.2. By Material

        16.11.3. By Closure Type

        16.11.4. By End Use

    16.12. Japan 

        16.12.1. Market Share Analysis, 2022

        16.12.2. By Material

        16.12.3. By Closure Type

        16.12.4. By End Use

    16.13. India

        16.13.1. Market Share Analysis, 2022

        16.13.2. By Material

        16.13.3. By Closure Type

        16.13.4. By End Use

    16.14. GCC Countries

        16.14.1. Market Share Analysis, 2022

        16.14.2. By Material

        16.14.3. By Closure Type

        16.14.4. By End Use

    16.15. Australia

        16.15.1. Market Share Analysis, 2022

        16.15.2. By Material

        16.15.3. By Closure Type

        16.15.4. By End Use

17. Market Structure Analysis

    17.1. Competition Dashboard

    17.2. Competition Benchmarking

    17.3. Market Share Analysis of Top Players

        17.3.1. By Region

        17.3.2. By Product Portfolio

18. Competition Analysis

    18.1. Competition Deep Dive

        18.1.1. Fisher Scientific

            18.1.1.1. Overview

            18.1.1.2. Product Portfolio

            18.1.1.3. Profitability by Market Segments (Product/Channel/Region)

            18.1.1.4. Sales Footprint

            18.1.1.5. Strategy Overview

                18.1.1.5.1. Marketing Strategy

                18.1.1.5.2. Product Strategy

                18.1.1.5.3. Channel Strategy

        18.1.2. SARSTEDT AG & Co. KG

            18.1.2.1. Overview

            18.1.2.2. Product Portfolio

            18.1.2.3. Profitability by Market Segments (Product/Channel/Region)

            18.1.2.4. Sales Footprint

            18.1.2.5. Strategy Overview

                18.1.2.5.1. Marketing Strategy

                18.1.2.5.2. Product Strategy

                18.1.2.5.3. Channel Strategy

        18.1.3. Cardinal Health Inc.

            18.1.3.1. Overview

            18.1.3.2. Product Portfolio

            18.1.3.3. Profitability by Market Segments (Product/Channel/Region)

            18.1.3.4. Sales Footprint

            18.1.3.5. Strategy Overview

                18.1.3.5.1. Marketing Strategy

                18.1.3.5.2. Product Strategy

                18.1.3.5.3. Channel Strategy

        18.1.4. Medline Industries, LP.

            18.1.4.1. Overview

            18.1.4.2. Product Portfolio

            18.1.4.3. Profitability by Market Segments (Product/Channel/Region)

            18.1.4.4. Sales Footprint

            18.1.4.5. Strategy Overview

                18.1.4.5.1. Marketing Strategy

                18.1.4.5.2. Product Strategy

                18.1.4.5.3. Channel Strategy

        18.1.5. VWR International, LLC.

            18.1.5.1. Overview

            18.1.5.2. Product Portfolio

            18.1.5.3. Profitability by Market Segments (Product/Channel/Region)

            18.1.5.4. Sales Footprint

            18.1.5.5. Strategy Overview

                18.1.5.5.1. Marketing Strategy

                18.1.5.5.2. Product Strategy

                18.1.5.5.3. Channel Strategy

        18.1.6. DynaCorp

            18.1.6.1. Overview

            18.1.6.2. Product Portfolio

            18.1.6.3. Profitability by Market Segments (Product/Channel/Region)

            18.1.6.4. Sales Footprint

            18.1.6.5. Strategy Overview

                18.1.6.5.1. Marketing Strategy

                18.1.6.5.2. Product Strategy

                18.1.6.5.3. Channel Strategy

        18.1.7. Mopec

            18.1.7.1. Overview

            18.1.7.2. Product Portfolio

            18.1.7.3. Profitability by Market Segments (Product/Channel/Region)

            18.1.7.4. Sales Footprint

            18.1.7.5. Strategy Overview

                18.1.7.5.1. Marketing Strategy

                18.1.7.5.2. Product Strategy

                18.1.7.5.3. Channel Strategy

        18.1.8. SLMP, LLC, DBA StatLab

            18.1.8.1. Overview

            18.1.8.2. Product Portfolio

            18.1.8.3. Profitability by Market Segments (Product/Channel/Region)

            18.1.8.4. Sales Footprint

            18.1.8.5. Strategy Overview

                18.1.8.5.1. Marketing Strategy

                18.1.8.5.2. Product Strategy

                18.1.8.5.3. Channel Strategy

        18.1.9. Azer Scientific Inc.

            18.1.9.1. Overview

            18.1.9.2. Product Portfolio

            18.1.9.3. Profitability by Market Segments (Product/Channel/Region)

            18.1.9.4. Sales Footprint

            18.1.9.5. Strategy Overview

                18.1.9.5.1. Marketing Strategy

                18.1.9.5.2. Product Strategy

                18.1.9.5.3. Channel Strategy

        18.1.10. Health Care Logistics, Inc.

            18.1.10.1. Overview

            18.1.10.2. Product Portfolio

            18.1.10.3. Profitability by Market Segments (Product/Channel/Region)

            18.1.10.4. Sales Footprint

            18.1.10.5. Strategy Overview

                18.1.10.5.1. Marketing Strategy

                18.1.10.5.2. Product Strategy

                18.1.10.5.3. Channel Strategy

        18.1.11. Seeds of Innovation Technologies, Inc.

            18.1.11.1. Overview

            18.1.11.2. Product Portfolio

            18.1.11.3. Profitability by Market Segments (Product/Channel/Region)

            18.1.11.4. Sales Footprint

            18.1.11.5. Strategy Overview

                18.1.11.5.1. Marketing Strategy

                18.1.11.5.2. Product Strategy

                18.1.11.5.3. Channel Strategy

        18.1.12. Medicus Health.

            18.1.12.1. Overview

            18.1.12.2. Product Portfolio

            18.1.12.3. Profitability by Market Segments (Product/Channel/Region)

            18.1.12.4. Sales Footprint

            18.1.12.5. Strategy Overview

                18.1.12.5.1. Marketing Strategy

                18.1.12.5.2. Product Strategy

                18.1.12.5.3. Channel Strategy

19. Assumptions and Acronyms Used

20. Research Methodology

List of Tables

Table 01: Global Specimen Transport Bags Market Value (US$ Mn) Forecast by Region, 2015-2032

Table 02: Global Specimen Transport Bags Market Volume (Units) Forecast by Region, 2015-2032

Table 03: Global Specimen Transport Bags Market Value (US$ Mn) Forecast by Material, 2015-2032

Table 04: Global Specimen Transport Bags Market Volume (Units) Forecast by Material, 2015-2032

Table 05: Global Specimen Transport Bags Market Value (US$ Mn) Forecast by Closure Type, 2015-2032

Table 06: Global Specimen Transport Bags Market Volume (Units) Forecast by Closure Type, 2015-2032

Table 07: Global Specimen Transport Bags Market Value (US$ Mn) Forecast by End Use, 2015-2032

Table 08: Global Specimen Transport Bags Market Volume (Units) Forecast by End Use, 2015-2032

Table 09: North America Specimen Transport Bags Market Value (US$ Mn) Forecast by Country, 2015-2032

Table 10: North America Specimen Transport Bags Market Volume (Units) Forecast by Country, 2015-2032

Table 11: North America Specimen Transport Bags Market Value (US$ Mn) Forecast by Material, 2015-2032

Table 12: North America Specimen Transport Bags Market Volume (Units) Forecast by Material, 2015-2032

Table 13: North America Specimen Transport Bags Market Value (US$ Mn) Forecast by Closure Type, 2015-2032

Table 14: North America Specimen Transport Bags Market Volume (Units) Forecast by Closure Type, 2015-2032

Table 15: North America Specimen Transport Bags Market Value (US$ Mn) Forecast by End Use, 2015-2032

Table 16: North America Specimen Transport Bags Market Volume (Units) Forecast by End Use, 2015-2032

Table 17: Latin America Specimen Transport Bags Market Value (US$ Mn) Forecast by Country, 2015-2032

Table 18: Latin America Specimen Transport Bags Market Volume (Units) Forecast by Country, 2015-2032

Table 19: Latin America Specimen Transport Bags Market Value (US$ Mn) Forecast by Material, 2015-2032

Table 20: Latin America Specimen Transport Bags Market Volume (Units) Forecast by Material, 2015-2032

Table 21: Latin America Specimen Transport Bags Market Value (US$ Mn) Forecast by Closure Type, 2015-2032

Table 22: Latin America Specimen Transport Bags Market Volume (Units) Forecast by Closure Type, 2015-2032

Table 23: Latin America Specimen Transport Bags Market Value (US$ Mn) Forecast by End Use, 2015-2032

Table 24: Latin America Specimen Transport Bags Market Volume (Units) Forecast by End Use, 2015-2032

Table 25: Europe Specimen Transport Bags Market Value (US$ Mn) Forecast by Country, 2015-2032

Table 26: Europe Specimen Transport Bags Market Volume (Units) Forecast by Country, 2015-2032

Table 27: Europe Specimen Transport Bags Market Value (US$ Mn) Forecast by Material, 2015-2032

Table 28: Europe Specimen Transport Bags Market Volume (Units) Forecast by Material, 2015-2032

Table 29: Europe Specimen Transport Bags Market Value (US$ Mn) Forecast by Closure Type, 2015-2032

Table 30: Europe Specimen Transport Bags Market Volume (Units) Forecast by Closure Type, 2015-2032

Table 31: Europe Specimen Transport Bags Market Value (US$ Mn) Forecast by End Use, 2015-2032

Table 32: Europe Specimen Transport Bags Market Volume (Units) Forecast by End Use, 2015-2032

Table 33: East Asia Specimen Transport Bags Market Value (US$ Mn) Forecast by Country, 2015-2032

Table 34: East Asia Specimen Transport Bags Market Volume (Units) Forecast by Country, 2015-2032

Table 35: East Asia Specimen Transport Bags Market Value (US$ Mn) Forecast by Material, 2015-2032

Table 36: East Asia Specimen Transport Bags Market Volume (Units) Forecast by Material, 2015-2032

Table 37: East Asia Specimen Transport Bags Market Value (US$ Mn) Forecast by Closure Type, 2015-2032

Table 38: East Asia Specimen Transport Bags Market Volume (Units) Forecast by Closure Type, 2015-2032

Table 39: East Asia Specimen Transport Bags Market Value (US$ Mn) Forecast by End Use, 2015-2032

Table 40: East Asia Specimen Transport Bags Market Volume (Units) Forecast by End Use, 2015-2032

Table 41: South Asia Specimen Transport Bags Market Value (US$ Mn) Forecast by Country, 2015-2032

Table 42: South Asia Specimen Transport Bags Market Volume (Units) Forecast by Country, 2015-2032

Table 43: South Asia Specimen Transport Bags Market Value (US$ Mn) Forecast by Material, 2015-2032

Table 44: South Asia Specimen Transport Bags Market Volume (Units) Forecast by Material, 2015-2032

Table 45: South Asia Specimen Transport Bags Market Value (US$ Mn) Forecast by Closure Type, 2015-2032

Table 46: South Asia Specimen Transport Bags Market Volume (Units) Forecast by Closure Type, 2015-2032

Table 47: South Asia Specimen Transport Bags Market Value (US$ Mn) Forecast by End Use, 2015-2032

Table 48: South Asia Specimen Transport Bags Market Volume (Units) Forecast by End Use, 2015-2032

Table 49: Oceania Specimen Transport Bags Market Value (US$ Mn) Forecast by Country, 2015-2032

Table 50: Oceania Specimen Transport Bags Market Volume (Units) Forecast by Country, 2015-2032

Table 51: Oceania Specimen Transport Bags Market Value (US$ Mn) Forecast by Material, 2015-2032

Table 52: Oceania Specimen Transport Bags Market Volume (Units) Forecast by Material, 2015-2032

Table 53: Oceania Specimen Transport Bags Market Value (US$ Mn) Forecast by Closure Type, 2015-2032

Table 54: Oceania Specimen Transport Bags Market Volume (Units) Forecast by Closure Type, 2015-2032

Table 55: Oceania Specimen Transport Bags Market Value (US$ Mn) Forecast by End Use, 2015-2032

Table 56: Oceania Specimen Transport Bags Market Volume (Units) Forecast by End Use, 2015-2032

Table 57: MEA Specimen Transport Bags Market Value (US$ Mn) Forecast by Country, 2015-2032

Table 58: MEA Specimen Transport Bags Market Volume (Units) Forecast by Country, 2015-2032

Table 59: MEA Specimen Transport Bags Market Value (US$ Mn) Forecast by Material, 2015-2032

Table 60: MEA Specimen Transport Bags Market Volume (Units) Forecast by Material, 2015-2032

Table 61: MEA Specimen Transport Bags Market Value (US$ Mn) Forecast by Closure Type, 2015-2032

Table 62: MEA Specimen Transport Bags Market Volume (Units) Forecast by Closure Type, 2015-2032

Table 63: MEA Specimen Transport Bags Market Value (US$ Mn) Forecast by End Use, 2015-2032

Table 64: MEA Specimen Transport Bags Market Volume (Units) Forecast by End Use, 2015-2032

Table 65: U.S. Specimen Transport Bags Market Value (US$ Mn) Forecast by Material, Closure Type, and End Use (2022(E) & 2032(F))

Table 66: Canada Specimen Transport Bags Market Value (US$ Mn) Forecast by Material, Closure Type, and End Use (2022(E) & 2032(F))

Table 67: Brazil Specimen Transport Bags Market Value (US$ Mn) Forecast by Material, Closure Type, and End Use (2022(E) & 2032(F))

Table 68: Mexico Specimen Transport Bags Market Value (US$ Mn) Forecast by Material, Closure Type, and End Use (2022(E) & 2032(F))

Table 69: Germany Specimen Transport Bags Market Value (US$ Mn) Forecast by Material, Closure Type, and End Use (2022(E) & 2032(F))

Table 70: Italy Specimen Transport Bags Market Value (US$ Mn) Forecast by Material, Closure Type, and End Use (2022(E) & 2032(F))

Table 71: France Specimen Transport Bags Market Value (US$ Mn) Forecast by Material, Closure Type, and End Use (2022(E) & 2032(F))

Table 72: Spain Specimen Transport Bags Market Value (US$ Mn) Forecast by Material, Closure Type, and End Use (2022(E) & 2032(F))

Table 73: U.K. Specimen Transport Bags Market Value (US$ Mn) Forecast by Material, Closure Type, and End Use (2022(E) & 2032(F))

Table 74: Russia Specimen Transport Bags Market Value (US$ Mn) Forecast by Material, Closure Type, and End Use (2022(E) & 2032(F))

Table 75: China Specimen Transport Bags Market Value (US$ Mn) Forecast by Material, Closure Type, and End Use (2022(E) & 2032(F))

Table 76: Japan Specimen Transport Bags Market Value (US$ Mn) Forecast by Material, Closure Type, and End Use (2022(E) & 2032(F))

Table 77: India Specimen Transport Bags Market Value (US$ Mn) Forecast by Material, Closure Type, and End Use (2022(E) & 2032(F))

Table 78: GCC Countries Specimen Transport Bags Market Value (US$ Mn) Forecast by Material, Closure Type, and End Use (2022(E) & 2032(F))

Table 79: Australia Specimen Transport Bags Market Value (US$ Mn) Forecast by Material, Closure Type, and End Use (2022(E) & 2032(F))

List of Charts

Figure 01: Global Specimen Transport Bags Market Value (US$ Mn) by Material, 2022-2032

Figure 02: Global Specimen Transport Bags Market Value (US$ Mn) by Closure Type, 2022-2032

Figure 03: Global Specimen Transport Bags Market Value (US$ Mn) by End Use, 2022-2032

Figure 04: Global Specimen Transport Bags Market Value (US$ Mn) by Region, 2022-2032

Figure 05: Global Specimen Transport Bags Market Value (US$ Mn) Analysis by Region, 2015-2021

Figure 06: Global Specimen Transport Bags Market Volume (Units) Analysis by Region, 2015-2032

Figure 07: Global Specimen Transport Bags Market Value Share (%) and BPS Analysis by Region, 2022 & 2032

Figure 08: Global Specimen Transport Bags Market Y-o-Y Growth (%) Projections by Region, 2022-2032

Figure 09: Global Specimen Transport Bags Market Value (US$ Mn) Analysis by Material, 2015-2021

Figure 10: Global Specimen Transport Bags Market Volume (Units) Analysis by Material, 2015-2032

Figure 11: Global Specimen Transport Bags Market Value Share (%) and BPS Analysis by Material, 2022 & 2032

Figure 12: Global Specimen Transport Bags Market Y-o-Y Growth (%) Projections by Material, 2022-2032

Figure 13: Global Specimen Transport Bags Market Value (US$ Mn) Analysis by Closure Type, 2015-2021

Figure 14: Global Specimen Transport Bags Market Volume (Units) Analysis by Closure Type, 2015-2032

Figure 15: Global Specimen Transport Bags Market Value Share (%) and BPS Analysis by Closure Type, 2022 & 2032

Figure 16: Global Specimen Transport Bags Market Y-o-Y Growth (%) Projections by Closure Type, 2022-2032

Figure 17: Global Specimen Transport Bags Market Value (US$ Mn) Analysis by End Use, 2015-2021

Figure 18: Global Specimen Transport Bags Market Volume (Units) Analysis by End Use, 2015-2032

Figure 19: Global Specimen Transport Bags Market Value Share (%) and BPS Analysis by End Use, 2022 & 2032

Figure 20: Global Specimen Transport Bags Market Y-o-Y Growth (%) Projections by End Use, 2022-2032

Figure 21: Global Specimen Transport Bags Market Attractiveness by Material, 2022-2032

Figure 22: Global Specimen Transport Bags Market Attractiveness by Closure Type, 2022-2032

Figure 23: Global Specimen Transport Bags Market Attractiveness by End Use, 2022-2032

Figure 24: Global Specimen Transport Bags Market Attractiveness by End Use, 2022-2032

Figure 25: Global Specimen Transport Bags Market Attractiveness by Region, 2022-2032

Figure 26: North America Specimen Transport Bags Market Value (US$ Mn) by Material, 2022-2032

Figure 27: North America Specimen Transport Bags Market Value (US$ Mn) by Closure Type, 2022-2032

Figure 28: North America Specimen Transport Bags Market Value (US$ Mn) by End Use, 2022-2032

Figure 29: North America Specimen Transport Bags Market Value (US$ Mn) by Country, 2022-2032

Figure 30: North America Specimen Transport Bags Market Value (US$ Mn) Analysis by Country, 2015-2021

Figure 31: North America Specimen Transport Bags Market Volume (Units) Analysis by Country, 2015-2032

Figure 32: North America Specimen Transport Bags Market Value Share (%) and BPS Analysis by Country, 2022 & 2032

Figure 33: North America Specimen Transport Bags Market Y-o-Y Growth (%) Projections by Country, 2022-2032

Figure 34: North America Specimen Transport Bags Market Value (US$ Mn) Analysis by Material, 2015-2021

Figure 35: North America Specimen Transport Bags Market Volume (Units) Analysis by Material, 2015-2032

Figure 36: North America Specimen Transport Bags Market Value Share (%) and BPS Analysis by Material, 2022 & 2032

Figure 37: North America Specimen Transport Bags Market Y-o-Y Growth (%) Projections by Material, 2022-2032

Figure 38: North America Specimen Transport Bags Market Value (US$ Mn) Analysis by Closure Type, 2015-2021

Figure 39: North America Specimen Transport Bags Market Volume (Units) Analysis by Closure Type, 2015-2032

Figure 40: North America Specimen Transport Bags Market Value Share (%) and BPS Analysis by Closure Type, 2022 & 2032

Figure 41: North America Specimen Transport Bags Market Y-o-Y Growth (%) Projections by Closure Type, 2022-2032

Figure 42: North America Specimen Transport Bags Market Value (US$ Mn) Analysis by End Use, 2015-2021

Figure 43: North America Specimen Transport Bags Market Volume (Units) Analysis by End Use, 2015-2032

Figure 44: North America Specimen Transport Bags Market Value Share (%) and BPS Analysis by End Use, 2022 & 2032

Figure 45: North America Specimen Transport Bags Market Y-o-Y Growth (%) Projections by End Use, 2022-2032

Figure 46: North America Specimen Transport Bags Market Attractiveness by Material, 2022-2032

Figure 47: North America Specimen Transport Bags Market Attractiveness by Closure Type, 2022-2032

Figure 48: North America Specimen Transport Bags Market Attractiveness by End Use, 2022-2032

Figure 49: North America Specimen Transport Bags Market Attractiveness by Country, 2022-2032

Figure 50: Latin America Specimen Transport Bags Market Value (US$ Mn) by Material, 2022 & 2032

Figure 51: Latin America Specimen Transport Bags Market Value (US$ Mn) by Closure Type, 2022-2032

Figure 52: Latin America Specimen Transport Bags Market Value (US$ Mn) by End Use, 2022-2032

Figure 53: Latin America Specimen Transport Bags Market Value (US$ Mn) by Country, 2022-2032

Figure 54: Latin America Specimen Transport Bags Market Value (US$ Mn) Analysis by Country, 2015-2021

Figure 55: Latin America Specimen Transport Bags Market Volume (Units) Analysis by Country, 2015-2032

Figure 56: Latin America Specimen Transport Bags Market Value Share (%) and BPS Analysis by Country, 2022 & 2032

Figure 57: Latin America Specimen Transport Bags Market Y-o-Y Growth (%) Projections by Country, 2022-2032

Figure 58: Latin America Specimen Transport Bags Market Value (US$ Mn) Analysis by Material, 2015-2021

Figure 59: Latin America Specimen Transport Bags Market Volume (Units) Analysis by Material, 2015-2032

Figure 60: Latin America Specimen Transport Bags Market Value Share (%) and BPS Analysis by Material, 2022 & 2032

Figure 61: Latin America Specimen Transport Bags Market Y-o-Y Growth (%) Projections by Material, 2022-2032

Figure 62: Latin America Specimen Transport Bags Market Value (US$ Mn) Analysis by Closure Type, 2015-2021

Figure 63: Latin America Specimen Transport Bags Market Volume (Units) Analysis by Closure Type, 2015-2032

Figure 64: Latin America Specimen Transport Bags Market Value Share (%) and BPS Analysis by Closure Type, 2022 & 2032

Figure 65: Latin America Specimen Transport Bags Market Y-o-Y Growth (%) Projections by Closure Type, 2022-2032

Figure 66: Latin America Specimen Transport Bags Market Value (US$ Mn) Analysis by End Use, 2015-2021

Figure 67: Latin America Specimen Transport Bags Market Volume (Units) Analysis by End Use, 2015-2032

Figure 68: Latin America Specimen Transport Bags Market Value Share (%) and BPS Analysis by End Use, 2022 & 2032

Figure 69: Latin America Specimen Transport Bags Market Y-o-Y Growth (%) Projections by End Use, 2022-2032

Figure 70: Latin America Specimen Transport Bags Market Attractiveness by Material, 2022-2032

Figure 71: Latin America Specimen Transport Bags Market Attractiveness by Closure Type, 2022-2032

Figure 72: Latin America Specimen Transport Bags Market Attractiveness by End Use, 2022-2032

Figure 73: Latin America Specimen Transport Bags Market Attractiveness by Country, 2022-2032

Figure 74: Europe Specimen Transport Bags Market Value (US$ Mn) by Material, 2022-2032

Figure 75: Europe Specimen Transport Bags Market Value (US$ Mn) by Closure Type, 2022-2032

Figure 76: Europe Specimen Transport Bags Market Value (US$ Mn) by End Use, 2022-2032

Figure 77: Europe Specimen Transport Bags Market Value (US$ Mn) by Country, 2022-2032

Figure 78: Europe Specimen Transport Bags Market Value (US$ Mn) Analysis by Country, 2015-2021

Figure 79: Europe Specimen Transport Bags Market Volume (Units) Analysis by Country, 2015-2032

Figure 80: Europe Specimen Transport Bags Market Value Share (%) and BPS Analysis by Country, 2022 & 2032

Figure 81: Europe Specimen Transport Bags Market Y-o-Y Growth (%) Projections by Country, 2022-2032

Figure 82: Europe Specimen Transport Bags Market Value (US$ Mn) Analysis by Material, 2015-2021

Figure 83: Europe Specimen Transport Bags Market Volume (Units) Analysis by Material, 2015-2032

Figure 84: Europe Specimen Transport Bags Market Value Share (%) and BPS Analysis by Material, 2022 & 2032

Figure 85: Europe Specimen Transport Bags Market Y-o-Y Growth (%) Projections by Material, 2022-2032

Figure 86: Europe Specimen Transport Bags Market Value (US$ Mn) Analysis by Closure Type, 2015-2021

Figure 87: Europe Specimen Transport Bags Market Volume (Units) Analysis by Closure Type, 2015-2032

Figure 88: Europe Specimen Transport Bags Market Value Share (%) and BPS Analysis by Closure Type, 2022 & 2032

Figure 89: Europe Specimen Transport Bags Market Y-o-Y Growth (%) Projections by Closure Type, 2022-2032

Figure 90: Europe Specimen Transport Bags Market Value (US$ Mn) Analysis by End Use, 2015-2021

Figure 91: Europe Specimen Transport Bags Market Volume (Units) Analysis by End Use, 2015-2032

Figure 92: Europe Specimen Transport Bags Market Value Share (%) and BPS Analysis by End Use, 2022 & 2032

Figure 93: Europe Specimen Transport Bags Market Y-o-Y Growth (%) Projections by End Use, 2022-2032

Figure 94: Europe Specimen Transport Bags Market Attractiveness by Material, 2022-2032

Figure 95: Europe Specimen Transport Bags Market Attractiveness by Closure Type, 2022-2032

Figure 96: Europe Specimen Transport Bags Market Attractiveness by End Use, 2022-2032

Figure 97: Europe Specimen Transport Bags Market Attractiveness by Country, 2022-2032

Figure 98: East Asia Specimen Transport Bags Market Value (US$ Mn) by Material, 2022-2032

Figure 99: East Asia Specimen Transport Bags Market Value (US$ Mn) by Closure Type, 2022-2032

Figure 100: East Asia Specimen Transport Bags Market Value (US$ Mn) by End Use, 2022-2032

Figure 101: East Asia Specimen Transport Bags Market Value (US$ Mn) by Country, 2022-2032

Figure 102: East Asia Specimen Transport Bags Market Value (US$ Mn) Analysis by Country, 2015-2021

Figure 103: East Asia Specimen Transport Bags Market Volume (Units) Analysis by Country, 2015-2032

Figure 104: East Asia Specimen Transport Bags Market Value Share (%) and BPS Analysis by Country, 2022 & 2032

Figure 105: East Asia Specimen Transport Bags Market Y-o-Y Growth (%) Projections by Country, 2022-2032

Figure 106: East Asia Specimen Transport Bags Market Value (US$ Mn) Analysis by Material, 2015-2021

Figure 107: East Asia Specimen Transport Bags Market Volume (Units) Analysis by Material, 2015-2032

Figure 108: East Asia Specimen Transport Bags Market Value Share (%) and BPS Analysis by Material, 2022 & 2032

Figure 109: East Asia Specimen Transport Bags Market Y-o-Y Growth (%) Projections by Material, 2022-2032

Figure 110: East Asia Specimen Transport Bags Market Value (US$ Mn) Analysis by Closure Type, 2015-2021

Figure 111: East Asia Specimen Transport Bags Market Volume (Units) Analysis by Closure Type, 2015-2032

Figure 112: East Asia Specimen Transport Bags Market Value Share (%) and BPS Analysis by Closure Type, 2022 & 2032

Figure 113: East Asia Specimen Transport Bags Market Y-o-Y Growth (%) Projections by Closure Type, 2022-2032

Figure 114: East Asia Specimen Transport Bags Market Value (US$ Mn) Analysis by End Use, 2015-2021

Figure 115: East Asia Specimen Transport Bags Market Volume (Units) Analysis by End Use, 2015-2032

Figure 116: East Asia Specimen Transport Bags Market Value Share (%) and BPS Analysis by End Use, 2022 & 2032

Figure 117: East Asia Specimen Transport Bags Market Y-o-Y Growth (%) Projections by End Use, 2022-2032

Figure 118: East Asia Specimen Transport Bags Market Attractiveness by Material, 2022-2032

Figure 119: East Asia Specimen Transport Bags Market Attractiveness by Closure Type, 2022-2032

Figure 120: East Asia Specimen Transport Bags Market Attractiveness by End Use, 2022-2032

Figure 121: East Asia Specimen Transport Bags Market Attractiveness by Country, 2022-2032

Figure 122: South Asia Specimen Transport Bags Market Value (US$ Mn) by Material, 2022-2032

Figure 123: South Asia Specimen Transport Bags Market Value (US$ Mn) by Closure Type, 2022-2032

Figure 124: South Asia Specimen Transport Bags Market Value (US$ Mn) by End Use, 2022-2032

Figure 125: South Asia Specimen Transport Bags Market Value (US$ Mn) by Country, 2022-2032

Figure 126: South Asia Specimen Transport Bags Market Value (US$ Mn) Analysis by Country, 2015-2021

Figure 127: South Asia Specimen Transport Bags Market Volume (Units) Analysis by Country, 2015-2032

Figure 128: South Asia Specimen Transport Bags Market Value Share (%) and BPS Analysis by Country, 2022 & 2032

Figure 129: South Asia Specimen Transport Bags Market Y-o-Y Growth (%) Projections by Country, 2022-2032

Figure 130: South Asia Specimen Transport Bags Market Value (US$ Mn) Analysis by Material, 2015-2021

Figure 131: South Asia Specimen Transport Bags Market Volume (Units) Analysis by Material, 2015-2032

Figure 132: South Asia Specimen Transport Bags Market Value Share (%) and BPS Analysis by Material, 2022 & 2032

Figure 133: South Asia Specimen Transport Bags Market Y-o-Y Growth (%) Projections by Material, 2022-2032

Figure 134: South Asia Specimen Transport Bags Market Value (US$ Mn) Analysis by Closure Type, 2015-2021

Figure 135: South Asia Specimen Transport Bags Market Volume (Units) Analysis by Closure Type, 2015-2032

Figure 136: South Asia Specimen Transport Bags Market Value Share (%) and BPS Analysis by Closure Type, 2022 & 2032

Figure 137: South Asia Specimen Transport Bags Market Y-o-Y Growth (%) Projections by Closure Type, 2022-2032

Figure 138: South Asia Specimen Transport Bags Market Value (US$ Mn) Analysis by End Use, 2015-2021

Figure 139: South Asia Specimen Transport Bags Market Volume (Units) Analysis by End Use, 2015-2032

Figure 140: South Asia Specimen Transport Bags Market Value Share (%) and BPS Analysis by End Use, 2022 & 2032

Figure 141: South Asia Specimen Transport Bags Market Y-o-Y Growth (%) Projections by End Use, 2022-2032

Figure 142: South Asia Specimen Transport Bags Market Attractiveness by Material, 2022-2032

Figure 143: South Asia Specimen Transport Bags Market Attractiveness by Closure Type, 2022-2032

Figure 144: South Asia Specimen Transport Bags Market Attractiveness by End Use, 2022-2032

Figure 145: South Asia Specimen Transport Bags Market Attractiveness by Country, 2022-2032

Figure 146: Oceania Specimen Transport Bags Market Value (US$ Mn) by Material, 2022-2032

Figure 147: Oceania Specimen Transport Bags Market Value (US$ Mn) by Closure Type, 2022-2032

Figure 148: Oceania Specimen Transport Bags Market Value (US$ Mn) by End Use, 2022-2032

Figure 149: Oceania Specimen Transport Bags Market Value (US$ Mn) by Country, 2022-2032

Figure 150: Oceania Specimen Transport Bags Market Value (US$ Mn) Analysis by Country, 2015-2021

Figure 151: Oceania Specimen Transport Bags Market Volume (Units) Analysis by Country, 2015-2032

Figure 152: Oceania Specimen Transport Bags Market Value Share (%) and BPS Analysis by Country, 2022 & 2032

Figure 153: Oceania Specimen Transport Bags Market Y-o-Y Growth (%) Projections by Country, 2022-2032

Figure 154: Oceania Specimen Transport Bags Market Value (US$ Mn) Analysis by Material, 2015-2021

Figure 155: Oceania Specimen Transport Bags Market Volume (Units) Analysis by Material, 2015-2032

Figure 156: Oceania Specimen Transport Bags Market Value Share (%) and BPS Analysis by Material, 2022 & 2032

Figure 157: Oceania Specimen Transport Bags Market Y-o-Y Growth (%) Projections by Material, 2022-2032

Figure 158: Oceania Specimen Transport Bags Market Value (US$ Mn) Analysis by Closure Type, 2015-2021

Figure 159: Oceania Specimen Transport Bags Market Volume (Units) Analysis by Closure Type, 2015-2032

Figure 160: Oceania Specimen Transport Bags Market Value Share (%) and BPS Analysis by Closure Type, 2022 & 2032

Figure 161: Oceania Specimen Transport Bags Market Y-o-Y Growth (%) Projections by Closure Type, 2022-2032

Figure 162: Oceania Specimen Transport Bags Market Value (US$ Mn) Analysis by End Use, 2015-2021

Figure 163: Oceania Specimen Transport Bags Market Volume (Units) Analysis by End Use, 2015-2032

Figure 164: Oceania Specimen Transport Bags Market Value Share (%) and BPS Analysis by End Use, 2022 & 2032

Figure 165: Oceania Specimen Transport Bags Market Y-o-Y Growth (%) Projections by End Use, 2022-2032

Figure 166: Oceania Specimen Transport Bags Market Attractiveness by Material, 2022-2032

Figure 167: Oceania Specimen Transport Bags Market Attractiveness by Closure Type, 2022-2032

Figure 168: Oceania Specimen Transport Bags Market Attractiveness by End Use, 2022-2032

Figure 169 Oceania Specimen Transport Bags Market Attractiveness by Country, 2022-2032

Figure 170: MEA Specimen Transport Bags Market Value (US$ Mn) by Material, 2022-2032

Figure 171: MEA Specimen Transport Bags Market Value (US$ Mn) by Closure Type, 2022-2032

Figure 172: MEA Specimen Transport Bags Market Value (US$ Mn) by End Use, 2022-2032

Figure 173: MEA Specimen Transport Bags Market Value (US$ Mn) by Country, 2022-2032

Figure 174: MEA Specimen Transport Bags Market Value (US$ Mn) Analysis by Country, 2015-2021

Figure 175: MEA Specimen Transport Bags Market Volume (Units) Analysis by Country, 2015-2032

Figure 176: MEA Specimen Transport Bags Market Value Share (%) and BPS Analysis by Country, 2022 & 2032

Figure 177: MEA Specimen Transport Bags Market Y-o-Y Growth (%) Projections by Country, 2022-2032

Figure 178: MEA Specimen Transport Bags Market Value (US$ Mn) Analysis by Material, 2015-2021

Figure 179: MEA Specimen Transport Bags Market Volume (Units) Analysis by Material, 2015-2032

Figure 180: MEA Specimen Transport Bags Market Value Share (%) and BPS Analysis by Material, 2022 & 2032

Figure 181: MEA Specimen Transport Bags Market Y-o-Y Growth (%) Projections by Material, 2022-2032

Figure 182: MEA Specimen Transport Bags Market Value (US$ Mn) Analysis by Closure Type, 2015-2021

Figure 183: MEA Specimen Transport Bags Market Volume (Units) Analysis by Closure Type, 2015-2032

Figure 184: MEA Specimen Transport Bags Market Value Share (%) and BPS Analysis by Closure Type, 2022 & 2032

Figure 185: MEA Specimen Transport Bags Market Y-o-Y Growth (%) Projections by Closure Type, 2022-2032

Figure 186: MEA Specimen Transport Bags Market Value (US$ Mn) Analysis by End Use, 2015-2021

Figure 187: MEA Specimen Transport Bags Market Volume (Units) Analysis by End Use, 2015-2032

Figure 188: MEA Specimen Transport Bags Market Value Share (%) and BPS Analysis by End Use, 2022 & 2032

Figure 189: MEA Specimen Transport Bags Market Y-o-Y Growth (%) Projections by End Use, 2022-2032

Figure 190: MEA Specimen Transport Bags Market Attractiveness by Material, 2022-2032

Figure 191: MEA Specimen Transport Bags Market Attractiveness by Closure Type, 2022-2032

Figure 192: MEA Specimen Transport Bags Market Attractiveness by End Use, 2022-2032

Figure 193 MEA Specimen Transport Bags Market Attractiveness by Country, 2022-2032

Recommendations

Packaging

Aluminum Beverage Bags Market

Published : September 2022

Packaging

Self-Sealing Bags Market

Published : July 2022

Explore Packaging Insights

View Reports

Specimen Transport Bags Market