Sponge City Rainwater Management Systems Market Forecast and Outlook 2025 to 2035

The global sponge city rainwater management systems market is projected to grow from USD 1.6 billion in 2025 to approximately USD 2.7 billion by 2035, recording an absolute increase of USD 1.1 billion over the forecast period. This translates into a total growth of 67.7%, with the market forecast to expand at a CAGR of 5.3% between 2025 and 2035.

The overall market size is expected to grow by nearly 1.7X during the same period, supported by increasing urban flooding challenges driving adoption of integrated water management infrastructure, growing government investment in climate adaptation programs across metropolitan regions, and rising emphasis on sustainable urban development requiring advanced stormwater retention systems for environmental compliance.

Urban planners and municipal authorities across developed and emerging economies are implementing comprehensive water management frameworks that prioritize natural infiltration processes over conventional drainage systems.

Climate change impacts, including intensified precipitation events and prolonged flooding periods, are accelerating infrastructure investments in permeable collection technologies and modular storage solutions. Metropolitan regions experiencing rapid urbanization face mounting pressure to retrofit existing drainage networks with sustainable systems that reduce surface runoff while supporting groundwater recharge objectives. Regulatory frameworks mandating low-impact development standards are creating sustained demand for engineered rainwater management modules that integrate with urban landscapes. Major infrastructure development projects, including smart city initiatives and transit-oriented developments, are incorporating sponge city principles as foundational design requirements, driving adoption of standardized collection modules and load-bearing systems that support vehicular traffic loads while maintaining hydraulic performance specifications.
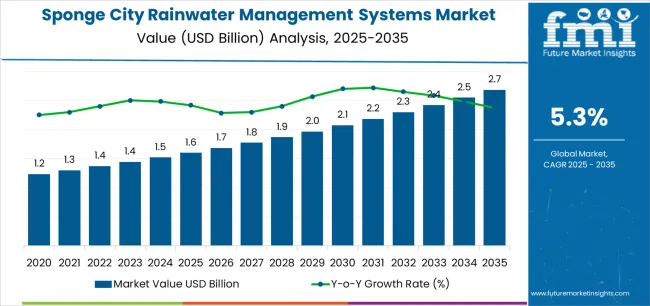
Quick Stats for Sponge City Rainwater Management Systems Market

  • Sponge City Rainwater Management Systems Market Value (2025): USD 1.6 billion
  • Sponge City Rainwater Management Systems Market Forecast Value (2035): USD 2.7 billion
  • Sponge City Rainwater Management Systems Market CAGR (2025 to 2035): 5.3%
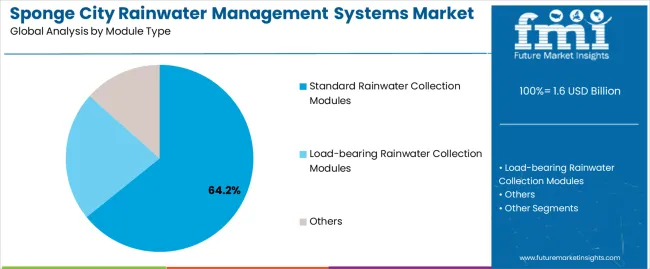
  • Leading Segment by Module Type (2025): Standard Rainwater Collection Modules (64.2%)
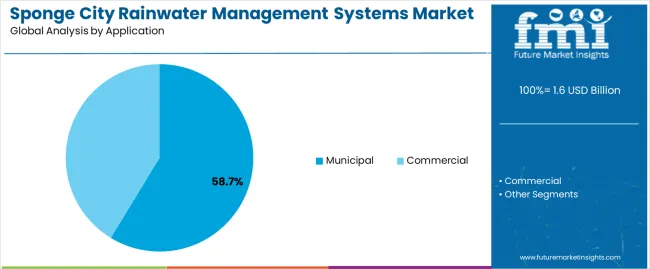
  • Leading Segment by Application (2025): Municipal (58.7%)
  • Key Growth Regions: Asia Pacific, Europe, and North America
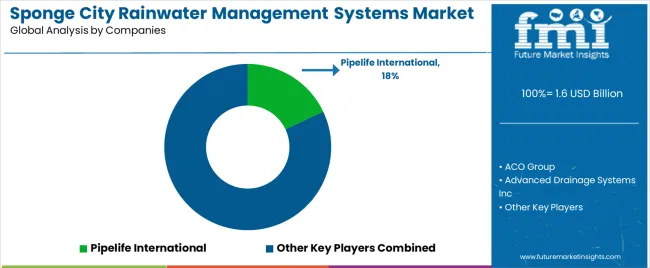
  • Top Companies by Market Share: Pipelife International, ACO Group, Advanced Drainage Systems Inc

Sponge City Rainwater Management Systems Market Market Value Analysis


Sponge City Rainwater Management Systems Market Key Takeaways

Metric Value
Market Value (2025) USD 1.6 billion
Market Forecast Value (2035) USD 2.6 billion
Forecast CAGR (2025 to 2035) 5.3%

Why is the Sponge City Rainwater Management Systems Market Growing?

CLIMATE ADAPTATION REQUIREMENTS INFRASTRUCTURE MODERNIZATION REGULATORY FRAMEWORKS
  • Urban Flooding Challenges: Increasing frequency of extreme precipitation events requiring integrated stormwater management infrastructure capable of handling peak flow volumes.
  • Water Resource Management: Growing recognition of groundwater depletion requiring systematic recharge infrastructure supporting long-term water security objectives.
  • Climate Resilience Planning: Municipal adaptation strategies prioritizing flood mitigation systems that reduce infrastructure damage and service disruptions.
  • Smart City Development:Urban development programs incorporating advanced water management technologies supporting environmental sustainability targets.
  • Infrastructure Replacement:Aging conventional drainage systems requiring comprehensive upgrades to meet contemporary performance standards.
  • Transit Infrastructure Integration:Major transportation projects requiring load-bearing rainwater management systems compatible with parking facilities and roadway applications.
  • Low-Impact Development Standards: Building codes mandating on-site stormwater retention reducing burden on municipal drainage networks.
  • Environmental Compliance: Water quality regulations requiring treatment of urban runoff before discharge into natural waterways.
  • Sustainable Construction Requirements: Green building certification programs establishing performance benchmarks for integrated water management systems.

What is the Segmentation of the Sponge City Rainwater Management Systems Market?

Category Segments Covered
By Module Type Standard Rainwater Collection Modules, Load-bearing Rainwater Collection Modules, Others
By Application Municipal, Commercial
By Region North America, Europe, Asia Pacific, Latin America, Middle East & Africa

Sponge City Rainwater Management Systems Market Analysis by Module Type

Sponge City Rainwater Management Systems Market Analysis By Module Type

Segment 2025 to 2035 Outlook
Standard Rainwater Collection Modules
  • Leader in 2025 with 64.2% market share, expected to maintain dominance through 2035. Widely adopted for residential developments, landscaping applications, and non-vehicular zones requiring basic infiltration capacity. Established manufacturing processes and competitive pricing support broad market penetration across municipal and commercial projects.
  • Momentum: steady growth driven by residential development and public park installations.
  • Watchouts: competition from emerging modular designs, standardization pressure from international building codes.
Load-bearing Rainwater Collection Modules
  • Represents 28.5% market share in 2025, gaining traction in parking facilities, driveways, and roadway applications requiring structural integrity under vehicular loads. Premium pricing reflects engineering complexity and material specifications for traffic-rated installations.
  • Momentum: rising adoption in commercial developments and transportation infrastructure projects requiring integrated stormwater management beneath paved surfaces.
  • Watchouts: installation complexity requiring specialized contractors, higher upfront costs limiting adoption in cost-sensitive projects.
Others
  • Niche segment at 7.3% share including specialized modular systems for unique applications such as rooftop installations, vertical drainage systems, and hybrid treatment technologies. Limited volume but supports innovation in constrained urban environments.
  • Momentum: selective growth in high-density urban retrofits and specialized architectural projects.
  • Watchouts: project-specific engineering requirements, limited standardization affecting supply chain efficiency.

Sponge City Rainwater Management Systems Market Analysis by Application

Sponge City Rainwater Management Systems Market Analysis By Application

Segment 2025 to 2035 Outlook
Municipal
  • Dominant segment with 58.7% market share in 2025, driven by government-funded infrastructure programs addressing urban flooding and environmental compliance. Public sector procurement emphasizes lifecycle cost analysis and long-term performance reliability over initial investment considerations.
  • Momentum: strong growth supported by climate adaptation funding and smart city initiatives across metropolitan regions. Projects include public parks, street retrofits, and municipal facility installations.
  • Watchouts: budget constraints in smaller municipalities, political cycles affecting project continuity, lengthy approval processes delaying implementation timelines.
Commercial
  • Accounts for 41.3% share in 2025, encompassing office developments, retail centers, industrial facilities, and institutional projects. Private sector adoption driven by sustainability certifications, regulatory compliance, and corporate environmental commitments.
  • Momentum: moderate growth as developers integrate rainwater management into building designs to meet green building standards and reduce utility costs. Premium commercial projects increasingly specify load-bearing modules for parking areas and driveways.
  • Watchouts: economic sensitivity affecting commercial construction volumes, developer cost optimization pressures, varying enforcement of stormwater regulations across jurisdictions.

What are the Key Drivers, Restraints, and Trends in the Sponge City Rainwater Management Systems Market?

DRIVERS RESTRAINTS KEY TRENDS
  • Climate Change Impacts: Intensifying precipitation patterns requiring enhanced stormwater infrastructure capable of managing increased runoff volumes during extreme weather events.
  • Urban Expansion Pressure: Rapid urbanization reducing natural infiltration areas creating demand for engineered solutions that restore hydrological balance.
  • Water Security Initiatives: Government programs prioritizing groundwater recharge supporting long-term water availability in water-stressed regions.
  • Installation Cost Barriers: Higher upfront investment compared to conventional drainage systems affecting adoption in cost-sensitive markets and budget-constrained municipalities.
  • Technical Knowledge Gaps: Limited contractor expertise in modular system installation requiring training programs and technical support infrastructure.
  • Maintenance Requirements: Periodic cleaning and inspection protocols necessary for system performance creating operational considerations for asset managers.
  • Integrated System Design: Development of comprehensive platforms combining rainwater collection, storage, and controlled release capabilities supporting multiple water management objectives.
  • Digitalization Integration: Incorporation of monitoring sensors and data analytics enabling real-time performance tracking and predictive maintenance optimization.
  • Modular Standardization: Industry consolidation around standardized module dimensions and connection protocols improving supply chain efficiency and installation productivity.

What is the Analysis of the Sponge City Rainwater Management Systems Market by Key Countries?

Sponge City Rainwater Management Systems Market Cagr Analysis By Country

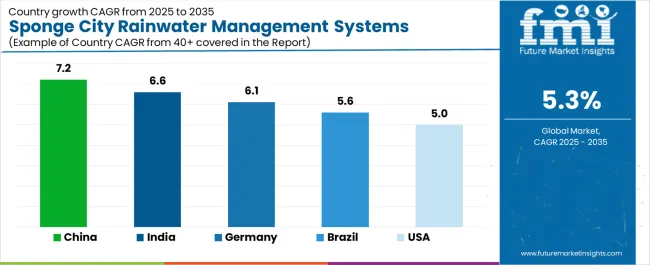
Country CAGR (2025 to 2035)
China 7.2%
India 6.6%
Germany 6.1%
Brazil 5.6%
United States 5.0%

China Leads Global Market Expansion with National Sponge City Initiative

Sponge City Rainwater Management Systems Market Country Value Analysis

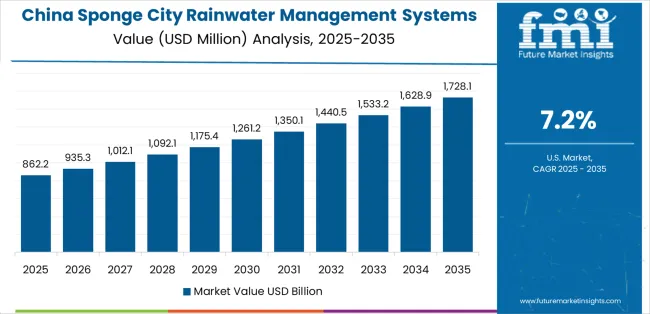
Revenue from sponge city rainwater management systems in China is expected to expand at a CAGR of 7.2% from 2025 to 2035, driven by comprehensive national programs targeting 80% of urban areas for integrated water management implementation by 2030. The government's Sponge City Initiative, launched in 2015, has expanded to cover over 700 cities, creating sustained demand for modular collection systems across municipal infrastructure projects and commercial developments. State-owned enterprises and municipal water authorities are establishing regional manufacturing capabilities to support large-scale deployment requirements while meeting domestic content preferences. Major metropolitan regions including Beijing, Shanghai, Shenzhen, and Chengdu are implementing comprehensive retrofits of existing drainage infrastructure, creating opportunities for both standard and load-bearing module suppliers.

  • National climate adaptation programs allocating significant capital expenditure toward flood mitigation infrastructure are supporting widespread adoption of permeable collection systems across urban development projects
  • Water conservation mandates and groundwater recharge objectives are creating demand for integrated rainwater management solutions that support multiple environmental policy targets
  • Rapid urbanization in second and third-tier cities requiring sustainable infrastructure development is facilitating market expansion beyond established coastal metropolitan regions

India Demonstrates Strong Growth Potential with Urban Water Crisis Response

Demand for sponge city rainwater management systems in India is projected to grow at a CAGR of 6.6% from 2025 to 2035, supported by critical water scarcity challenges affecting major cities and government initiatives promoting rainwater harvesting across urban areas. The National Water Mission and Smart Cities Mission are driving infrastructure investments in integrated water management systems, with particular emphasis on groundwater recharge capabilities. State governments in Tamil Nadu, Karnataka, and Rajasthan have implemented mandatory rainwater harvesting regulations for commercial and residential buildings, creating sustained demand for modular collection infrastructure. Private developers and infrastructure contractors are establishing local manufacturing operations to serve growing project pipelines while navigating complex regulatory requirements across different states.

  • Urban flooding events in major metropolitan regions including Mumbai, Chennai, and Bangalore are accelerating municipal investments in stormwater management infrastructure requiring advanced collection and retention systems
  • Water table depletion in northern India is driving adoption of rainwater recharge systems as critical infrastructure for long-term water security
  • Public-private partnership models for municipal water infrastructure are facilitating project financing and accelerating implementation timelines across tier-1 and tier-2 cities

Germany Maintains Leadership in European Market with Technical Standards

Demand for sponge city rainwater management systems in Germany is anticipated to increase at a CAGR of 6.1% from 2025 to 2035, supported by stringent environmental regulations and comprehensive water management frameworks requiring on-site stormwater retention for new developments. German municipalities have established detailed technical specifications for rainwater management systems, creating a preference for high-quality engineered solutions that demonstrate long-term performance reliability. The country's decentralized water management approach places responsibility on property owners to manage stormwater on-site, driving consistent demand across residential, commercial, and municipal projects. Major infrastructure investments in climate adaptation programs are supporting retrofits of existing urban areas with permeable systems that reduce combined sewer overflow events.

  • Federal water quality regulations establishing strict performance requirements for urban runoff treatment are driving adoption of certified modular systems with documented hydraulic characteristics
  • Municipal sustainability programs prioritizing low-impact development principles are facilitating integration of rainwater management systems in public infrastructure projects across major cities
  • Building code requirements for green infrastructure are creating consistent demand for standardized modules that simplify regulatory approval and installation processes

Brazil Expands Market Through Infrastructure Modernization Programs

Demand for sponge city rainwater management systems in Brazil is expected to grow at a CAGR of 5.6% from 2025 to 2035, driven by infrastructure investments addressing chronic urban flooding challenges in major metropolitan regions and expanding adoption of sustainable urban development practices. Cities including São Paulo, Rio de Janeiro, and Belo Horizonte are implementing comprehensive stormwater management strategies that incorporate permeable collection systems in public infrastructure projects. Federal programs supporting municipal infrastructure modernization are providing financing mechanisms for climate adaptation investments, including integrated water management systems. Private sector developers are incorporating rainwater management features in commercial and residential projects to meet environmental licensing requirements and differentiate premium developments.

  • Seasonal flooding events causing significant economic losses are accelerating municipal investments in stormwater retention infrastructure across major urban centers
  • Environmental licensing requirements for large developments are creating demand for engineered rainwater management solutions that demonstrate regulatory compliance
  • Infrastructure financing programs including development bank lending are facilitating project implementation despite budget constraints in many municipalities

United States Focuses on Regulatory Compliance and Green Infrastructure

Demand for sponge city rainwater management systems in the United States is forecasted to increase at a CAGR of 5.0% from 2025 to 2035, driven by federal and state stormwater regulations requiring on-site management of runoff from new developments and infrastructure retrofits. The Environmental Protection Agency's Municipal Separate Storm Sewer System permit program establishes performance requirements for urban stormwater management, creating consistent demand for engineered collection systems across regulated areas. State-level initiatives, including California's sustainable groundwater management regulations and Northeastern states' combined sewer overflow reduction programs, are driving infrastructure investments in integrated water management systems. Private developers are incorporating rainwater management features to meet LEED certification requirements and local green building ordinances.
  • Combined sewer overflow reduction mandates in older cities are supporting adoption of distributed rainwater collection systems that reduce peak flows entering municipal drainage networks
  • Water quality regulations requiring treatment of urban runoff before discharge into protected waterways are creating demand for integrated management systems with filtration capabilities
  • Drought-prone regions including the Southwest are implementing groundwater recharge programs that incorporate rainwater collection infrastructure as critical water supply enhancement measures

What is the Europe Market Split by Country for Sponge City Rainwater Management Systems?

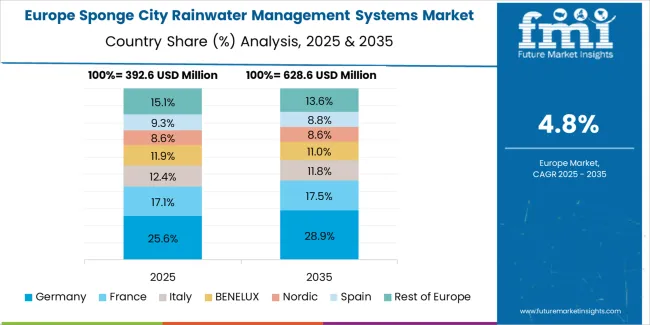
Sponge City Rainwater Management Systems Market Europe Country Market Share Analysis, 2025 & 2035

The sponge city rainwater management systems market in Europe is projected to grow from USD 398.5 million in 2025 to USD 712.4 million by 2035, registering a CAGR of 6.0% over the forecast period. Germany is expected to maintain its leadership position with a 29.3% market share in 2025, expanding to 30.1% by 2035, supported by comprehensive water management regulations and advanced technical standards for stormwater infrastructure.

Netherlands follows with a 19.7% share in 2025, projected to reach 20.4% by 2035, driven by extensive experience with integrated water management and ongoing climate adaptation programs in low-lying urban areas. The United Kingdom holds a 16.8% share in 2025, expected to reach 17.1% by 2035, supported by sustainable drainage system regulations and municipal flood risk management investments. France commands a 15.2% share in 2025, while Sweden accounts for 9.4% driven by Nordic sustainability standards. The Rest of Europe region is anticipated to maintain an 9.6% share through 2035, with emerging adoption in Eastern European cities implementing EU-aligned environmental standards and climate adaptation frameworks requiring integrated stormwater management infrastructure.
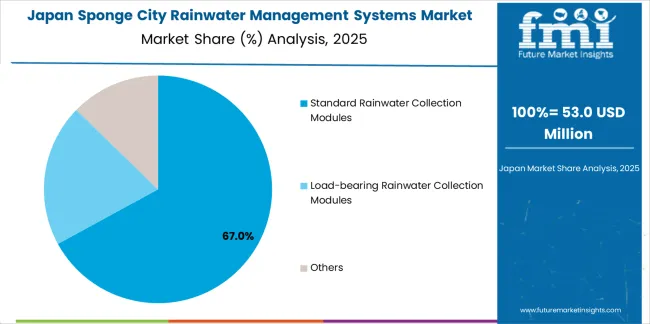
Premium Quality Standards Define Japanese Market Dynamics

Sponge City Rainwater Management Systems Market Japan Market Share Analysis By Module Type

Japanese sponge city rainwater management operations reflect the country's rigorous technical standards and comprehensive disaster preparedness frameworks. Major municipalities including Tokyo, Osaka, and Yokohama maintain sophisticated stormwater management requirements developed through decades of typhoon and flood response experience. Government agencies enforce detailed specifications for rainwater collection systems, requiring extensive performance testing and certification processes that typically span 18-24 months before products gain approval for municipal infrastructure projects.

The Japanese market demonstrates unique application preferences, with significant demand for compact modular systems designed for high-density urban environments where underground space utilization requires efficient storage configurations. Municipal authorities specify precise infiltration rates, structural load capacities, and seismic performance requirements that exceed international standards, creating barriers for foreign suppliers without established local testing relationships and technical support infrastructure.

Regulatory oversight through the Ministry of Land, Infrastructure, Transport and Tourism emphasizes comprehensive disaster resilience and long-term performance validation. The procurement system favors suppliers with documented installation histories spanning multiple decades, creating advantages for established domestic manufacturers and joint ventures with Japanese engineering firms. Quality assurance protocols require batch testing and on-site inspection that necessitate local technical support capabilities.

Supply chain management prioritizes relationship-based partnerships rather than transactional procurement. Japanese municipalities typically maintain long-term supplier relationships, with contract renewals emphasizing performance consistency over competitive bidding. This stability supports specialized manufacturing investments tailored to Japanese specifications, including custom module dimensions compatible with local construction practices and traffic load requirements specific to Japanese vehicle weight distributions.
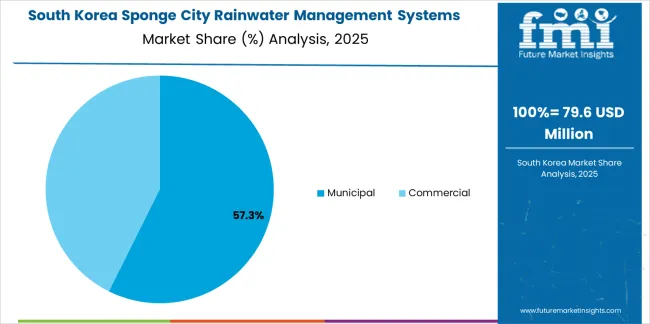
Advanced Urban Infrastructure Drives South Korean Market Development

Sponge City Rainwater Management Systems Market South Korea Market Share Analysis By Application

South Korean sponge city rainwater management operations reflect the country's rapid urbanization management and comprehensive smart city development programs. Major metropolitan governments including Seoul, Busan, and Incheon are implementing integrated water management strategies that incorporate rainwater collection systems throughout public infrastructure modernization projects and private development requirements. Government initiatives including the Water Circulation City Program establish performance benchmarks for stormwater retention, creating consistent demand for engineered modular systems across municipal and commercial applications.

The Korean market demonstrates particular strength in integrating rainwater management with urban redevelopment projects, with authorities requiring comprehensive stormwater solutions for high-rise residential complexes and commercial developments. This creates demand for load-bearing modules capable of supporting parking structures while maintaining hydraulic performance specifications. Technical requirements emphasize durability under freeze-thaw cycling and compatibility with district-scale water management networks that coordinate multiple building systems.

Regulatory frameworks administered by the Ministry of Environment establish stringent water quality standards and retention capacity requirements that influence system design specifications. Municipalities enforce non-point source pollution control measures requiring treatment of urban runoff before infiltration or discharge, driving adoption of integrated systems combining collection and filtration capabilities. The regulatory environment particularly favors suppliers demonstrating compliance with Korean Construction Standards and maintaining local technical support infrastructure.

Supply chain efficiency benefits from concentrated manufacturing capabilities and established relationships between major construction firms and material suppliers. Korean contractors typically prefer domestically manufactured systems due to warranty support considerations and compatibility with local installation practices. However, premium projects increasingly specify European-manufactured modules for applications requiring exceptional structural performance or specialized hydraulic characteristics, creating opportunities for international suppliers with established distribution partnerships and technical certification in Korean standards.
What is the Competitive Landscape of the Sponge City Rainwater Management Systems Market?

Sponge City Rainwater Management Systems Market Analysis By Company

Market concentration reflects regional manufacturing advantages and technical certification requirements rather than global brand dominance. Leading suppliers maintain geographic strongholds where local engineering standards, contractor relationships, and regulatory familiarity create competitive barriers. European manufacturers leverage technical sophistication and comprehensive product documentation to command premium pricing in developed markets, while regional players in Asia Pacific compete through cost advantages and customization capabilities for local project requirements. Distribution strategies vary by market maturity, with established regions favoring direct relationships between manufacturers and large contractors, while emerging markets rely on distributor networks serving fragmented contractor bases.

Technical differentiation centers on structural performance, installation efficiency, and hydraulic modeling capabilities rather than proprietary technologies with patent protection. Load-bearing module suppliers compete on certified traffic ratings and connection system designs that simplify field installation while maintaining structural integrity. Standard module manufacturers emphasize cost competitiveness and availability through distributor networks serving residential and light commercial applications. Integration with monitoring technologies represents emerging differentiation as municipalities seek data-driven infrastructure management capabilities.

Market entry barriers include capital requirements for manufacturing facilities, engineering certification processes spanning multiple years, and contractor relationship development essential for project specification. Established suppliers maintain advantages through documented project histories, technical support infrastructure, and financial capacity to support bid bonds and performance guarantees required for large municipal contracts. Consolidation pressures increase as municipalities standardize specifications around fewer certified suppliers, driving smaller manufacturers toward niche applications or regional market focus. Vertical integration remains limited, with most suppliers maintaining pure manufacturing and technical support roles rather than construction capabilities. Strategic priorities include expanding certified product portfolios across traffic-rating categories, establishing regional manufacturing to serve growing markets while managing logistics costs, and developing digital monitoring capabilities that support municipal asset management requirements.

Key Players in the Sponge City Rainwater Management Systems Market

  • Pipelife International
  • ACO Group
  • Advanced Drainage Systems Inc
  • Doctor Rain
  • ParkUSA
  • Oldcastle Infrastructure
  • StormTank
  • Xerxes
  • GRAF
  • FRÄNKISCH
  • Jiangsu Hippo Plastics
  • REHAU
  • Jiangsu Bluewater
  • Beijing Tidelion
  • Cirtex Industries Ltd
  • Jensen Precast
  • Baozhen

Scope of the Report

Items Values
Quantitative Units USD 1.6 billion
Module Type Standard Rainwater Collection Modules, Load-bearing Rainwater Collection Modules, Others
Application Municipal, Commercial
Distribution Channel Not Applicable
Regions Covered North America, Latin America, Europe, Asia Pacific, Middle East & Africa
Country Covered China, India, Germany, Brazil, United States, and other 40+ countries
Key Companies Profiled Pipelife International, ACO Group, Advanced Drainage Systems Inc, Doctor Rain, ParkUSA, Oldcastle Infrastructure, StormTank, Xerxes, GRAF, FRÄNKISCH, Jiangsu Hippo Plastics, REHAU, Jiangsu Bluewater, Beijing Tidelion, Cirtex Industries Ltd, Jensen Precast, Baozhen
Additional Attributes Dollar sales by module type/application, regional demand (NA, EU, APAC), competitive landscape, municipal vs commercial adoption, climate adaptation integration, and sustainable urban development innovations driving water management enhancement, environmental compliance, and infrastructure efficiency

Sponge City Rainwater Management Systems Market Segmentation

By Module Type:

  • Standard Rainwater Collection Modules
  • Load-bearing Rainwater Collection Modules
  • Others

By Application:

  • Municipal
  • Commercial

By Region:

  • North America
  • Europe
  • Asia Pacific
  • Latin America
  • Middle East & Africa

Frequently Asked Questions

How big is the sponge city rainwater management systems market in 2025?

The global sponge city rainwater management systems market is estimated to be valued at USD 1.6 billion in 2025.

What will be the size of sponge city rainwater management systems market in 2035?

The market size for the sponge city rainwater management systems market is projected to reach USD 2.7 billion by 2035.

How much will be the sponge city rainwater management systems market growth between 2025 and 2035?

The sponge city rainwater management systems market is expected to grow at a 5.3% CAGR between 2025 and 2035.

What are the key product types in the sponge city rainwater management systems market?

The key product types in sponge city rainwater management systems market are standard rainwater collection modules, load-bearing rainwater collection modules and others.

Which application segment to contribute significant share in the sponge city rainwater management systems market in 2025?

In terms of application, municipal segment to command 58.7% share in the sponge city rainwater management systems market in 2025.

Table of Content

  1. Executive Summary
    • Global Market Outlook
    • Demand to side Trends
    • Supply to side Trends
    • Technology Roadmap Analysis
    • Analysis and Recommendations
  2. Market Overview
    • Market Coverage / Taxonomy
    • Market Definition / Scope / Limitations
  3. Market Background
    • Market Dynamics
      • Drivers
      • Restraints
      • Opportunity
      • Trends
    • Scenario Forecast
      • Demand in Optimistic Scenario
      • Demand in Likely Scenario
      • Demand in Conservative Scenario
    • Opportunity Map Analysis
    • Product Life Cycle Analysis
    • Supply Chain Analysis
    • Investment Feasibility Matrix
    • Value Chain Analysis
    • PESTLE and Porter’s Analysis
    • Regulatory Landscape
    • Regional Parent Market Outlook
    • Production and Consumption Statistics
    • Import and Export Statistics
  4. Global Market Analysis 2020 to 2024 and Forecast, 2025 to 2035
    • Historical Market Size Value (USD Million) Analysis, 2020 to 2024
    • Current and Future Market Size Value (USD Million) Projections, 2025 to 2035
      • Y to o to Y Growth Trend Analysis
      • Absolute $ Opportunity Analysis
  5. Global Market Pricing Analysis 2020 to 2024 and Forecast 2025 to 2035
  6. Global Market Analysis 2020 to 2024 and Forecast 2025 to 2035, By Module Type
    • Introduction / Key Findings
    • Historical Market Size Value (USD Million) Analysis By Module Type , 2020 to 2024
    • Current and Future Market Size Value (USD Million) Analysis and Forecast By Module Type , 2025 to 2035
      • Standard Rainwater Collection Modules
      • Load-bearing Rainwater Collection Modules
      • Others
    • Y to o to Y Growth Trend Analysis By Module Type , 2020 to 2024
    • Absolute $ Opportunity Analysis By Module Type , 2025 to 2035
  7. Global Market Analysis 2020 to 2024 and Forecast 2025 to 2035, By Application
    • Introduction / Key Findings
    • Historical Market Size Value (USD Million) Analysis By Application, 2020 to 2024
    • Current and Future Market Size Value (USD Million) Analysis and Forecast By Application, 2025 to 2035
      • Municipal
      • Commercial
    • Y to o to Y Growth Trend Analysis By Application, 2020 to 2024
    • Absolute $ Opportunity Analysis By Application, 2025 to 2035
  8. Global Market Analysis 2020 to 2024 and Forecast 2025 to 2035, By Region
    • Introduction
    • Historical Market Size Value (USD Million) Analysis By Region, 2020 to 2024
    • Current Market Size Value (USD Million) Analysis and Forecast By Region, 2025 to 2035
      • North America
      • Latin America
      • Western Europe
      • Eastern Europe
      • East Asia
      • South Asia and Pacific
      • Middle East & Africa
    • Market Attractiveness Analysis By Region
  9. North America Market Analysis 2020 to 2024 and Forecast 2025 to 2035, By Country
    • Historical Market Size Value (USD Million) Trend Analysis By Market Taxonomy, 2020 to 2024
    • Market Size Value (USD Million) Forecast By Market Taxonomy, 2025 to 2035
      • By Country
        • USA
        • Canada
        • Mexico
      • By Module Type
      • By Application
    • Market Attractiveness Analysis
      • By Country
      • By Module Type
      • By Application
    • Key Takeaways
  10. Latin America Market Analysis 2020 to 2024 and Forecast 2025 to 2035, By Country
    • Historical Market Size Value (USD Million) Trend Analysis By Market Taxonomy, 2020 to 2024
    • Market Size Value (USD Million) Forecast By Market Taxonomy, 2025 to 2035
      • By Country
        • Brazil
        • Chile
        • Rest of Latin America
      • By Module Type
      • By Application
    • Market Attractiveness Analysis
      • By Country
      • By Module Type
      • By Application
    • Key Takeaways
  11. Western Europe Market Analysis 2020 to 2024 and Forecast 2025 to 2035, By Country
    • Historical Market Size Value (USD Million) Trend Analysis By Market Taxonomy, 2020 to 2024
    • Market Size Value (USD Million) Forecast By Market Taxonomy, 2025 to 2035
      • By Country
        • Germany
        • UK
        • Italy
        • Spain
        • France
        • Nordic
        • BENELUX
        • Rest of Western Europe
      • By Module Type
      • By Application
    • Market Attractiveness Analysis
      • By Country
      • By Module Type
      • By Application
    • Key Takeaways
  12. Eastern Europe Market Analysis 2020 to 2024 and Forecast 2025 to 2035, By Country
    • Historical Market Size Value (USD Million) Trend Analysis By Market Taxonomy, 2020 to 2024
    • Market Size Value (USD Million) Forecast By Market Taxonomy, 2025 to 2035
      • By Country
        • Russia
        • Poland
        • Hungary
        • Balkan & Baltic
        • Rest of Eastern Europe
      • By Module Type
      • By Application
    • Market Attractiveness Analysis
      • By Country
      • By Module Type
      • By Application
    • Key Takeaways
  13. East Asia Market Analysis 2020 to 2024 and Forecast 2025 to 2035, By Country
    • Historical Market Size Value (USD Million) Trend Analysis By Market Taxonomy, 2020 to 2024
    • Market Size Value (USD Million) Forecast By Market Taxonomy, 2025 to 2035
      • By Country
        • China
        • Japan
        • South Korea
      • By Module Type
      • By Application
    • Market Attractiveness Analysis
      • By Country
      • By Module Type
      • By Application
    • Key Takeaways
  14. South Asia and Pacific Market Analysis 2020 to 2024 and Forecast 2025 to 2035, By Country
    • Historical Market Size Value (USD Million) Trend Analysis By Market Taxonomy, 2020 to 2024
    • Market Size Value (USD Million) Forecast By Market Taxonomy, 2025 to 2035
      • By Country
        • India
        • ASEAN
        • Australia & New Zealand
        • Rest of South Asia and Pacific
      • By Module Type
      • By Application
    • Market Attractiveness Analysis
      • By Country
      • By Module Type
      • By Application
    • Key Takeaways
  15. Middle East & Africa Market Analysis 2020 to 2024 and Forecast 2025 to 2035, By Country
    • Historical Market Size Value (USD Million) Trend Analysis By Market Taxonomy, 2020 to 2024
    • Market Size Value (USD Million) Forecast By Market Taxonomy, 2025 to 2035
      • By Country
        • Kingdom of Saudi Arabia
        • Other GCC Countries
        • Turkiye
        • South Africa
        • Other African Union
        • Rest of Middle East & Africa
      • By Module Type
      • By Application
    • Market Attractiveness Analysis
      • By Country
      • By Module Type
      • By Application
    • Key Takeaways
  16. Key Countries Market Analysis
    • USA
      • Pricing Analysis
      • Market Share Analysis, 2024
        • By Module Type
        • By Application
    • Canada
      • Pricing Analysis
      • Market Share Analysis, 2024
        • By Module Type
        • By Application
    • Mexico
      • Pricing Analysis
      • Market Share Analysis, 2024
        • By Module Type
        • By Application
    • Brazil
      • Pricing Analysis
      • Market Share Analysis, 2024
        • By Module Type
        • By Application
    • Chile
      • Pricing Analysis
      • Market Share Analysis, 2024
        • By Module Type
        • By Application
    • Germany
      • Pricing Analysis
      • Market Share Analysis, 2024
        • By Module Type
        • By Application
    • UK
      • Pricing Analysis
      • Market Share Analysis, 2024
        • By Module Type
        • By Application
    • Italy
      • Pricing Analysis
      • Market Share Analysis, 2024
        • By Module Type
        • By Application
    • Spain
      • Pricing Analysis
      • Market Share Analysis, 2024
        • By Module Type
        • By Application
    • France
      • Pricing Analysis
      • Market Share Analysis, 2024
        • By Module Type
        • By Application
    • India
      • Pricing Analysis
      • Market Share Analysis, 2024
        • By Module Type
        • By Application
    • ASEAN
      • Pricing Analysis
      • Market Share Analysis, 2024
        • By Module Type
        • By Application
    • Australia & New Zealand
      • Pricing Analysis
      • Market Share Analysis, 2024
        • By Module Type
        • By Application
    • China
      • Pricing Analysis
      • Market Share Analysis, 2024
        • By Module Type
        • By Application
    • Japan
      • Pricing Analysis
      • Market Share Analysis, 2024
        • By Module Type
        • By Application
    • South Korea
      • Pricing Analysis
      • Market Share Analysis, 2024
        • By Module Type
        • By Application
    • Russia
      • Pricing Analysis
      • Market Share Analysis, 2024
        • By Module Type
        • By Application
    • Poland
      • Pricing Analysis
      • Market Share Analysis, 2024
        • By Module Type
        • By Application
    • Hungary
      • Pricing Analysis
      • Market Share Analysis, 2024
        • By Module Type
        • By Application
    • Kingdom of Saudi Arabia
      • Pricing Analysis
      • Market Share Analysis, 2024
        • By Module Type
        • By Application
    • Turkiye
      • Pricing Analysis
      • Market Share Analysis, 2024
        • By Module Type
        • By Application
    • South Africa
      • Pricing Analysis
      • Market Share Analysis, 2024
        • By Module Type
        • By Application
  17. Market Structure Analysis
    • Competition Dashboard
    • Competition Benchmarking
    • Market Share Analysis of Top Players
      • By Regional
      • By Module Type
      • By Application
  18. Competition Analysis
    • Competition Deep Dive
      • Pipelife International
        • Overview
        • Product Portfolio
        • Profitability by Market Segments (Product/Age /Sales Channel/Region)
        • Sales Footprint
        • Strategy Overview
          • Marketing Strategy
          • Product Strategy
          • Channel Strategy
      • ACO Group
      • Advanced Drainage Systems Inc
      • Doctor Rain
      • ParkUSA
      • Oldcastle Infrastructure
      • StormTank
      • Xerxes
      • GRAF
      • FRÄNKISCH
      • Jiangsu Hippo Plastics
      • REHAU
      • Jiangsu Bluewater
  19. Assumptions & Acronyms Used
  20. Research Methodology

List of Tables

  • Table 1: Global Market Value (USD Million) Forecast by Region, 2020 to 2035
  • Table 2: Global Market Value (USD Million) Forecast by Module Type , 2020 to 2035
  • Table 3: Global Market Value (USD Million) Forecast by Application, 2020 to 2035
  • Table 4: North America Market Value (USD Million) Forecast by Country, 2020 to 2035
  • Table 5: North America Market Value (USD Million) Forecast by Module Type , 2020 to 2035
  • Table 6: North America Market Value (USD Million) Forecast by Application, 2020 to 2035
  • Table 7: Latin America Market Value (USD Million) Forecast by Country, 2020 to 2035
  • Table 8: Latin America Market Value (USD Million) Forecast by Module Type , 2020 to 2035
  • Table 9: Latin America Market Value (USD Million) Forecast by Application, 2020 to 2035
  • Table 10: Western Europe Market Value (USD Million) Forecast by Country, 2020 to 2035
  • Table 11: Western Europe Market Value (USD Million) Forecast by Module Type , 2020 to 2035
  • Table 12: Western Europe Market Value (USD Million) Forecast by Application, 2020 to 2035
  • Table 13: Eastern Europe Market Value (USD Million) Forecast by Country, 2020 to 2035
  • Table 14: Eastern Europe Market Value (USD Million) Forecast by Module Type , 2020 to 2035
  • Table 15: Eastern Europe Market Value (USD Million) Forecast by Application, 2020 to 2035
  • Table 16: East Asia Market Value (USD Million) Forecast by Country, 2020 to 2035
  • Table 17: East Asia Market Value (USD Million) Forecast by Module Type , 2020 to 2035
  • Table 18: East Asia Market Value (USD Million) Forecast by Application, 2020 to 2035
  • Table 19: South Asia and Pacific Market Value (USD Million) Forecast by Country, 2020 to 2035
  • Table 20: South Asia and Pacific Market Value (USD Million) Forecast by Module Type , 2020 to 2035
  • Table 21: South Asia and Pacific Market Value (USD Million) Forecast by Application, 2020 to 2035
  • Table 22: Middle East & Africa Market Value (USD Million) Forecast by Country, 2020 to 2035
  • Table 23: Middle East & Africa Market Value (USD Million) Forecast by Module Type , 2020 to 2035
  • Table 24: Middle East & Africa Market Value (USD Million) Forecast by Application, 2020 to 2035

List of Figures

  • Figure 1: Global Market Pricing Analysis
  • Figure 2: Global Market Value (USD Million) Forecast 2020-2035
  • Figure 3: Global Market Value Share and BPS Analysis by Module Type , 2025 and 2035
  • Figure 4: Global Market Y to o to Y Growth Comparison by Module Type , 2025-2035
  • Figure 5: Global Market Attractiveness Analysis by Module Type
  • Figure 6: Global Market Value Share and BPS Analysis by Application, 2025 and 2035
  • Figure 7: Global Market Y to o to Y Growth Comparison by Application, 2025-2035
  • Figure 8: Global Market Attractiveness Analysis by Application
  • Figure 9: Global Market Value (USD Million) Share and BPS Analysis by Region, 2025 and 2035
  • Figure 10: Global Market Y to o to Y Growth Comparison by Region, 2025-2035
  • Figure 11: Global Market Attractiveness Analysis by Region
  • Figure 12: North America Market Incremental Dollar Opportunity, 2025-2035
  • Figure 13: Latin America Market Incremental Dollar Opportunity, 2025-2035
  • Figure 14: Western Europe Market Incremental Dollar Opportunity, 2025-2035
  • Figure 15: Eastern Europe Market Incremental Dollar Opportunity, 2025-2035
  • Figure 16: East Asia Market Incremental Dollar Opportunity, 2025-2035
  • Figure 17: South Asia and Pacific Market Incremental Dollar Opportunity, 2025-2035
  • Figure 18: Middle East & Africa Market Incremental Dollar Opportunity, 2025-2035
  • Figure 19: North America Market Value Share and BPS Analysis by Country, 2025 and 2035
  • Figure 20: North America Market Value Share and BPS Analysis by Module Type , 2025 and 2035
  • Figure 21: North America Market Y to o to Y Growth Comparison by Module Type , 2025-2035
  • Figure 22: North America Market Attractiveness Analysis by Module Type
  • Figure 23: North America Market Value Share and BPS Analysis by Application, 2025 and 2035
  • Figure 24: North America Market Y to o to Y Growth Comparison by Application, 2025-2035
  • Figure 25: North America Market Attractiveness Analysis by Application
  • Figure 26: Latin America Market Value Share and BPS Analysis by Country, 2025 and 2035
  • Figure 27: Latin America Market Value Share and BPS Analysis by Module Type , 2025 and 2035
  • Figure 28: Latin America Market Y to o to Y Growth Comparison by Module Type , 2025-2035
  • Figure 29: Latin America Market Attractiveness Analysis by Module Type
  • Figure 30: Latin America Market Value Share and BPS Analysis by Application, 2025 and 2035
  • Figure 31: Latin America Market Y to o to Y Growth Comparison by Application, 2025-2035
  • Figure 32: Latin America Market Attractiveness Analysis by Application
  • Figure 33: Western Europe Market Value Share and BPS Analysis by Country, 2025 and 2035
  • Figure 34: Western Europe Market Value Share and BPS Analysis by Module Type , 2025 and 2035
  • Figure 35: Western Europe Market Y to o to Y Growth Comparison by Module Type , 2025-2035
  • Figure 36: Western Europe Market Attractiveness Analysis by Module Type
  • Figure 37: Western Europe Market Value Share and BPS Analysis by Application, 2025 and 2035
  • Figure 38: Western Europe Market Y to o to Y Growth Comparison by Application, 2025-2035
  • Figure 39: Western Europe Market Attractiveness Analysis by Application
  • Figure 40: Eastern Europe Market Value Share and BPS Analysis by Country, 2025 and 2035
  • Figure 41: Eastern Europe Market Value Share and BPS Analysis by Module Type , 2025 and 2035
  • Figure 42: Eastern Europe Market Y to o to Y Growth Comparison by Module Type , 2025-2035
  • Figure 43: Eastern Europe Market Attractiveness Analysis by Module Type
  • Figure 44: Eastern Europe Market Value Share and BPS Analysis by Application, 2025 and 2035
  • Figure 45: Eastern Europe Market Y to o to Y Growth Comparison by Application, 2025-2035
  • Figure 46: Eastern Europe Market Attractiveness Analysis by Application
  • Figure 47: East Asia Market Value Share and BPS Analysis by Country, 2025 and 2035
  • Figure 48: East Asia Market Value Share and BPS Analysis by Module Type , 2025 and 2035
  • Figure 49: East Asia Market Y to o to Y Growth Comparison by Module Type , 2025-2035
  • Figure 50: East Asia Market Attractiveness Analysis by Module Type
  • Figure 51: East Asia Market Value Share and BPS Analysis by Application, 2025 and 2035
  • Figure 52: East Asia Market Y to o to Y Growth Comparison by Application, 2025-2035
  • Figure 53: East Asia Market Attractiveness Analysis by Application
  • Figure 54: South Asia and Pacific Market Value Share and BPS Analysis by Country, 2025 and 2035
  • Figure 55: South Asia and Pacific Market Value Share and BPS Analysis by Module Type , 2025 and 2035
  • Figure 56: South Asia and Pacific Market Y to o to Y Growth Comparison by Module Type , 2025-2035
  • Figure 57: South Asia and Pacific Market Attractiveness Analysis by Module Type
  • Figure 58: South Asia and Pacific Market Value Share and BPS Analysis by Application, 2025 and 2035
  • Figure 59: South Asia and Pacific Market Y to o to Y Growth Comparison by Application, 2025-2035
  • Figure 60: South Asia and Pacific Market Attractiveness Analysis by Application
  • Figure 61: Middle East & Africa Market Value Share and BPS Analysis by Country, 2025 and 2035
  • Figure 62: Middle East & Africa Market Value Share and BPS Analysis by Module Type , 2025 and 2035
  • Figure 63: Middle East & Africa Market Y to o to Y Growth Comparison by Module Type , 2025-2035
  • Figure 64: Middle East & Africa Market Attractiveness Analysis by Module Type
  • Figure 65: Middle East & Africa Market Value Share and BPS Analysis by Application, 2025 and 2035
  • Figure 66: Middle East & Africa Market Y to o to Y Growth Comparison by Application, 2025-2035
  • Figure 67: Middle East & Africa Market Attractiveness Analysis by Application
  • Figure 68: Global Market - Tier Structure Analysis
  • Figure 69: Global Market - Company Share Analysis
Dashboard
Dashboard
Dashboard
Dashboard
Dashboard
Dashboard

Full Research Suite comprises of:

Market outlook & trends analysis

Market outlook & trends analysis

Interviews & case studies

Interviews & case studies

Strategic recommendations

Strategic recommendations

Vendor profiles & capabilities analysis

Vendor profiles & capabilities analysis

5-year forecasts

5-year forecasts

8 regions and 60+ country-level data splits

8 regions and 60+ country-level data splits

Market segment data splits

Market segment data splits

12 months of continuous data updates

12 months of continuous data updates

DELIVERED AS:

PDF EXCEL ONLINE

Full Research Suite


$5000

$7500

$10000

Buy Report Now
Similar Industry Reports

Similar Industry Reports

Sponge and Scouring Pad Market

Sponge and Scouring Pad Market Growth – Size, Demand & Forecast 2024-2034

Sponge Applicator Market

Sponge Applicator Market

Drain Sponges Market

Drain Sponges Market

Nonwoven Sponges Market

Nonwoven Sponges Market Size and Share Forecast Outlook 2025 to 2035

Laparotomy Sponge Market

Laparotomy Sponge Market Analysis – Size, Share & Forecast 2024-2034

Silicone Makeup Sponge Market

Silicone Makeup Sponge Market Size and Share Forecast Outlook 2025 to 2035

Intercity Bus Travel Market

Intercity Bus Travel Market Size and Share Forecast Outlook 2025 to 2035

Smart City Platforms Market

Smart City Platforms Market Size and Share Forecast Outlook 2025 to 2035

Spasticity Treatment Market

Spasticity Treatment Market Size and Share Forecast Outlook 2025 to 2035

Smart City Kiosk Deployment Market

Smart City Kiosk Deployment Market – Digital Urbanization 2034

Electricity Transmission Infrastructure Market

Electricity Transmission Infrastructure Market Size and Share Forecast Outlook 2025 to 2035

Cytotoxicity Assays Market

Cytotoxicity Assays Market Size and Share Forecast Outlook 2025 to 2035

Small Capacity Electrolyzer Market

Small Capacity Electrolyzer Market Size and Share Forecast Outlook 2025 to 2035

Large Capacity Stationary Fuel Cell Market

Large Capacity Stationary Fuel Cell Market Size and Share Forecast Outlook 2025 to 2035

Food Authenticity Testing Services Market

Food Authenticity Testing Services Market Analysis - Size, Share, and Forecast Outlook 2025 to 2035

Hospital Capacity Management Solutions Market

Hospital Capacity Management Solutions Market Insights - Growth & Forecast 2024 to 2034

PEM Small Capacity Electrolyzer Market

PEM Small Capacity Electrolyzer Market Size and Share Forecast Outlook 2025 to 2035

Radiation Toxicity Treatment Market

Radiation Toxicity Treatment Market Size and Share Forecast Outlook 2025 to 2035

Histamine Toxicity Market

Histamine Toxicity Market

Antibody Specificity Testing Market

Antibody Specificity Testing Market Size and Share Forecast Outlook 2025 to 2035

Future Market Insights

Sponge City Rainwater Management Systems Market

Chat With MaRIA

Chat With

MaRIA

Hi There, I am MaRIA, Your Market Research Intelligence Assistant. How may I help you?