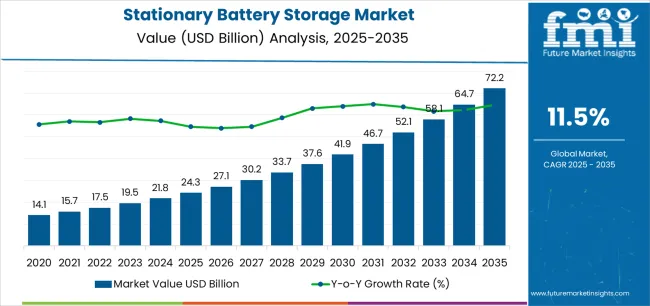
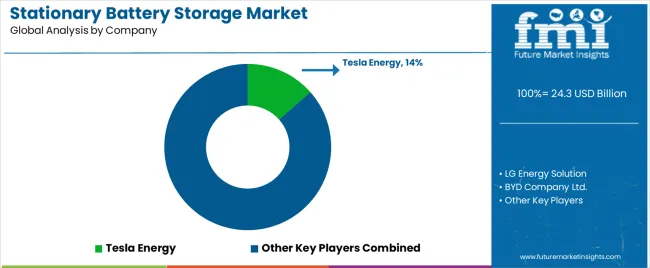
The stationary battery storage market, valued at USD 24.3 billion in 2025, is projected to reach USD 72.2 billion by 2035, expanding at a CAGR of 11.5%. The first half of the decade, from 2025 to 2030, is expected to witness accelerated adoption driven by increasing integration of renewable energy sources and the growing need for grid stability. Governments and utilities are likely to invest heavily in large-scale storage projects to balance intermittent energy generation and ensure consistent power supply. Cost reductions in lithium-ion and emerging battery chemistries will further support deployment across residential, commercial, and industrial segments.
During the latter half of the forecast period, from 2030 to 2035, growth will shift toward scalability, innovation, and diversification of storage technologies. Advancements in solid-state and flow batteries are expected to enhance storage capacity, safety, and lifecycle efficiency, broadening the application base. Energy trading, microgrid development, and decentralized storage networks will become key contributors to market expansion.
The early growth will focus on adoption and infrastructure building, while late growth will be defined by technological maturity and large-scale integration into smart grids. Overall, the market’s 10-year growth trajectory reflects an evolving transition from deployment-driven expansion to technology-led value creation, shaping the global energy storage ecosystem.
| Period | Primary Revenue Buckets | Share | Notes |
|---|---|---|---|
| Today | Grid-scale battery systems (new installations) | 48% | Utility tenders, renewable integration |
| Behind-the-meter commercial systems | 22% | Peak shaving, demand charge reduction | |
| Energy management software & controls | 12% | Grid services, optimization platforms | |
| System integration & installation | 10% | EPC services, commissioning support | |
| Maintenance & service contracts | 8% | Performance guarantees, monitoring | |
| Future (3-5 yrs) | Utility-scale storage parks (>20 MWh) | 38-42% | Gigawatt-hour projects, renewable zones |
| Grid services & virtual power plants | 18-22% | Frequency regulation, capacity markets | |
| C&I behind-the-meter solutions | 15-18% | Energy arbitrage, resilience applications | |
| Digital optimization & AI dispatch | 10-14% | Predictive analytics, automated trading | |
| Residential & community storage | 8-10% | Prosumer systems, microgrid integration | |
| System upgrades & battery replacement | 5-8% | Lifecycle management, capacity expansion | |
| Ancillary hardware (inverters/cooling) | 4-6% | Power electronics, thermal management |
| Metric | Value |
|---|---|
| Market Value (2025) | USD 24.3 billion |
| Market Forecast (2035) | USD 72.2 billion |
| Growth Rate | 11.5% CAGR |
| Leading Battery Technology | Lithium-ion |
| Primary Application | Grid Services Segment |
The market demonstrates strong fundamentals with lithium-ion battery systems capturing dominant share through advanced energy density capabilities and utility-scale deployment optimization. Grid services applications drive primary demand, supported by increasing renewable energy integration requirements and frequency regulation needs. Geographic expansion remains concentrated in developed markets with established renewable infrastructure, while emerging economies show accelerating adoption rates driven by grid modernization initiatives and rising energy security standards.
Design for grid services, not just energy storage
Primary Classification: The market segments by battery type into lithium-ion (including LFP and NMC chemistries), lead-acid, sodium-sulfur, flow batteries, and other emerging chemistries, representing the evolution from traditional storage systems to sophisticated energy management solutions for comprehensive grid optimization.
Secondary Classification: Application segmentation divides the market into grid services (including energy shifting and capacity deferral, frequency regulation and flexible ramping, transmission and distribution congestion relief and capacity firming, and renewable curtailment reduction), behind-the-meter, and off-grid/remote systems, reflecting distinct requirements for operational flexibility, grid stability, and energy independence standards.
Tertiary Classification: Energy capacity segmentation covers systems up to 250 kWh, 251 kWh to 1 MWh, 1.1 MWh to 10 MWh, and systems above 10 MWh to 20 MWh, representing varying deployment scales from residential to utility applications.
Regional Classification: Geographic distribution covers North America, Latin America, Western Europe, Eastern Europe, East Asia, South Asia Pacific, and Middle East & Africa, with developed markets leading deployment while emerging economies show accelerating growth patterns driven by renewable energy expansion programs.
The segmentation structure reveals technology progression from basic energy storage toward sophisticated grid-interactive systems with enhanced flexibility and revenue optimization capabilities, while application diversity spans from utility-scale parks to commercial installations requiring comprehensive energy management solutions.
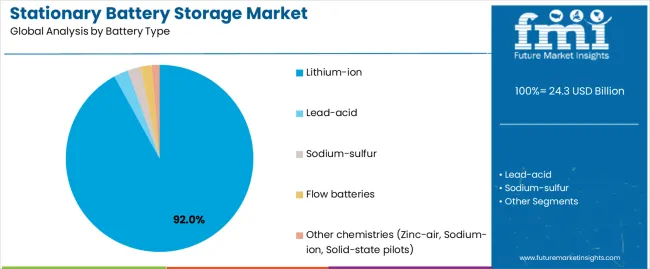
Market Position: Lithium-ion batteries command the leading position in the stationary battery storage market with 92.0% market share through advanced energy storage features, including superior energy density, operational efficiency, and grid integration optimization that enable utilities and commercial operators to achieve reliable power management across diverse grid services and behind-the-meter environments.
Value Drivers: The segment benefits from utility and commercial preference for proven battery systems that provide consistent charge-discharge performance, declining cost trajectories, and operational reliability without requiring significant infrastructure modifications. Advanced chemistry features enable scalable deployment configurations, rapid response capabilities, and integration with renewable energy systems, where performance consistency and economic viability represent critical investment requirements.
Competitive Advantages: Lithium-ion battery systems differentiate through proven grid-scale reliability, declining cost structures, and compatibility with comprehensive energy management systems that enhance operational effectiveness while maintaining optimal safety standards suitable for diverse utility and commercial applications.
Key market characteristics:
Within lithium-ion batteries, LFP (LiFePO₄) chemistry maintains the dominant subsegment position with 59.0% of lithium-ion share due to its superior safety characteristics and long cycle life performance. These systems appeal to utilities requiring reliable long-duration storage with thermal stability for grid-scale applications. Market strength is driven by utility-scale deployment and cost optimization, emphasizing safe battery solutions and operational longevity through proven chemistry configurations.
NMC chemistry captures 33.0% of lithium-ion share through high energy density requirements in space-constrained installations and applications requiring maximum energy storage in compact footprints. The remaining 8.0% of lithium-ion comprises other lithium chemistries for specialized applications.
Lead-acid batteries capture 3.5% of total market share through legacy installations and cost-sensitive applications. Sodium-sulfur systems hold 2.0% of total market share, flow batteries account for 1.8%, while other chemistries including zinc-air, sodium-ion, and solid-state pilots represent 0.7% through emerging technology applications and specialized requirements.
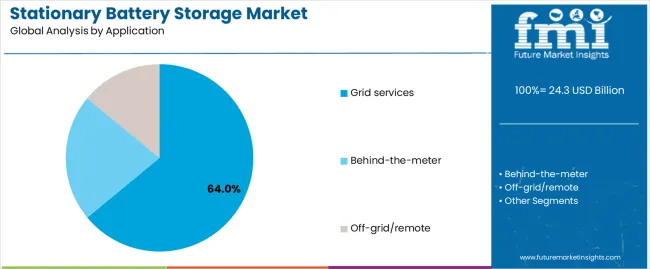
Market Context: Grid services demonstrate the dominant market position in the stationary battery storage market with 64.0% market share due to widespread adoption of utility-scale storage systems and increasing focus on renewable integration, frequency stability, and grid flexibility applications that maximize operational reliability while maintaining power quality standards.
Appeal Factors: Grid services users prioritize operational flexibility, revenue optimization capabilities, and integration with wholesale energy markets that enable coordinated grid management across multiple value streams. The segment benefits from substantial utility investment and regulatory support programs that emphasize the deployment of battery systems for grid stabilization and renewable energy integration applications.
Growth Drivers: Renewable energy expansion programs incorporate battery storage as essential infrastructure for intermittency management, while grid modernization increases demand for flexible capacity resources that comply with reliability standards and minimize curtailment losses.
Market Challenges: Regulatory uncertainty and evolving market designs may limit revenue predictability across different jurisdictions or market structures.
Application dynamics include:
Within grid services applications, energy shifting and capacity deferral maintain the leading position with 26.0% of total market share through peak load management and transmission upgrade deferral. Frequency regulation and flexible ramping capture 18.0% of total market share, transmission and distribution congestion relief and capacity firming hold 12.0%, while renewable curtailment reduction, black-start, and diesel displacement represent 8.0% through specialized grid applications.
Behind-the-meter systems capture 28.0% market share through commercial and industrial peak shaving, demand charge reduction, and resilience applications requiring on-site energy management and backup power capabilities.
Off-grid and remote systems account for 8.0% market share through isolated community power, mining operations, and telecommunications infrastructure requiring autonomous energy supply and diesel displacement in areas without grid access.
Market Position: The 1.1-10 MWh capacity segment commands dominant market position with 44.0% market share through optimal sizing for utility substations and large commercial installations.
Value Drivers: This capacity range provides the ideal balance between project economics and grid impact, meeting requirements for substation-scale storage, commercial aggregation, and microgrid applications without excessive complexity or interconnection challenges.
Growth Characteristics: The segment benefits from standardized containerized solutions, proven deployment models, and established financing structures that support widespread adoption and project replication across diverse utility territories.
The 251 kWh-1 MWh capacity segment captures 28.0% market share through commercial and industrial behind-the-meter applications and small utility projects. Systems above 10-20 MWh hold 18.0% market share, while systems up to 250 kWh account for 10.0% through residential and small commercial installations.
| Category | Factor | Impact | Why It Matters |
|---|---|---|---|
| Driver | Renewable energy integration requirements (solar & wind intermittency, curtailment reduction, capacity firming) | ★★★★★ | Intermittent renewables require energy storage for grid stability; utility-scale solar and wind projects increasingly mandating co-located or contracted storage capacity. |
| Driver | Grid modernization & reliability mandates (frequency regulation, transmission deferral, resilience) | ★★★★★ | Aging grid infrastructure needing flexible resources; battery storage providing cost-effective alternative to transmission upgrades and peaker plant construction. |
| Driver | Policy support & incentives (IRA tax credits, state mandates, renewable targets with storage requirements) | ★★★★☆ | Government policies accelerating deployment economics; storage mandates and investment tax credits improving project viability and reducing payback periods. |
| Restraint | High upfront capital costs (battery systems, power electronics, installation, grid interconnection) | ★★★★☆ | Capital intensity limiting adoption in emerging markets; financing challenges for smaller utilities and commercial projects despite declining battery costs. |
| Restraint | Regulatory & market design uncertainty (compensation mechanisms, interconnection rules, safety standards) | ★★★☆☆ | Evolving market structures creating revenue uncertainty; inconsistent regulations across jurisdictions complicating project development and financing. |
| Trend | Utility-scale gigawatt-hour projects (multi-hundred MWh facilities, renewable energy zones, grid-scale parks) | ★★★★★ | Project scale increasing dramatically; utilities deploying GWh-class battery parks for wholesale market participation and renewable integration at unprecedented scale. |
| Trend | Virtual power plants & aggregated resources (distributed storage coordination, demand response integration, cloud platforms) | ★★★★☆ | Distributed battery systems aggregated for grid services; software platforms enabling coordination of thousands of behind-the-meter systems for utility-scale grid impact. |
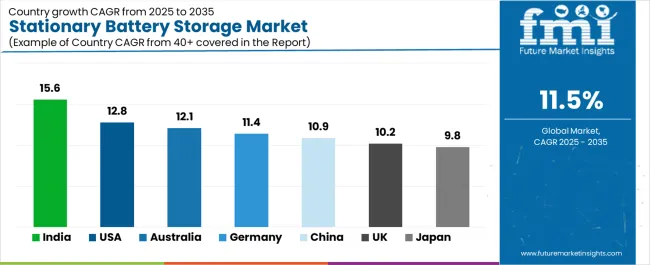
The stationary battery storage market demonstrates varied regional dynamics with Growth Leaders including India (15.6% growth rate) and United States (12.8% growth rate) driving expansion through renewable integration initiatives and policy support programs. Steady Performers encompass Australia (12.1% growth rate), Germany (11.4% growth rate), and China (10.9% growth rate), benefiting from established renewable infrastructure and advanced storage adoption. Developed Markets feature United Kingdom (10.2% growth rate) and Japan (9.8% growth rate), where grid modernization and resilience applications support consistent growth patterns.
Regional synthesis reveals South Asian markets leading adoption through utility tender programs and distribution network optimization, while North American and European countries maintain strong deployment supported by policy frameworks and renewable energy mandates. Asia-Pacific markets show robust growth driven by curtailment reduction targets and grid congestion relief requirements.
| Region/Country | 2025-2035 Growth | How to win | What to watch out |
|---|---|---|---|
| India | 15.6% | Focus on solar+storage tenders | Payment delays; grid integration challenges |
| United States | 12.8% | Lead with IRA tax credit optimization | Interconnection queues; supply chain constraints |
| Australia | 12.1% | Offer VPP-ready systems | Network charges; market rule changes |
| Germany | 11.4% | Push residential prosumer solutions | Grid fee structures; battery tax treatment |
| China | 10.9% | Scale manufacturing advantage | Provincial policy variations; payment terms |
| United Kingdom | 10.2% | Dynamic frequency response focus | Planning permission delays; grid connection costs |
| Japan | 9.8% | Resilience & disaster backup | Conservative procurement; high installation costs |
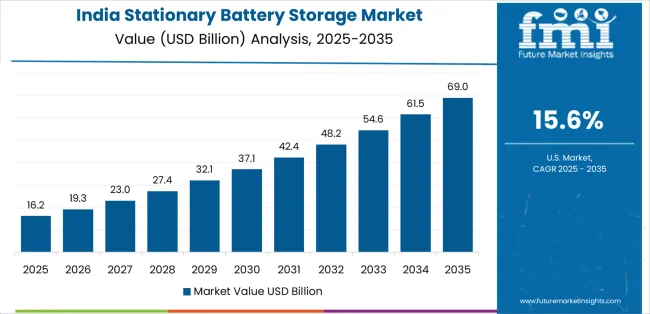
India establishes fastest market growth through aggressive renewable energy programs and comprehensive grid modernization development, integrating advanced battery storage systems as standard components in solar power projects and distribution network installations. The country's 15.6% growth rate reflects government initiatives promoting energy independence and grid reliability that mandate the use of storage systems in renewable energy and distribution facilities. Growth concentrates in major renewable energy zones, including Rajasthan solar parks, Gujarat renewable clusters, and Karnataka wind-solar hybrid projects, where energy infrastructure development showcases integrated storage deployment that appeals to utilities seeking renewable integration capabilities and grid stability applications.
Indian utilities are procuring cost-effective storage solutions through competitive tender programs that combine domestic manufacturing preferences with international technology partnerships, including utility-scale battery parks and distributed storage systems. Deployment channels through state electricity boards and renewable energy developers expand market access, while government MNRE programs and state-level storage mandates support adoption across diverse utility and commercial segments.
Strategic Market Indicators:
United States establishes market leadership through comprehensive federal incentives and state-level storage mandates, integrating battery storage systems across utility-scale and commercial applications. The country's 12.8% growth rate reflects Inflation Reduction Act support and mature renewable energy adoption that supports widespread deployment of grid-scale battery systems in renewable energy zones and urban load centers. Procurement concentrates in leading storage markets, including California independent system, Texas ERCOT territory, and East Coast ISO regions, where policy frameworks showcase large-scale deployment that appeals to utilities seeking capacity resources and renewable integration capabilities.
American utilities and developers leverage established project finance mechanisms and comprehensive interconnection experience, including standalone storage projects and renewable co-location that create investment opportunities and grid value. The market benefits from mature wholesale electricity markets and capacity compensation mechanisms that enable battery storage revenue optimization while supporting technology advancement and cost reduction.
Market Intelligence Brief:
In New South Wales renewable energy zones, South Australia grid network, and Victoria transmission corridors, utility operators are implementing advanced battery storage systems as essential infrastructure for grid stability and renewable integration applications, driven by high renewable penetration and weak grid infrastructure that emphasize the importance of flexible capacity resources. The market holds a 12.1% growth rate, supported by aggressive renewable energy targets and utility-scale battery programs that promote large storage systems for frequency control and network support facilities. Australian operators are deploying battery systems that provide fast frequency response and network stability features, particularly appealing in regions with high renewable penetration where grid strength and reliability represent critical operational requirements.
Market expansion benefits from high retail electricity prices creating attractive behind-the-meter economics and utility virtual power plant programs that aggregate distributed storage resources. Technology adoption follows patterns established in renewable energy, where project economics and grid services value drive investment decisions and large-scale deployment.
Market Intelligence Brief:
Germany's advanced energy transition demonstrates sophisticated battery storage deployment with documented operational effectiveness in residential solar integration and grid services through established prosumer market and ancillary services participation. The country leverages renewable energy leadership and distributed generation to maintain an 11.4% growth rate. Solar installation centers, including Bavaria rooftop systems, Baden-Württemberg residential deployment, and commercial installations nationwide, showcase integrated storage systems where batteries combine with photovoltaic generation and comprehensive energy management to optimize self-consumption and grid interaction.
German prosumers and commercial operators prioritize energy independence and self-consumption in storage system deployment, creating demand for residential and commercial-scale systems with advanced features, including grid service capability and virtual power plant participation. The market benefits from established solar photovoltaic infrastructure and favorable regulatory frameworks supporting battery storage integration and feed-in management.
Market Intelligence Brief:
In Inner Mongolia renewable bases, Qinghai solar zones, and coastal industrial regions, grid operators and renewable developers are implementing advanced battery storage systems as mandated infrastructure for curtailment reduction and grid integration applications, driven by provincial storage ratio requirements and renewable energy capacity expansion that emphasize the importance of energy storage. The market holds a 10.9% growth rate, supported by government curtailment reduction targets and provincial policies requiring storage deployment with new renewable projects. Chinese operators are deploying battery systems that provide renewable integration and grid stability capabilities, particularly in regions with high renewable generation where curtailment prevention and grid connection represent critical operational requirements.
Market expansion benefits from massive domestic battery manufacturing capacity and vertically integrated supply chains that enable cost-competitive storage solutions. Technology adoption follows patterns established in renewable energy, where policy mandates and manufacturing scale drive deployment decisions and provincial-scale implementation.
Market Intelligence Brief:
United Kingdom's electricity market demonstrates sophisticated battery storage deployment with documented operational effectiveness in frequency response and renewable integration through established ancillary services markets and offshore wind support. The country maintains a 10.2% growth rate, driven by dynamic frequency response markets and accelerating offshore wind deployment.
Market dynamics focus on grid-scale battery systems optimized for fast frequency response and capacity market participation. Regulatory innovation and renewable energy growth create consistent opportunities for utility-scale storage supporting grid stability and offshore wind integration.
Strategic Market Considerations:
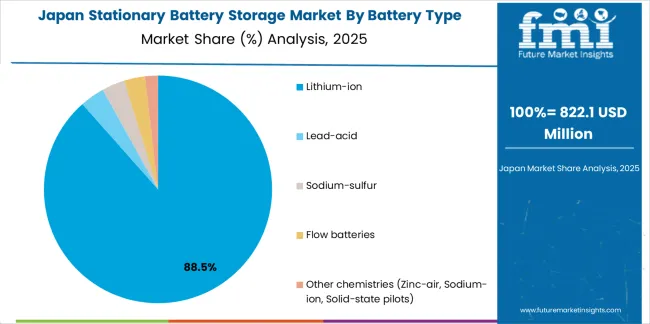
Japan's disaster preparedness focus demonstrates battery storage deployment with emphasis on resilience and grid congestion relief through established quality standards and distributed energy integration. The country maintains a 9.8% growth rate, driven by grid reliability requirements and renewable energy integration.
Market dynamics focus on commercial and industrial resilience applications combined with grid congestion relief in urban networks. Natural disaster experience and grid limitations create sustained demand for distributed storage supporting facility backup and transmission support.
Strategic Market Considerations:
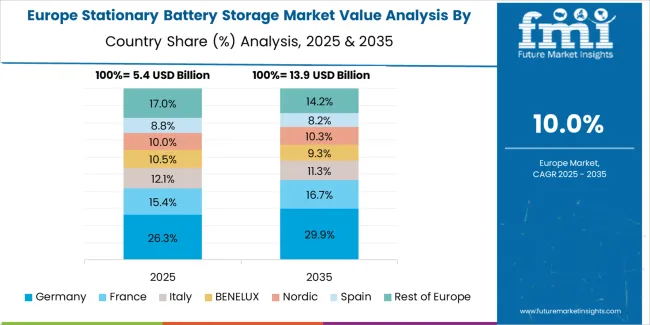
The stationary battery storage market in Europe is projected to grow from USD 7.1 billion in 2025 to USD 20.5 billion by 2035, registering a CAGR of 11.2% over the forecast period. Germany is expected to retain leadership with a 24.0% market share in 2025, moderating to 22.5% by 2035 as more markets scale, supported by strong prosumer storage and ancillary services participation.
France follows with a 16.5% share in 2025, edging up to 17.0% by 2035 on nuclear-flex integration and new solar+storage deployment. United Kingdom holds a 17.0% share in 2025, easing to 16.0% by 2035 amid planning streamlining and offshore wind balancing needs. Italy accounts for a 13.0% share in 2025, rising to 13.5% by 2035 with rapid residential and commercial and industrial adoption tied to photovoltaic generation. Spain represents a 9.5% share in 2025, reaching 10.0% by 2035 on large renewable hubs requiring storage integration. Rest of Europe collectively grows from 20.0% to 21.0% by 2035, driven by Nordic flexibility markets and Central/Eastern European grid modernization programs.
| Stakeholder | What they actually control | Typical strengths | Typical blind spots |
|---|---|---|---|
| Integrated battery manufacturers | Cell production, system design, global supply chain | Vertical integration, cost position, technology roadmap | Project development; local grid services expertise |
| System integrators | EPC capability, grid interconnection, project finance relationships | Deployment speed, utility relationships, balance-of-system optimization | Battery technology; cell supply security |
| Software & controls platforms | Energy management systems, grid services optimization, VPP aggregation | Revenue optimization, market intelligence, fleet management | Hardware manufacturing; installation networks |
| Utility-backed developers | Grid access, offtake agreements, transmission rights | Interconnection priority, market knowledge, rate base treatment | Technology innovation; cost competitiveness |
| Pure-play storage developers | Project pipeline, site control, permit expertise | Focus and agility, financial engineering, merchant market exposure | Manufacturing scale; technology lock-in risk |
| Item | Value |
|---|---|
| Quantitative Units | USD 24.3 billion |
| Battery Type | Lithium-ion (LFP, NMC), Lead-acid, Sodium-sulfur, Flow batteries, Other chemistries (Zinc-air, Sodium-ion, Solid-state pilots) |
| Application | Grid services (Energy shifting & capacity deferral, Frequency regulation & flexible ramping, T&D congestion relief & capacity firming, Renewable curtailment reduction/black-start/diesel displacement), Behind-the-meter, Off-grid/remote |
| Energy Capacity (System Size) | Up to 250 kWh, 251 kWh-1 MWh, 1.1-10 MWh, Above 10-20 MWh |
| Regions Covered | North America, Latin America, Western Europe, Eastern Europe, East Asia, South Asia Pacific, Middle East & Africa |
| Countries Covered | United States, China, Germany, India, United Kingdom, Japan, Australia, Canada, Brazil, France, South Korea, and 25+ additional countries |
| Key Companies Profiled | Tesla Energy, LG Energy Solution, BYD Company Ltd., CATL, Panasonic, Samsung SDI, Fluence (Siemens-AES), Saft (TotalEnergies), Sungrow Power Supply, Hitachi Energy |
| Additional Attributes | Dollar sales by battery type and application categories, regional deployment trends across South Asia Pacific, North America, and Western Europe, competitive landscape with battery manufacturers and system integrators, utility operator preferences for grid flexibility and renewable integration, integration with energy management platforms and grid control systems, innovations in battery technology and system efficiency, and development of utility-scale storage solutions with enhanced performance and economic optimization capabilities. |
The global stationary battery storage market is estimated to be valued at USD 24.3 billion in 2025.
The market size for the stationary battery storage market is projected to reach USD 72.2 billion by 2035.
The stationary battery storage market is expected to grow at a 11.5% CAGR between 2025 and 2035.
The key product types in stationary battery storage market are lithium-ion , lead-acid, sodium-sulfur, flow batteries and other chemistries (zinc-air, sodium-ion, solid-state pilots).
In terms of application, grid services segment to command 64.0% share in the stationary battery storage market in 2025.


Full Research Suite comprises of:
Market outlook & trends analysis
Interviews & case studies
Strategic recommendations
Vendor profiles & capabilities analysis
5-year forecasts
8 regions and 60+ country-level data splits
Market segment data splits
12 months of continuous data updates
DELIVERED AS:
PDF EXCEL ONLINE
Stationary Flow Battery Storage Market Size and Share Forecast Outlook 2025 to 2035
Stationary Lead Acid Battery Storage Market Size and Share Forecast Outlook 2025 to 2035
Stationary Lithium-Ion Battery Storage Market Size and Share Forecast Outlook 2025 to 2035
UK Stationary Battery Storage Industrial Market Growth - Trends & Forecast 2025 to 2035
Grid Scale Stationary Battery Storage Market Size and Share Forecast Outlook 2025 to 2035
Lithium ion Stationary Battery Storage Market Size and Share Forecast Outlook 2025 to 2035
Behind the Meter Stationary Battery Storage Market Size and Share Forecast Outlook 2025 to 2035
Stationary Band Saws Market Size and Share Forecast Outlook 2025 to 2035
Stationary Hydrogen Energy Storage Market Size and Share Forecast Outlook 2025 to 2035
Stationary VRLA Battery Market Size and Share Forecast Outlook 2025 to 2035
Geostationary Orbit Satellite IoT Market Size and Share Forecast Outlook 2025 to 2035
Fuel Cell for Stationary Power Market Growth - Trends & Forecast 2025 to 2035
Large Capacity Stationary Fuel Cell Market Size and Share Forecast Outlook 2025 to 2035
Battery Operated Light Market Forecast and Outlook 2025 to 2035
Battery Voltage Recorder Market Size and Share Forecast Outlook 2025 to 2035
Battery Resistance Tester Market Size and Share Forecast Outlook 2025 to 2035
Battery Technology Market Size and Share Forecast Outlook 2025 to 2035
Battery Electric Vehicle (BEV) Market Size and Share Forecast Outlook 2025 to 2035
Battery Separator Paper Market Size and Share Forecast Outlook 2025 to 2035
Battery Cyclers Market Size and Share Forecast Outlook 2025 to 2035

Thank you!
You will receive an email from our Business Development Manager. Please be sure to check your SPAM/JUNK folder too.
Chat With
MaRIA