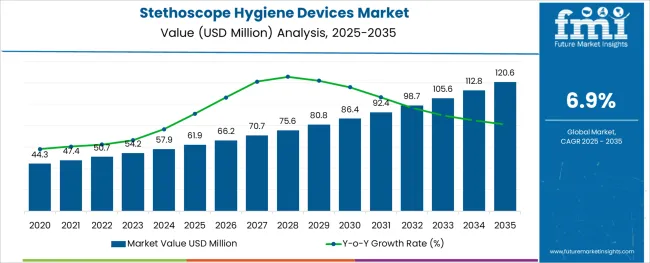
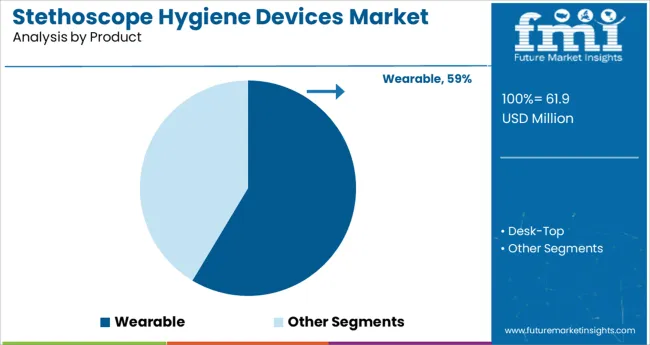
By the end of 2022, the global stethoscope hygiene devices market is anticipated to be worth USD 47.4 Million, and it will grow at a CAGR of 6.9% to reach USD 91.4 Million in the year 2032. Desktop stethoscope hygiene devices have the largest market share in 2021, by product, according to a recent analysis by Future Market Insights, with a market share of roughly 86.6%.
Market Outlook:
Data Points | Market Insights |
---|---|
Market Value 2022 | USD 47.4 Million |
Market Value 2032 | USD 91.4 Million |
CAGR 2022 to 2032 | 6.9% |
Market Share of Top 6 Countries | 47.0% |
Key Market Players | LightProgress/egoHealth; Xech; Your First Services Inc.; Vioguard; Edmund Optics; Parsons; UV Smart; and Tangshan UMG Medical Instrument Co.; Ltd. |
Stethoscope hygiene devices are used to disinfect the diaphragm part of the stethoscope, which is circular in shape. This part of the stethoscope is exposed to the patient very frequently and hence is prone to higher chances of contamination. Compared to other medical devices, stethoscopes come into closer and more frequent touch with patients. They are a risk to the population since they contribute significantly to the spread of illnesses among patients who are not just hospitalized, but also among those who attend OPDs.
The market value for the stethoscope hygiene devices market was approximately 1.9% of the overall ~USD 2.3 Billion of the global medical device cleaning market in 2021.
The sales of stethoscope hygiene devices expanded at a CAGR of 5.3% from 2017 to 2021, owing to the advent of the COVID-19 global pandemic.
The Current Infectious Disease Reports, 2018 explored the role of environmental contamination in healthcare-associated infections (HAIs). Blood pressure cuffs, electronic thermometers, hemodialysis machines, stethoscopes, infusion pumps, and other medical devices can serve as potential reservoirs for nosocomial infections that can spread from healthcare workers' hands to patients if correct hand-washing practices are not followed.
HAIs have been linked to cross-transmission through the hands of healthcare workers who are infected either directly from patient contact or indirectly by touching contaminated ambient surfaces.
There is evidence that pathogens can move from the skin to the stethoscope and vice versa, making medical stethoscopes a possible source of contamination for a number of disorders. Despite the predominance of non-pathogenic organisms, potential pathogens like C. difficile, Pseudomonas, MRSA, and VRE have also been found.
A 2022 study conducted by Mayo Clinic at a Swiss university teaching hospital tested the bacterial load of stethoscopes and discovered that they were capable of transferring potentially dangerous pathogens, such as methicillin-resistant Staphylococcus aureus (MRSA). Modern antibiotics are unable to penetrate the bacterium's defenses, which have evolved through time.
Out of the sample population, the researchers discovered that stethoscope contamination increased significantly following just one patient's physical examination. They discovered that the degree of contamination was comparable to that of the doctor's dominant hand.
As a result of the aforementioned factors, the global stethoscope hygiene devices market is anticipated to expand at a CAGR of 6.9% from 2022 to 2032.
Due to the advancement of disinfection devices, the market is expected to display an opportunity-seeking stance. The introduction of products designed to provide several benefits from a single device would further accelerate the expansion.
For example, a product by the name of StetClean (LightProcess s.r.l) offers 4 in 1 solution for the disinfection of stethoscopes. This product prevents the rise in microbiological activity caused by the contamination of the stethoscope.
It facilitates the adoption of healthy hygienic habits and practices by physically disinfecting through the action of UV rays, without the use of any chemicals. This product is environmentally friendly because it doesn't utilize any toxic chemicals or generate any toxic waste.
During the foreseeable years, this is expected to provide lucrative opportunities for growth in the overall stethoscope hygiene devices market.
In spite of a significant rise in the performance of adequate stethoscope hygiene throughout the COVID-19 pandemic - from 27.2% to 55.4% - nearly 50% of healthcare personnel still did not do so, according to a 2022 study published in the Journal of Hospital Infection dated September 2022.
Although stethoscope hygiene performance has remained below average, researchers have noticed an increase in stethoscope hygiene attitudes. This indicates that while stethoscope hygiene is thought to be crucial, few practitioners actually use it.
Given that physicians believed there had been no change during COVID-19, focusing on stethoscope hygiene may have some merit. It may be acceptable to target resident physicians, who were less likely than other medical professionals in their early careers to have maintained proper stethoscope hygiene during the pandemic, for the assessment of the material integrity of stethoscope hygiene devices.
Owed to these crucial factors, the market stethoscope hygiene devices market observes a decline in terms of product adoption and sales.
The USA dominates the North American region with a total market share of about 75.3% in 2021 generating a revenue of close to USD 9.5 million and is expected to continue to experience the same growth throughout the forecast period.
According to the US Centers for Disease Control and Prevention, more than 98,000 hospitalized patients (one in 17) yearly develop HCAIs while receiving treatment for other medical conditions. Healthcare personnel can improve their hygiene habits to stop the spread of illness through routine educational initiatives. This is a prime driver for the design and production of stethoscope hygiene devices within the country.
Italy holds a market share of nearly 5.3% in the global stethoscope hygiene devices market during the forecast period.
The makers of the first UV Stethoscope-specific disinfection device, LightProcess s.r.l, and egoHealth have their headquarters set up in the country providing the market there a good boost. The fact that one of the pioneers of this invention which uses UV light to maintain stethoscope hygiene will itself provide the market here a significant boost. Due to such developments, the market is being boosted towards growth.
China dominates the East Asian stethoscope hygiene devices market region with a total market share of about 58.7% in 2021 and is expected to continue to experience the same growth throughout the forecast period.
A 2021 BMC article explored the trend of medical graduates in China. Undergraduate medicine enrolment expanded from 30,500 to 94,600, with an average annual growth rate of 7.3 %, between 2002 and 2018, while the number of higher clinical medicine graduates surged drastically from 51,800 in 2002 to 182,900 in 2018. This will lead to a rise in the use of stethoscopes, which will further lead to good adoption of hygiene devices to maintain hygienic practices in order to avoid nosocomial infections.
Desktop stethoscope hygiene device is expected to present high growth at a CAGR of 6.7% by the end of the forecast period, with a market share of about 86.6% in the global stethoscope hygiene devices market in 2021. Desktop devices can easily sit atop any table as well as can be kept and carried anywhere, as they are light in weight. In addition, most of the products available in the market are available in desktop form, hence the lucrative figures.
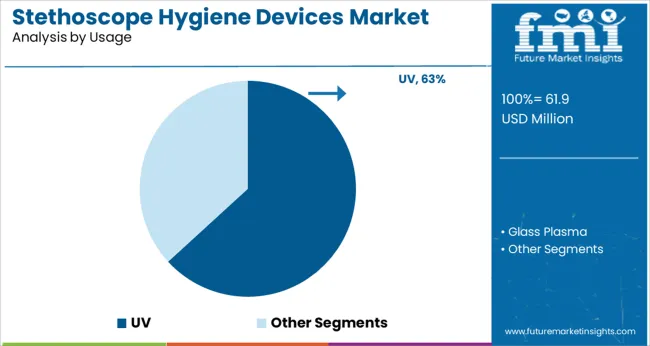
The UV technology holds a revenue share of around 80.3% in 2021 and the segment is expected to display gradual growth over the forecast period, with an estimated CAGR of 6.9% in 2032. Ultraviolet technology or UV technology is the most commonly used technology when it comes to disinfection. Hence, most of the manufacturers of stethoscope disinfection are integrating this technology into their products to create a useful disinfection device.
Hospitals hold the highest market share value of 30.6% during the year 2021. The presence of a large number and variety of healthcare professionals has driven this segment to be a dominant fragment, propelling sales of the overall stethoscope hygiene devices market. These individuals range from medical students to doctors of all specializations.
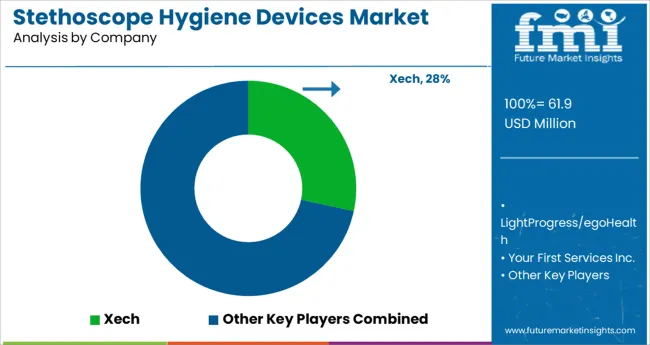
The production of stethoscope hygiene equipment is dominated by a few producers, which has led to market concentration. These businesses are employing strategies including alliances and collaborations, new product launches, and partnerships in order to satisfy consumer demand and increase their client base.
Instances of key developmental strategies by the industry players in the stethoscope hygiene devices market are given below:
Similarly, recent developments related to companies manufacturing stethoscope hygiene devices, have been tracked by the team at Future Market Insights, which are available in the full report.
Attribute | Details |
---|---|
Forecast Period | 2022 to 2032 |
Historical Data Available for | 2017 to 2021 |
Market Analysis | USD Million for Value |
Key Regions Covered | North America; Latin America; Europe; South Asia; East Asia; Oceania; and Middle East & Africa |
Key Countries Covered | USA, Canada, Brazil, Mexico, Argentina, UK, Germany, Italy, Russia, Spain, France, BENELUX, India, Thailand, Indonesia, Malaysia, Japan, China, South Korea, Australia, New Zealand, Turkey, GCC Countries, North Africa, and South Africa |
Key Market Segments Covered | Product, Technology, End User, and Region |
Key Companies Profiled | LightProgress/eHealth; Xech; Your First Services Inc.; Vioguard; Edmund Optics; Parsons; UV Smart; Tangshan UMG Medical Instrument Co., Ltd. |
Pricing | Available upon Request |
Table 01: Global Market Value (US$ Million) Analysis and Forecast 2017 to 2032, by Product
Table 02: Global Market Volume (Units) Analysis and Forecast 2017 to 2032, by Product
Table 03: Global Market Value (US$ Million) Analysis and Forecast 2017 to 2032, by Technology
Table 04: Global Market Value (US$ Million) Analysis and Forecast 2017 to 2032, by End User
Table 05: Global Market Value (US$ Million) Analysis and Forecast 2017 to 2032, by Region
Table 06: North America Market Value (US$ Million) Analysis 2017 to 2021 and Forecast 2022 to 2032, by Country
Table 07: North America Market Value (US$ Million) Analysis and Forecast 2017 to 2032, by Product
Table 08: North America Market Volume (Units) Analysis and Forecast 2017 to 2032, by Product
Table 09: North America Market Value (US$ Million) Analysis and Forecast 2017 to 2032, by Technology
Table 10: North America Market Value (US$ Million) Analysis and Forecast 2017 to 2032, by End User
Table 11: Latin America Market Value (US$ Million) Analysis 2017 to 2021 and Forecast 2022 to 2032, by Country
Table 12: Latin America Market Value (US$ Million) Analysis and Forecast 2017 to 2032, by Product
Table 13: Latin America Market Volume (Units) Analysis and Forecast 2017 to 2032, by Product
Table 14: Latin America Market Value (US$ Million) Analysis and Forecast 2017 to 2032, by Technology
Table 15: Latin America Market Value (US$ Million) Analysis and Forecast 2017 to 2032, by End User
Table 16: Europe Market Value (US$ Million) Analysis 2017 to 2021 and Forecast 2022 to 2032, by Country
Table 17: Europe Market Value (US$ Million) Analysis and Forecast 2017 to 2032, by Product
Table 18: Europe Market Volume (Units) Analysis and Forecast 2017 to 2032, by Product
Table 19: Europe Market Value (US$ Million) Analysis and Forecast 2017 to 2032, by Technology
Table 20: Europe Market Value (US$ Million) Analysis and Forecast 2017 to 2032, by End User
Table 21: South Asia Market Value (US$ Million) Analysis 2017 to 2021 and Forecast 2022 to 2032, by Country
Table 22: South Asia Market Value (US$ Million) Analysis and Forecast 2017 to 2032, by Product
Table 23: South Asia Market Volume (Units) Analysis and Forecast 2017 to 2032, by Product
Table 24: South Asia Market Value (US$ Million) Analysis and Forecast 2017 to 2032, by Technology
Table 25: South Asia Market Value (US$ Million) Analysis and Forecast 2017 to 2032, by End User
Table 26: East Asia Market Value (US$ Million) Analysis 2017 to 2021 and Forecast 2022 to 2032, by Country
Table 27: East Asia Market Value (US$ Million) Analysis and Forecast 2017 to 2032, by Product
Table 28: East Asia Market Volume (Units) Analysis and Forecast 2017 to 2032, by Product
Table 29: East Asia Market Value (US$ Million) Analysis and Forecast 2017 to 2032, by Technology
Table 30: East Asia Market Value (US$ Million) Analysis and Forecast 2017 to 2032, by End User
Table 31: Oceania Market Value (US$ Million) Analysis 2017 to 2021 and Forecast 2022 to 2032, by Country
Table 32: Oceania Market Value (US$ Million) Analysis and Forecast 2017 to 2032, by Product
Table 33: Oceania Market Volume (Units) Analysis and Forecast 2017 to 2032, by Product
Table 34: Oceania Market Value (US$ Million) Analysis and Forecast 2017 to 2032, by Technology
Table 35: Oceania Market Value (US$ Million) Analysis and Forecast 2017 to 2032, by End User
Table 36: MEA Market Value (US$ Million) Analysis 2017 to 2021 and Forecast 2022 to 2032, by Country
Table 37: MEA Market Value (US$ Million) Analysis and Forecast 2017 to 2032, by Product
Table 38: MEA Market Volume (Units) Analysis and Forecast 2017 to 2032, by Product
Table 39: MEA Market Value (US$ Million) Analysis and Forecast 2017 to 2032, by Technology
Table 40: MEA Market Value (US$ Million) Analysis and Forecast 2017 to 2032, by End User
Figure 01: Global Market Volume (Units), 2017 to 2021
Figure 02: Global Market Volume (Units) & Y-o-Y Growth (%) Analysis, 2022 to 2032
Figure 03: Stethoscope Hygiene Devices, Pricing Analysis per unit (US$), in 2021
Figure 04: Stethoscope Hygiene Devices, Pricing Forecast per unit (US$), in 2032
Figure 05: Global Market Value (US$ Million) Analysis, 2017 to 2021
Figure 06: Global Market Forecast & Y-o-Y Growth, 2022 to 2032
Figure 07: Global Market Absolute $ Opportunity (US$ Million) Analysis, 2021 to 2032
Figure 08: Global Market Value Share (%) Analysis 2022 and 2032, by Product
Figure 09: Global Market Y-o-Y Growth (%) Analysis 2021 to 2032, by Product
Figure 10: Global Market Attractiveness Analysis 2022 to 2032, by Product
Figure 11: Global Market Value Share (%) Analysis 2022 and 2032, by Technology
Figure 12: Global Market Y-o-Y Growth (%) Analysis 2021 to 2032, by Technology
Figure 13: Global Market Attractiveness Analysis 2022 to 2032, by Technology
Figure 14: Global Market Value Share (%) Analysis 2022 and 2032, by End User
Figure 15: Global Market Y-o-Y Growth (%) Analysis 2021 to 2032, by End User
Figure 16: Global Market Attractiveness Analysis 2022 to 2032, by End User
Figure 17: Global Market Value Share (%) Analysis 2022 and 2032, by Region
Figure 18: Global Market Y-o-Y Growth (%) Analysis 2021 to 2032, by Region
Figure 19: Global Market Attractiveness Analysis 2022 to 2032, by Region
Figure 20: North America Market Value (US$ Million) Analysis, 2017 to 2021
Figure 21: North America Market Value (US$ Million) Forecast, 2022-2032
Figure 22: North America Market Value Share, by Product (2022 E)
Figure 23: North America Market Value Share, by Technology (2022 E)
Figure 24: North America Market Value Share, by End User (2022 E)
Figure 25: North America Market Value Share, by Country (2022 E)
Figure 26: North America Market Attractiveness Analysis by Product, 2022 to 2032
Figure 27: North America Market Attractiveness Analysis by Technology, 2022 to 2032
Figure 28: North America Market Attractiveness Analysis by End User, 2022 to 2032
Figure 29: North America Market Attractiveness Analysis by Country, 2022 to 2032
Figure 30: The US Market Value Proportion Analysis, 2021
Figure 31: Global Vs. U.S. Growth Comparison
Figure 32: The US Market Share Analysis (%) by Product, 2021 to 2032
Figure 33: The US Market Share Analysis (%) by Technology, 2021 to 2032
Figure 34: The US Market Share Analysis (%) by End User, 2021 to 2032
Figure 35: Canada Market Value Proportion Analysis, 2021
Figure 36: Global Vs. Canada. Growth Comparison
Figure 37: Canada Market Share Analysis (%) by Product, 2021 to 2032
Figure 38: Canada Market Share Analysis (%) by Technology, 2021 to 2032
Figure 39: Canada Market Share Analysis (%) by End User, 2021 to 2032
Figure 40: Latin America Market Value (US$ Million) Analysis, 2017 to 2021
Figure 41: Latin America Market Value (US$ Million) Forecast, 2022-2032
Figure 42: Latin America Market Value Share, by Product (2022 E)
Figure 43: Latin America Market Value Share, by Technology (2022 E)
Figure 44: Latin America Market Value Share, by End User (2022 E)
Figure 45: Latin America Market Value Share, by Country (2022 E)
Figure 46: Latin America Market Attractiveness Analysis by Product, 2022 to 2032
Figure 47: Latin America Market Attractiveness Analysis by Technology, 2022 to 2032
Figure 48: Latin America Market Attractiveness Analysis by End User, 2022 to 2032
Figure 49: Latin America Market Attractiveness Analysis by Country, 2022 to 2032
Figure 50: Mexico Market Value Proportion Analysis, 2021
Figure 51: Global Vs Mexico Growth Comparison
Figure 52: Mexico Market Share Analysis (%) by Product, 2021 to 2032
Figure 53: Mexico Market Share Analysis (%) by Technology, 2021 to 2032
Figure 54: Mexico Market Share Analysis (%) by End User, 2021 to 2032
Figure 55: Brazil Market Value Proportion Analysis, 2021
Figure 56: Global Vs. Brazil. Growth Comparison
Figure 57: Brazil Market Share Analysis (%) by Product, 2021 to 2032
Figure 58: Brazil Market Share Analysis (%) by Technology, 2021 to 2032
Figure 59: Brazil Market Share Analysis (%) by End User, 2021 to 2032
Figure 60: Argentina Market Value Proportion Analysis, 2021
Figure 61: Global Vs Argentina Growth Comparison
Figure 62: Argentina Market Share Analysis (%) by Product, 2021 to 2032
Figure 63: Argentina Market Share Analysis (%) by Technology, 2021 to 2032
Figure 64: Argentina Market Share Analysis (%) by End User, 2021 to 2032
Figure 65: Europe Market Value (US$ Million) Analysis, 2017 to 2021
Figure 66: Europe Market Value (US$ Million) Forecast, 2022-2032
Figure 67: Europe Market Value Share, by Product (2022 E)
Figure 68: Europe Market Value Share, by Technology (2022 E)
Figure 69: Europe Market Value Share, by End User (2022 E)
Figure 70: Europe Market Value Share, by Country (2022 E)
Figure 71: Europe Market Attractiveness Analysis by Product, 2022 to 2032
Figure 72: Europe Market Attractiveness Analysis by Technology, 2022 to 2032
Figure 73: Europe Market Attractiveness Analysis by End User, 2022 to 2032
Figure 74: Europe Market Attractiveness Analysis by Country, 2022 to 2032
Figure 75: UK Market Value Proportion Analysis, 2021
Figure 76: Global Vs. UK Growth Comparison
Figure 77: UK Market Share Analysis (%) by Product, 2021 to 2032
Figure 78: UK Market Share Analysis (%) by Technology, 2021 to 2032
Figure 79: UK Market Share Analysis (%) by End User, 2021 to 2032
Figure 80: Germany Market Value Proportion Analysis, 2021
Figure 81: Global Vs. Germany Growth Comparison
Figure 82: Germany Market Share Analysis (%) by Product, 2021 to 2032
Figure 83: Germany Market Share Analysis (%) by Technology, 2021 to 2032
Figure 84: Germany Market Share Analysis (%) by End User, 2021 to 2032
Figure 85: Italy Market Value Proportion Analysis, 2021
Figure 86: Global Vs. Italy Growth Comparison
Figure 87: Italy Market Share Analysis (%) by Product, 2021 to 2032
Figure 88: Italy Market Share Analysis (%) by Technology, 2021 to 2032
Figure 89: Italy Market Share Analysis (%) by End User, 2021 to 2032
Figure 90: France Market Value Proportion Analysis, 2021
Figure 91: Global Vs France Growth Comparison
Figure 92: France Market Share Analysis (%) by Product, 2021 to 2032
Figure 93: France Market Share Analysis (%) by Technology, 2021 to 2032
Figure 94: France Market Share Analysis (%) by End User, 2021 to 2032
Figure 95: Spain Market Value Proportion Analysis, 2021
Figure 96: Global Vs Spain Growth Comparison
Figure 97: Spain Market Share Analysis (%) by Product, 2021 to 2032
Figure 98: Spain Market Share Analysis (%) by Technology, 2021 to 2032
Figure 99: Spain Market Share Analysis (%) by End User, 2021 to 2032
Figure 100: Russia Market Value Proportion Analysis, 2021
Figure 101: Global Vs Russia Growth Comparison
Figure 102: Russia Market Share Analysis (%) by Product, 2021 to 2032
Figure 103: Russia Market Share Analysis (%) by Technology, 2021 to 2032
Figure 104: Russia Market Share Analysis (%) by End User, 2021 to 2032
Figure 105: BENELUX Market Value Proportion Analysis, 2021
Figure 106: Global Vs BENELUX Growth Comparison
Figure 107: BENELUX Market Share Analysis (%) by Product, 2021 to 2032
Figure 108: BENELUX Market Share Analysis (%) by Technology, 2021 to 2032
Figure 109: BENELUX Market Share Analysis (%) by End User, 2021 to 2032
Figure 110: East Asia Market Value (US$ Million) Analysis, 2017 to 2021
Figure 111: East Asia Market Value (US$ Million) Forecast, 2022-2032
Figure 112: East Asia Market Value Share, by Product (2022 E)
Figure 113: East Asia Market Value Share, by Technology (2022 E)
Figure 114: East Asia Market Value Share, by End User (2022 E)
Figure 115: East Asia Market Value Share, by Country (2022 E)
Figure 116: East Asia Market Attractiveness Analysis by Product, 2022 to 2032
Figure 117: East Asia Market Attractiveness Analysis by Technology, 2022 to 2032
Figure 118: East Asia Market Attractiveness Analysis by End User, 2022 to 2032
Figure 119: East Asia Market Attractiveness Analysis by Country, 2022 to 2032
Figure 120: China Market Value Proportion Analysis, 2021
Figure 121: Global Vs. China Growth Comparison
Figure 122: China Market Share Analysis (%) by Product, 2021 to 2032
Figure 123: China Market Share Analysis (%) by Technology, 2021 to 2032
Figure 124: China Market Share Analysis (%) by End User, 2021 to 2032
Figure 125: Japan Market Value Proportion Analysis, 2021
Figure 126: Global Vs. Japan Growth Comparison
Figure 127: Japan Market Share Analysis (%) by Product, 2021 to 2032
Figure 128: Japan Market Share Analysis (%) by Technology, 2021 to 2032
Figure 129: Japan Market Share Analysis (%) by End User, 2021 to 2032
Figure 130: South Korea Market Value Proportion Analysis, 2021
Figure 131: Global Vs South Korea Growth Comparison
Figure 132: South Korea Market Share Analysis (%) by Product, 2021 to 2032
Figure 133: South Korea Market Share Analysis (%) by Technology, 2021 to 2032
Figure 134: South Korea Market Share Analysis (%) by End User, 2021 to 2032
Figure 135: South Asia Market Value (US$ Million) Analysis, 2017 to 2021
Figure 136: South Asia Market Value (US$ Million) Forecast, 2022-2032
Figure 137: South Asia Market Value Share, by Product (2022 E)
Figure 138: South Asia Market Value Share, by Technology (2022 E)
Figure 139: South Asia Market Value Share, by End User (2022 E)
Figure 140: South Asia Market Value Share, by Country (2022 E)
Figure 141: South Asia Market Attractiveness Analysis by Product, 2022 to 2032
Figure 142: South Asia Market Attractiveness Analysis by Technology, 2022 to 2032
Figure 143: South Asia Market Attractiveness Analysis by End User, 2022 to 2032
Figure 144: South Asia Market Attractiveness Analysis by Country, 2022 to 2032
Figure 145: India Market Value Proportion Analysis, 2021
Figure 146: Global Vs. India Growth Comparison
Figure 147: India Market Share Analysis (%) by Product, 2021 to 2032
Figure 148: India Market Share Analysis (%) by Technology, 2021 to 2032
Figure 149: India Market Share Analysis (%) by End User, 2021 to 2032
Figure 150: Indonesia Market Value Proportion Analysis, 2021
Figure 151: Global Vs. Indonesia Growth Comparison
Figure 152: Indonesia Market Share Analysis (%) by Product, 2021 to 2032
Figure 153: Indonesia Market Share Analysis (%) by Technology, 2021 to 2032
Figure 154: Indonesia Market Share Analysis (%) by End User, 2021 to 2032
Figure 155: Malaysia Market Value Proportion Analysis, 2021
Figure 156: Global Vs. Malaysia Growth Comparison
Figure 157: Malaysia Market Share Analysis (%) by Product, 2021 to 2032
Figure 158: Malaysia Market Share Analysis (%) by Technology, 2021 to 2032
Figure 159: Malaysia Market Share Analysis (%) by End User, 2021 to 2032
Figure 160: Thailand Market Value Proportion Analysis, 2021
Figure 161: Global Vs. Thailand Growth Comparison
Figure 162: Thailand Market Share Analysis (%) by Product, 2021 to 2032
Figure 163: Thailand Market Share Analysis (%) by Technology, 2021 to 2032
Figure 164: Thailand Market Share Analysis (%) by End User, 2021 to 2032
Figure 165: Oceania Market Value (US$ Million) Analysis, 2017 to 2021
Figure 166: Oceania Market Value (US$ Million) Forecast, 2022-2032
Figure 167: Oceania Market Value Share, by Product (2022 E)
Figure 168: Oceania Market Value Share, by Technology (2022 E)
Figure 169: Oceania Market Value Share, by End User (2022 E)
Figure 170: Oceania Market Value Share, by Country (2022 E)
Figure 171: Oceania Market Attractiveness Analysis by Product, 2022 to 2032
Figure 172: Oceania Market Attractiveness Analysis by Technology, 2022 to 2032
Figure 173: Oceania Market Attractiveness Analysis by End User, 2022 to 2032
Figure 174: Oceania Market Attractiveness Analysis by Country, 2022 to 2032
Figure 175: Australia Market Value Proportion Analysis, 2021
Figure 176: Global Vs. Australia Growth Comparison
Figure 177: Australia Market Share Analysis (%) by Product, 2021 to 2032
Figure 178: Australia Market Share Analysis (%) by Technology, 2021 to 2032
Figure 179: Australia Market Share Analysis (%) by End User, 2021 to 2032
Figure 180: New Zealand Market Value Proportion Analysis, 2021
Figure 181: Global Vs New Zealand Growth Comparison
Figure 182: New Zealand Market Share Analysis (%) by Product, 2021 to 2032
Figure 183: New Zealand Market Share Analysis (%) by Technology, 2021 to 2032
Figure 184: New Zealand Market Share Analysis (%) by End User, 2021 to 2032
Figure 185: Middle East & Africa Market Value (US$ Million) Analysis, 2017 to 2021
Figure 186: Middle East & Africa Market Value (US$ Million) Forecast, 2022-2032
Figure 187: Middle East & Africa Market Value Share, by Product (2022 E)
Figure 188: Middle East & Africa Market Value Share, by Technology (2022 E)
Figure 189: Middle East & Africa Market Value Share, by End User (2022 E)
Figure 190: Middle East & Africa Market Value Share, by Country (2022 E)
Figure 191: Middle East & Africa Market Attractiveness Analysis by Product, 2022 to 2032
Figure 192: Middle East & Africa Market Attractiveness Analysis by Technology, 2022 to 2032
Figure 193: Middle East & Africa Market Attractiveness Analysis by End User, 2022 to 2032
Figure 194: Middle East & Africa Market Attractiveness Analysis by Country, 2022 to 2032
Figure 195: GCC Countries Market Value Proportion Analysis, 2021
Figure 196: Global Vs GCC Countries Growth Comparison
Figure 197: GCC Countries Market Share Analysis (%) by Product, 2021 to 2032
Figure 198: GCC Countries Market Share Analysis (%) by Technology, 2021 to 2032
Figure 199: GCC Countries Market Share Analysis (%) by End User, 2021 to 2032
Figure 200: Turkey Market Value Proportion Analysis, 2021
Figure 201: Global Vs. Turkey Growth Comparison
Figure 202: Turkey Market Share Analysis (%) by Product, 2021 to 2032
Figure 203: Turkey Market Share Analysis (%) by Technology, 2021 to 2032
Figure 204: Turkey Market Share Analysis (%) by End User, 2021 to 2032
Figure 205: South Africa Market Value Proportion Analysis, 2021
Figure 206: Global Vs. South Africa Growth Comparison
Figure 207: South Africa Market Share Analysis (%) by Product, 2021 to 2032
Figure 208: South Africa Market Share Analysis (%) by Technology, 2021 to 2032
Figure 209: South Africa Market Share Analysis (%) by End User, 2021 to 2032
Figure 210: North Africa Market Value Proportion Analysis, 2021
Figure 211: Global Vs North Africa Growth Comparison
Figure 212: North Africa Market Share Analysis (%) by Product, 2021 to 2032
Figure 213: North Africa Market Share Analysis (%) by Technology, 2021 to 2032
Figure 214: North Africa Market Share Analysis (%) by End User, 2021 to 2032
The global stethoscope hygiene devices market is estimated to be worth USD 47.4 Million in 2022 and is set to expand 1.9X over the next ten years.
The stethoscope hygiene devices market is expected to reach USD 91.4 Million by the end of 2032, with sales revenue expected to register 6.8% CAGR.
Europe is a crucial market for stethoscope hygiene devices accounting for about 24.2% of the global stethoscope hygiene devices market in the year 2021.
USA, China, India, Italy, and UK are expected to drive demand for the stethoscope hygiene devices industry.
North America is one of the key markets for stethoscope hygiene devices accounting for about 28.3% of the global stethoscope hygiene devices market in the year 2021.
Demand for stethoscope hygiene devices in South Asia is expected to register a CAGR of 7.6% over the next ten years.
The USA, Italy, and India are the key producers of stethoscope hygiene devices.
LightProgress/egoHealth, Xech, Your First Services Inc., Vioguard, Edmund Optics, Parsons, UV Smart, and Tangshan UMG Medical Instrument Co., Ltd, are some of the key players in the stethoscope hygiene devices industry.
The stethoscope hygiene devices market in MEA is set to expand at a 6.7% CAGR during the forecast years.
Factors like rising HAIs (hospital-acquired infections), stethoscope hygiene adoption, novel product launches, cost of devices, etc. are some of the factors that are influencing the dynamics of this market.
Explore Similar Insights
Thank you!
You will receive an email from our Business Development Manager. Please be sure to check your SPAM/JUNK folder too.