The global super absorbent polymer market is likely to reach USD 16.4 billion by 2035, recording an absolute increase of USD 6.7 billion over the forecast period. The market is valued at USD 9.7 billion in 2025 and is set to rise at a CAGR of 5.4% during the assessment period. The market size is expected to grow by nearly 1.7 times during the same period, supported by increasing demand for premium baby diapers and adult incontinence products across global markets, rising hygiene awareness in emerging economies, driving demand for absorbent core materials and growing investments in ultra-thin diaper technologies, bio-based SAP development, and agricultural water retention applications globally.
Between 2025 and 2030, the super absorbent polymer market is projected to expand from USD 9.7 billion to USD 12.4 billion, resulting in a value increase of USD 2.7 billion, which represents 40.3% of the total forecast growth for the decade. This phase of development will be shaped by rising demand for premium baby diapers and adult incontinence products in aging populations, product innovation in ultra-thin absorbent core technologies and bio-based SAP formulations, as well as expanding integration with sustainable hygiene manufacturing and water-retention agricultural applications. Companies are establishing competitive positions through investment in high-performance SAP grades, energy-efficient production processes, and strategic market expansion across personal hygiene, agricultural, and medical applications.
From 2030 to 2035, the market is forecast to grow from USD 12.4 billion to USD 16.4 billion, adding another USD 4.0 billion, which constitutes 59.7% of the overall ten-year expansion. This period is expected to be characterized by the expansion of specialized SAP systems, including bio-based partially renewable formulations and ultra-thin diaper-grade polymers tailored for premium hygiene applications, strategic collaborations between SAP producers and hygiene product manufacturers, and an enhanced focus on carbon footprint reduction and circular economy principles. The growing emphasis on sustainability-driven hygiene products and climate-resilient agriculture will drive demand for advanced, high-performance super absorbent polymer solutions across diverse industrial applications.
One of the most influential market dynamics is the transformation occurring in baby hygiene markets globally. In high-growth regions such as South Asia, Southeast Asia, and parts of Africa, rising disposable incomes and expanding modern retail channels are accelerating diaper penetration. Even modest increases in diaper usage per child translate into massive SAP volume growth because SAP content per unit steadily rises as manufacturers optimize material usage and migrate toward thinner cores. At the premium end, ultra-thin designs increasingly depend on higher-performance SAP grades rather than thick fluff-pulp structures, creating a structural shift toward formulations with superior gel strength, absorption rate, and fluid-locking capabilities.
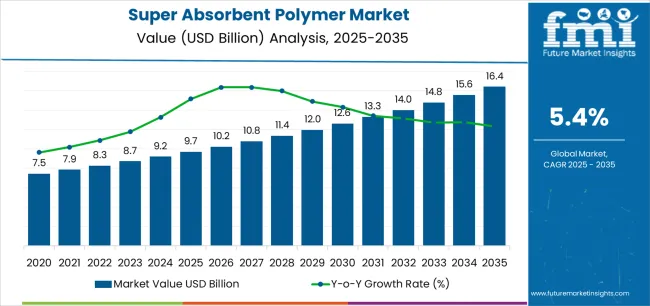
| Metric | Value |
|---|---|
| Market Value (2025) | USD 9.7 billion |
| Market Forecast Value (2035) | USD 16.4 billion |
| Forecast CAGR (2025-2035) | 5.4% |
The super absorbent polymer market grows by enabling hygiene product manufacturers to achieve superior fluid absorption capacities of 300-500 times the polymer's weight, delivering essential performance characteristics for baby diapers, adult incontinence products, and feminine hygiene applications. Baby diaper manufacturers face mounting pressure to produce thinner, more comfortable products while maintaining leak protection, with ultra-thin diaper designs reducing material usage by 30-40% while SAP content increases to 50-60% of absorbent core weight ensuring performance and comfort. Adult incontinence product demand accelerates driven by aging populations in developed markets, where individuals aged 65+ represent growing consumer segments requiring discrete, high-capacity absorbent products supporting active lifestyles and dignity maintenance.
Government hygiene initiatives and sanitation programs drive SAP adoption across emerging markets, where access to disposable hygiene products improves health outcomes and supports female workforce participation. Agricultural applications create demand for water-retention SAP formulations supporting crop cultivation in drought-prone regions, reducing irrigation requirements by 20-30% while improving soil moisture retention and crop yields.
The market is segmented by type, application, region, feedstock/origin, and region. By type, the market is divided into sodium polyacrylate and other types. Based on application, the market is categorized into personal hygiene, agriculture, medical, and industrial applications. By feedstock/origin, the market includes petro-based SAP and bio-based/partially bio-based SAP. Regionally, the market is divided into Asia Pacific, North America, Europe, and other key regions.
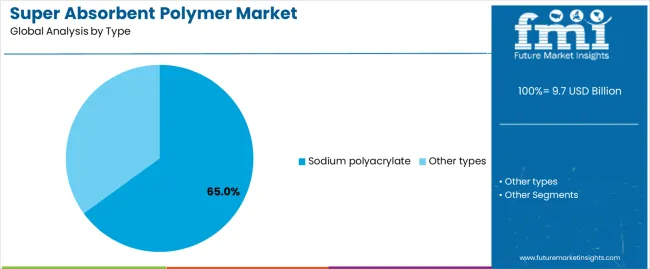
The sodium polyacrylate segment represents the dominant force in the super absorbent polymer market, capturing approximately 65.0% of total market share in 2025. This category encompasses cross-linked sodium acrylate polymers offering exceptional water absorption, retention capacity, and gel strength properties essential for hygiene product absorbent cores, agricultural soil conditioning, and medical wound dressings. The sodium polyacrylate segment's market leadership stems from proven performance across diverse applications, established manufacturing infrastructure, and cost-effectiveness compared to alternative superabsorbent materials.
Within the sodium polyacrylate segment, hygiene grade formulations account for 74.0% of applications serving baby diapers, adult incontinence, and feminine hygiene products. Agriculture grade captures 12.0% supporting water retention in cultivation, while medical grade represents 9.0% serving wound care and surgical applications.
Petro-based SAP dominates the super absorbent polymer market with approximately 90.0% market share in 2025, reflecting established manufacturing infrastructure based on petroleum-derived acrylic acid monomer through propylene oxidation and catalytic processes. The petro-based segment's market leadership is supported by proven performance characteristics, cost competitiveness through integrated petrochemical supply chains, and extensive application validation across hygiene, agricultural, and medical segments.
Within petro-based SAP, conventional cross-linked formulations account for 72.0% of total market share serving standard hygiene and agricultural applications, while high-performance ultra-thin diaper grades represent 18.0% supporting premium product segments. Bio-based and partially bio-based SAP formulations capture 10.0% market share through emerging sustainable alternatives utilizing renewable feedstocks.
The market is driven by three concrete demand factors tied to hygiene and agricultural requirements.
Global hygiene product penetration increases particularly across emerging markets, with disposable diaper usage in Asia Pacific growing 8-12% annually driven by urbanization, rising middle-class incomes, and female workforce participation creating demand for convenient hygiene solutions requiring high-performance SAP.
The aging population demographics across developed economies accelerate adult incontinence product consumption, with global population aged 65+ projected to reach 1.5 billion by 2050, requiring discrete, high-capacity absorbent products consuming 30-40% more SAP per unit compared to baby diapers due to higher fluid volumes and extended wear times.
The agricultural water scarcity and climate adaptation initiatives drive SAP adoption for soil moisture retention, with water-retentive polymers reducing irrigation requirements by 20-30% in drought-prone cultivation supporting food security objectives and sustainable farming practices.
Market restraints include raw material price volatility affecting production economics, particularly petroleum-derived acrylic acid and propylene feedstock costs that fluctuate with crude oil prices impacting SAP manufacturer margins during commodity cycle upswings. Environmental sustainability concerns create challenges, as petroleum-based SAP biodegradability limitations and disposal considerations drive scrutiny from environmental advocacy groups and regulatory bodies considering extended producer responsibility schemes for hygiene products. Performance trade-offs in bio-based alternatives pose technical hurdles, as partially renewable SAP formulations may exhibit reduced absorption capacity or gel strength compared to conventional petroleum-based products requiring reformulation efforts and application validation.
Key trends indicate accelerated adoption of ultra-thin diaper technologies requiring higher-performance SAP grades with enhanced absorption rates, gel strength, and distribution capabilities enabling thinner absorbent cores while maintaining leak protection and comfort. Bio-based SAP development intensifies as hygiene brands pursue sustainability commitments, with partially renewable formulations utilizing bio-acrylic acid from glycerin or 3-hydroxypropionic acid fermentation routes targeting 20-30% renewable content. Carbon footprint reduction initiatives drive process optimization at SAP manufacturing facilities, with energy-efficient polymerization, waste heat recovery, and renewable energy adoption reducing lifecycle emissions supporting hygiene brand sustainability targets.
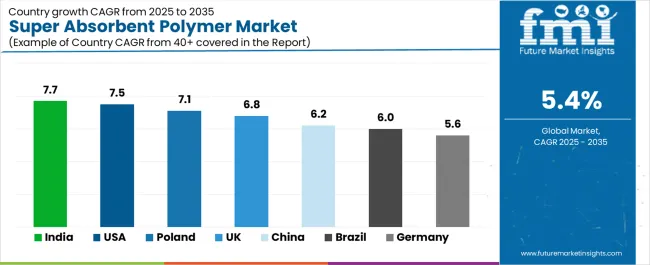
| Country | CAGR (2025-2035) |
|---|---|
| India | 7.7 |
| USA | 7.5 |
| Poland | 7.1 |
| UK | 6.8 |
| China | 6.2 |
| Brazil | 6.0 |
| Germany | 5.6 |
The super absorbent polymer market is gaining momentum worldwide, with India taking the lead thanks to hygiene product penetration gains in Tier-2 and Tier-3 cities, government sanitation drives promoting menstrual hygiene and baby care, and water-retentive SAP applications in drought-prone agriculture. Close behind, the USA benefits from aging demographics boosting adult incontinence product demand, premium diaper format adoption requiring advanced SAP grades, and established acrylic acid value chain infrastructure, positioning itself as a mature high-value market. Poland shows impressive advancement, where fast-growing private-label hygiene manufacturing, EU structural funds supporting healthcare product development, and rising local converting capacity strengthen its role as a Central European production hub. The UK stands out for hospital and long-term care absorbent product requirements and eco-focused hygiene brands adopting lower-footprint SAP grades, while China maintains robust growth through diaper and feminine care manufacturing scale and bio-based SAP pilot programs, and Brazil and Germany continue consistent progress in expanding diaper usage and premium incontinence demand respectively.
The report covers an in-depth analysis of 40+ countries, Top-performing countries are highlighted below.
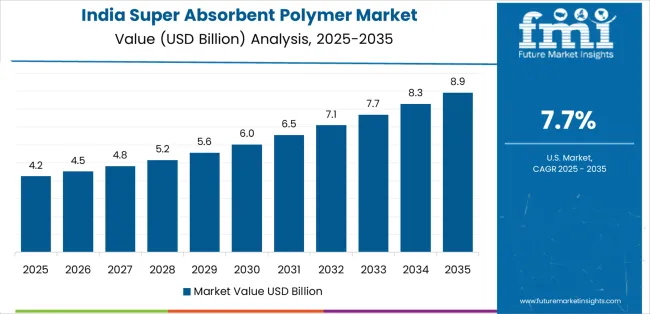
India demonstrates the strongest growth potential in the Super Absorbent Polymer Market with a CAGR of 7.7% through 2035. The country's leadership position stems from rapid hygiene product penetration in Tier-2 and Tier-3 cities, driven by rising disposable incomes and urbanization, government sanitation initiatives, including Swachh Bharat Abhiyan, promoting menstrual hygiene management and baby care awareness, and agricultural applications utilizing water-retentive SAP in drought-prone regions, supporting crop yields and irrigation efficiency improvements. Growth is concentrated in major manufacturing clusters including Gujarat, Maharashtra, Tamil Nadu, and Telangana, where hygiene product converters and agricultural input suppliers are implementing modern SAP-based formulations. Distribution channels through retail expansion, e-commerce platforms, and government procurement programs expand deployment across urban and rural markets. The country's Make in India initiatives and Production Linked Incentive schemes provide policy support for domestic hygiene product manufacturing and specialty polymer production capacity development supporting import substitution objectives.
The USA demonstrates solid growth potential with a CAGR of 7.5% through 2035, driven by aging demographics significantly boosting adult incontinence product consumption across growing elderly populations, premium baby diaper format adoption featuring ultra-thin designs requiring high-performance SAP grades, and established integrated acrylic acid production infrastructure supporting cost-competitive SAP manufacturing. Growth is concentrated in major hygiene product manufacturing regions including Southeast converting clusters, Midwest distribution centers, and Gulf Coast chemical production facilities. American consumers demonstrate preferences for premium absorbent products emphasizing comfort, discretion, and environmental attributes, driving demand for advanced SAP formulations including enhanced absorption rates, odor control capabilities, and partially bio-based alternatives. The country's mature market dynamics favor innovation in ultra-thin technologies, sustainable material development, and specialized applications including medical wound care and industrial absorbent products supporting diverse end-use requirements beyond core hygiene applications.
Poland demonstrates promising growth potential with a CAGR of 7.1% through 2035, driven by rapid private-label hygiene product manufacturing expansion serving European retail chains, EU structural funds supporting healthcare product development and manufacturing infrastructure, and rising local converting capacity attracting multinational hygiene brands establishing production facilities. Growth is concentrated in major industrial regions including Mazowieckie, Wielkopolskie, and Śląskie provinces, where hygiene product converters are implementing modern manufacturing systems. Polish manufacturers benefit from strategic geographic location enabling efficient distribution across European markets, competitive labor costs supporting cost-effective production, and EU market access facilitating seamless trade flows. The country's developing healthcare infrastructure and aging population demographics create sustained domestic demand growth while export-oriented manufacturing serves broader European hygiene product markets through established supply chain relationships.
The UK demonstrates moderate growth potential with a CAGR of 6.8% through 2035, focused on hospital and long-term care absorbent product requirements serving National Health Service procurement and private care facility networks, eco-focused hygiene brands adopting lower-footprint SAP grades supporting consumer sustainability preferences, and premium incontinence product demand driven by aging population demographics and active elderly lifestyle trends. Growth is supported by healthcare system requirements, sustainability-driven brand positioning, and consumer willingness to pay premium prices for environmentally improved products. British consumers demonstrate strong environmental consciousness influencing hygiene product purchasing decisions, creating opportunities for bio-based SAP adoption and carbon-neutral product positioning. The country's mature market conditions favor innovation in sustainable materials, medical-grade applications, and specialized absorbent products addressing niche healthcare and industrial requirements beyond mass-market baby diaper applications.
China demonstrates robust growth momentum with a CAGR of 6.2% through 2035, driven by massive-scale baby diaper and feminine care manufacturing serving domestic consumption and global export markets, cost-optimized SAP production supporting competitive hygiene product pricing, and pilot bio-based SAP development programs exploring renewable feedstock integration. Growth is concentrated in major manufacturing provinces including Jiangsu, Zhejiang, Guangdong, and Fujian, where hygiene product converters and SAP producers maintain integrated supply chain relationships. Chinese manufacturers demonstrate leadership in production scale, process efficiency optimization, and cost reduction initiatives enabling competitive positioning in price-sensitive emerging markets. The country's domestic hygiene market maturation creates sophisticated consumer segments demanding premium product attributes while export-oriented manufacturing maintains volume growth trajectories supporting sustained SAP consumption increases across both domestic and international sales channels.
Brazil demonstrates moderate growth potential with a CAGR of 6.0% through 2035, driven by expanding baby diaper usage penetration across growing middle-class populations, agricultural SAP applications supporting water retention in Cerrado region farming systems, and feminine hygiene product adoption improvements through retail expansion and consumer awareness initiatives. Growth is concentrated in major urban centers including São Paulo, Rio de Janeiro, and Belo Horizonte metropolitan areas, plus agricultural regions utilizing water-retention polymers in crop cultivation. Brazilian consumers demonstrate increasing adoption of disposable hygiene products driven by convenience preferences, hygiene awareness, and organized retail expansion making premium products accessible beyond traditional upper-income segments. The country's agricultural sector represents unique growth opportunity as drought-prone Cerrado farming systems implement water-retention technologies supporting soybean, corn, and cotton cultivation productivity improvements amid climate variability challenges.
Germany demonstrates moderate growth potential with a CAGR of 5.6% through 2035, driven by premium adult incontinence product demand serving aging population demographics with high-quality performance expectations, research and development activities focused on bio-based SAP aligned with EU sustainability regulations, and established hygiene product manufacturing infrastructure supporting domestic consumption and European export markets. Growth is concentrated in major industrial regions including North Rhine-Westphalia, Bavaria, and Baden-Württemberg, where hygiene product converters and chemical manufacturers maintain integrated operations. German consumers demonstrate strong preferences for premium product quality, environmental sustainability attributes, and performance reliability, creating sustained demand for advanced SAP formulations despite mature market conditions. The country's leadership in bio-based polymer development and sustainable chemistry positions German manufacturers at forefront of renewable SAP commercialization efforts supporting industry transition toward reduced petroleum dependency.
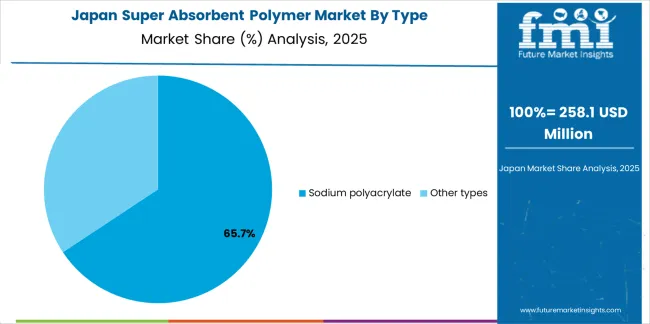
The Japanese Super Absorbent Polymer Market demonstrates a mature and quality-focused landscape, characterized by sophisticated implementation of high-performance SAP systems supporting premium baby diapers, adult incontinence products, and feminine hygiene items emphasizing comfort, discretion, and reliability. Japan's emphasis on product quality and consumer satisfaction drives demand for ultra-thin diaper technologies utilizing advanced SAP grades supporting industry-leading absorption performance and minimal product thickness. The market benefits from strong partnerships between international SAP providers like Nippon Shokubai, Sumitomo Seika Chemicals, and major hygiene brands including Unicharm, Kao Corporation, and Daio Paper, creating comprehensive technical support ecosystems prioritizing performance consistency and continuous product innovation. Manufacturing centers in Tokyo, Osaka, and Nagoya regions showcase advanced converting operations where ultra-thin diaper technologies achieve exceptional absorption performance through precision SAP distribution and absorbent core engineering supporting Japan's reputation for premium hygiene product quality.
The South Korean Super Absorbent Polymer Market is characterized by strong domestic manufacturing presence, with companies including Korean hygiene brands and international SAP suppliers maintaining significant positions through comprehensive technical support and quality assurance capabilities. The market demonstrates growing emphasis on premium baby diaper manufacturing and export-oriented hygiene product production, as Korean manufacturers increasingly demand high-performance SAP grades supporting ultra-thin diaper technologies and advanced absorbent core designs integrating with domestic hygiene manufacturing infrastructure operated across major industrial complexes. Local chemical companies and regional SAP producers are gaining market share through strategic partnerships with global acrylic acid suppliers and hygiene brand partnerships, offering specialized services including Korean market customization and rapid product development cycles. The competitive landscape shows increasing collaboration between international SAP producers and Korean hygiene manufacturers, creating hybrid service models combining global polymer expertise with local manufacturing capabilities and quality management systems supporting premium product positioning.
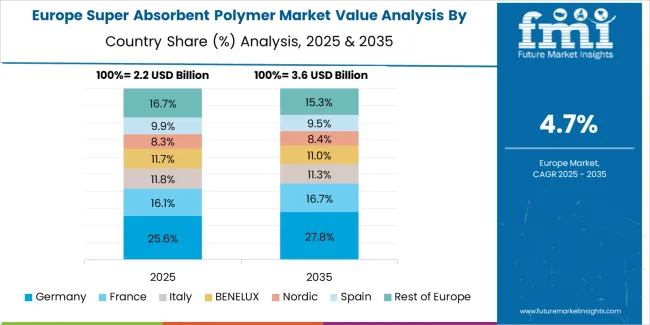
Europe is estimated at USD 2.3 billion in 2025, representing 23.5% of the USD 9.7 billion global SAP market. Within Europe, Germany leads with USD 0.5 billion supported by premium incontinence demand and bio-based SAP development capabilities. The United Kingdom follows with USD 0.3 billion driven by healthcare absorbent requirements and eco-focused hygiene brands, while France holds USD 0.3 billion through established hygiene manufacturing and retail distribution networks. Italy commands USD 0.2 billion with baby diaper and feminine hygiene consumption, while Spain accounts for USD 0.2 billion serving growing hygiene product markets. Nordics & Benelux capture USD 0.4 billion through premium product preferences and advanced healthcare systems, while Central & Eastern Europe represents USD 0.4 billion with expanding converting capacity and export-oriented manufacturing. Growth is underpinned by high penetration of premium diapers and incontinence products, EU eco-design and waste directives pushing lower-footprint SAP grades, and sustained demand from aging populations and private-label hygiene expansion across retail channels.
Super absorbent polymers represent specialized cross-linked materials that enable hygiene product manufacturers to achieve fluid absorption capacities of 300-500 times polymer weight, delivering superior performance characteristics essential for baby diapers, adult incontinence products, and feminine hygiene applications supporting consumer health, comfort, and dignity. With the market projected to grow from USD 9.7 billion in 2025 to USD 16.4 billion by 2035 at a 5.4% CAGR, these polymer systems offer compelling advantages - proven absorption performance, cost-effectiveness through established manufacturing, and versatile application potential - making them essential for personal hygiene applications (67.0% market share), agricultural water retention, and medical wound care seeking alternatives to traditional cellulose-based absorbents that compromise performance and product design flexibility. Scaling market adoption and sustainable material development requires coordinated action across polymer industry policy, hygiene standards, SAP manufacturers, hygiene product brands, and circular economy investment capital.
How Governments Could Spur Local Production and Adoption?
How Industry Bodies Could Support Market Development?
How OEMs and Technology Players Could Strengthen the Ecosystem?
How Suppliers Could Navigate the Shift?
How Investors and Financial Enablers Could Unlock Value?
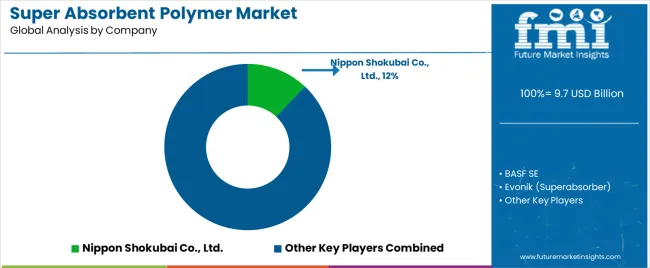
The super absorbent polymer (SAP) market features 12–18 players with moderate concentration, where the top three companies collectively hold around 46–52% of global market share. Growth is driven by rising demand from hygiene products, adult incontinence, agriculture, medical applications, and industrial absorbents. The leading company, Nippon Shokubai Co., Ltd., commands 12% market share, supported by its extensive acrylic-based SAP production network, long-standing partnerships with global diaper manufacturers, and strong R&D focus. Competition centers on absorption capacity, gel strength, fluid retention under load, sustainability, and supply reliability rather than price alone.
Market leaders such as Nippon Shokubai, BASF SE, and Evonik Superabsorber maintain dominant positions by offering high-performance SAP grades engineered for diapers, hygiene pads, and advanced absorption systems. Their strengths include large-scale acrylic monomer integration, consistent quality, and global technical support.
Challenger companies including Sumitomo Seika Chemicals, SDP Global Co., Ltd., and Shandong Nuoer Biological Technology Co., Ltd. compete through cost-efficient production, high-absorption SAP grades, and regionally optimized supply to Asia-Pacific hygiene manufacturers.
Additional competitive pressure arises from Yixing Danson Technology, Zhejiang Weilong Polymer Material, Wanhua Chemical Group, Quan Zhou Banglida Technology Industry, and Sanyo Chemical Industries, which strengthen market presence through capacity expansions, customized SAP grades, and strong relationships with regional diaper and sanitary product producers.
| Item | Value |
|---|---|
| Quantitative Units | USD 9.7 billion |
| Type | Sodium polyacrylate (Hygiene grade, Agriculture grade, Medical grade, Industrial/cable/blocking), Other types |
| Application | Personal hygiene (Baby diapers, Adult incontinence, Feminine hygiene, Other hygiene), Agriculture, Medical, Industrial |
| Feedstock/Origin | Petro-based SAP (Conventional cross-linked, High-performance/ultra-thin diaper grade), Bio-based/partially bio-based SAP |
| Regions Covered | Asia Pacific, North America, Europe, Latin America, Middle East & Africa |
| Country Covered | India, USA, Poland, UK, China, Brazil, Germany, and 40+ countries |
| Key Companies Profiled | Nippon Shokubai Co., Ltd., BASF SE, Evonik Superabsorber, Sumitomo Seika Chemicals Co., Ltd., SDP Global Co., Ltd., Shandong Nuoer Biological Technology Co., Ltd., Yixing Danson Technology, Zhejiang Weilong Polymer Material Co., Ltd., Wanhua Chemical Group Co., Ltd., Quan Zhou Banglida Technology Industry Co., Ltd., and Sanyo Chemical Industries |
| Additional Attributes | Dollar sales by type, application, and feedstock/origin categories, regional adoption trends across Asia Pacific, North America, and Europe, competitive landscape with integrated polymer producers and specialty manufacturers, application requirements and performance specifications, integration with hygiene product manufacturing, agricultural systems, and medical applications, innovations in bio-based formulations and ultra-thin diaper-grade technologies, and development of sustainable polymer systems with enhanced absorption performance and reduced environmental impact characteristics. |
The global super absorbent polymer market is estimated to be valued at USD 9.7 billion in 2025.
The market size for the super absorbent polymer market is projected to reach USD 16.4 billion by 2035.
The super absorbent polymer market is expected to grow at a 5.4% CAGR between 2025 and 2035.
The key product types in super absorbent polymer market are sodium polyacrylate and other types.
In terms of feedstock/origin, petro-based sap segment to command 90.0% share in the super absorbent polymer market in 2025.


Our Research Products

The "Full Research Suite" delivers actionable market intel, deep dives on markets or technologies, so clients act faster, cut risk, and unlock growth.

The Leaderboard benchmarks and ranks top vendors, classifying them as Established Leaders, Leading Challengers, or Disruptors & Challengers.

Locates where complements amplify value and substitutes erode it, forecasting net impact by horizon

We deliver granular, decision-grade intel: market sizing, 5-year forecasts, pricing, adoption, usage, revenue, and operational KPIs—plus competitor tracking, regulation, and value chains—across 60 countries broadly.

Spot the shifts before they hit your P&L. We track inflection points, adoption curves, pricing moves, and ecosystem plays to show where demand is heading, why it is changing, and what to do next across high-growth markets and disruptive tech

Real-time reads of user behavior. We track shifting priorities, perceptions of today’s and next-gen services, and provider experience, then pace how fast tech moves from trial to adoption, blending buyer, consumer, and channel inputs with social signals (#WhySwitch, #UX).

Partner with our analyst team to build a custom report designed around your business priorities. From analysing market trends to assessing competitors or crafting bespoke datasets, we tailor insights to your needs.
Supplier Intelligence
Discovery & Profiling
Capacity & Footprint
Performance & Risk
Compliance & Governance
Commercial Readiness
Who Supplies Whom
Scorecards & Shortlists
Playbooks & Docs
Category Intelligence
Definition & Scope
Demand & Use Cases
Cost Drivers
Market Structure
Supply Chain Map
Trade & Policy
Operating Norms
Deliverables
Buyer Intelligence
Account Basics
Spend & Scope
Procurement Model
Vendor Requirements
Terms & Policies
Entry Strategy
Pain Points & Triggers
Outputs
Pricing Analysis
Benchmarks
Trends
Should-Cost
Indexation
Landed Cost
Commercial Terms
Deliverables
Brand Analysis
Positioning & Value Prop
Share & Presence
Customer Evidence
Go-to-Market
Digital & Reputation
Compliance & Trust
KPIs & Gaps
Outputs
Full Research Suite comprises of:
Market outlook & trends analysis
Interviews & case studies
Strategic recommendations
Vendor profiles & capabilities analysis
5-year forecasts
8 regions and 60+ country-level data splits
Market segment data splits
12 months of continuous data updates
DELIVERED AS:
PDF EXCEL ONLINE
Superabrasive Electroplated Grinding Wheel Market Size and Share Forecast Outlook 2025 to 2035
Superconducting Detector Market Size and Share Forecast Outlook 2025 to 2035
Super Calendered Glassine Paper Market Size and Share Forecast Outlook 2025 to 2035
Superalloys Market Size and Share Forecast Outlook 2025 to 2035
Super Antioxidant Supplement Market Size and Share Forecast Outlook 2025 to 2035
Superheater Tubes Market Size and Share Forecast Outlook 2025 to 2035
Super Apps Market Size and Share Forecast Outlook 2025 to 2035
Superconducting Quantum Chip Market Size and Share Forecast Outlook 2025 to 2035
Superconducting Materials Market Size and Share Forecast Outlook 2025 to 2035
Superficial Radiation Therapy System Market Size and Share Forecast Outlook 2025 to 2035
The Super Generics Market Is Segmented by Drug Type, Therapeutic Area, Route of Administration and Distribution Channel from 2025 To 2035
Super Generics Industry Analysis in Europe Report - Trends & Innovations 2025 to 2035
Superficial Punctate Keratitis Treatment Market Insights – Demand and Growth Forecast 2025 to 2035
Super Resolution Microscope Market Insights - Size, Share & Forecast 2025 to 2035
Superfood Powders Market Analysis - Size, Share & Forecast 2025 to 2035
Superconducting Magnets Market Growth – Trends & Forecast 2025 to 2035
Supercapacitors Market Report - Trends & Industry Outlook through 2034
Super Barrier Coated Film Market Trends & Forecast 2024-2034
Superfood Market Trends – Growth & Industry Forecast 2024 to 2034
Super Junction MOSFET Market

Thank you!
You will receive an email from our Business Development Manager. Please be sure to check your SPAM/JUNK folder too.
Chat With
MaRIA