Super Antioxidant Supplement Market Size and Share Forecast Outlook (2024 to 2034)

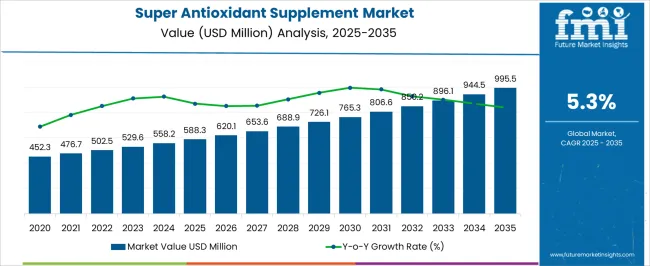
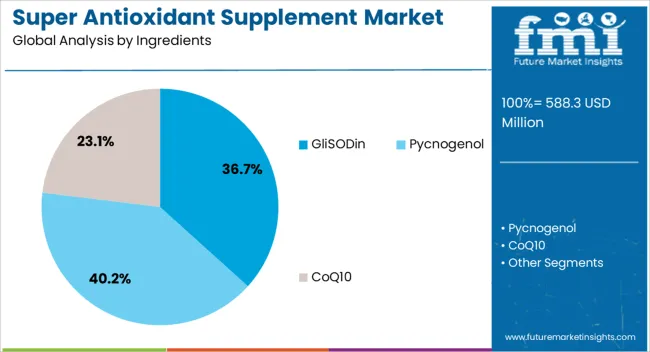
The global super antioxidant supplement market is expected to record a valuation of USD 558.1 million by the end of 2024 and further expand at a CAGR rate of 5.4% to reach a valuation of USD 942.0 million by 2034. As per analysis, GliSODin is the leading ingredient in the market, with a share of about 59.3% in 2024.

Market Outlook:

Super antioxidant supplements are gaining popularity due to their health-effective factors. These supplements contain antioxidant concentrates, vitamins, and minerals that are beneficial to the body and provide the required nutrients.

The benefits of antioxidants in skincare are another factor that is boosting the growth of the market. Organic skincare supplements with antioxidants are in demand as they are natural and plant-based. Vitamin C and E are beneficial antioxidants for the skin, as they protect against sun damage. Therefore, the demand for super antioxidants containing multivitamins is achieving new heights in the market.

Data Points Market Insights
Market Value 2023 USD 529.6 million
Market Value 2024 USD 558.1 million
Market Value 2034 USD 942.0 million
CAGR 2024 to 2034 5.4%
Market Share of Top 5 Countries 47.7%
Key Market Players Healths Harmony, Quten Research Institute, LLC, Higher Nature Limited., Inlife Pharma Pvt. Ltd., NOW Foods, Bluebonnet Nutrition Corporation, Puritan's Pride, Inc., Vegepower, Solgar Inc., Sigmaceutical, Livestamin Healthcare LLP, Nu-Gen Nutrition, Inc., Inlife Pharma Pvt. Ltd.

Sales Analysis of Super Antioxidant Supplements (2019 to 2023) vs Forecast (2024 to 2034)

The market value for super antioxidant supplements was around USD 455.5 million in 2019 and reached USD 529.6 million in 2023.

The sale of super antioxidant supplements expanded at a CAGR of 5.2% from 2019 to 2023, owing to the increasing prevalence of health issues because of antioxidant deficiencies.

The increasing rate of cigarette smoking is damaging the body and leading to immunity deficiency. For instance, as per the statement by the Centers for Disease Control and Prevention, people who are consistently smokers are more likely to develop cardiac disorders, lung cancer, and stroke. Due to the fact of increasing cancer prevalence, the consumption of supplements containing beta-carotene and vitamins is highly in demand.

Additionally, the use of immunity-boosting supplements during the COVID-19 pandemic has set new heights for antioxidant supplements. Supplements containing anti-inflammatory and antiviral properties were highly in demand as they helped boost immunity in the patients. Thus, owing to the aforementioned factors, the global super antioxidant supplements market is expected to evolve at a CAGR of 5.4% during the forecast period.

Key Opportunities for Super Antioxidant Supplement Manufacturers

The demand for super antioxidant supplements among the population is rising. Government agencies and industry players are also developing fresh approaches to boost market expansion. Additionally, the rise in investments in new research and other initiatives is subsequently helping the market to grow.

The rising geriatric population across the globe is creating a solid customer base for multivitamin supplements. This can be a lucrative opportunity for market players to expand their products and generate revenue. Furthermore, increasing awareness about super antioxidant supplements in developing and underdeveloped countries is creating opportunities for market players.

Key Restraints Impacting Demand for Super Antioxidant Supplements

Dietary supplements can have high economic value, making them vulnerable to fraud. Similar to other forms of fraud, the sale of counterfeit supplements has the potential to compromise the integrity of items that are made with high standards. Customers who buy tainted or mislabelled nutritional supplements through unconventional supply chains put their health at risk without even realizing it. This may hamper the brand value for certain manufacturers.

Furthermore, taking antioxidant supplements in excessive doses may occasionally be associated with health hazards. High amounts of beta-carotene supplements may make smokers more susceptible to lung cancer. Prostate cancer and other types of stroke risk may rise with heavy vitamin E supplementation. Cumulatively, these factors propose a negative effect on the developmental growth of the super antioxidant supplements market.

Analysis of Top Countries Manufacturing, Certifying, and Using Super Antioxidant Supplements

Countries Market Insights
The United States 22.5%
India 7.1%
China 10.5%
Germany 4.2%
The United Kingdom 3.3%

Demand for Dietary Supplements Driving the Market in the United States

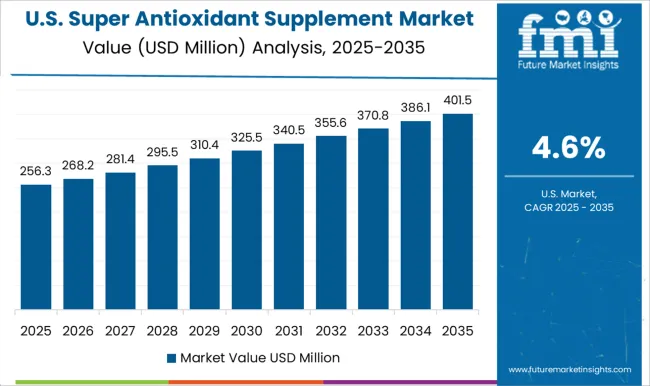
The United States dominates the North American region with a total market share of about 83.6% in 2024 and is expected to show the same growth throughout the forecast period.

The key factor driving the United States super antioxidant supplements market is the growing popularity of antioxidant supplements. As people in the United States are aware of the benefits of antioxidant supplements, the demand for these supplements is increasing. The increasing government initiatives to raise awareness of novel super antioxidant supplements among the populace and the development of incorporating antioxidants in medication to provide immunity and wellness are propelling the market.

Furthermore, a growing interest in a healthy lifestyle and an increasing rate of chronic diseases in the United States is further budding the market. Antioxidant supplements may help to prevent chronic diseases such as cardiovascular diseases and macular degeneration, as they help neutralize free radicals.

Antioxidant Capsules for Skin Nutrition Strengthening the Market in the United Kingdom

The super antioxidant supplement market in the United Kingdom recorded a market share of nearly 21.5% in 2024. The leading factor driving the market growth is the rising concerns of skin issues among the population.

The increasing concerns about outer appearance, especially among women, are increasing the demand for skin care supplements, as they provide hydration, reduce wrinkles, and improve the structure of the skin. Furthermore, the purchasing capacity of the population and increasing consumption of supplements is anticipated to boost market growth.

Antioxidant-rich Beverage Creating a Lucrative Market for Super Antioxidant Supplements in China

China is set to exhibit a growth rate of nearly 7.0% in the super antioxidant supplements market from 2024 to 2034. The rising awareness about super antioxidant supplements due to the increasing infectious diseases over the past few years is propelling the market growth in China. Besides this, the growing expenditure on health-promoting products and development in clean-label beverages further enhance market growth.

The increasing disposable incomes of the population and increasing customer base for healthy drinks in China are expected to drive the market.

Super Antioxidant Supplement Industry Analysis by Top Investment Segments

GliSODin is the Leading Ingredient in Super Antioxidant Supplements

Ingredient GliSODin
CAGR 5.7%

GliSODin is expected to show growth of 5.7% in the projected period, with a market share of 59.3% in 2024. GliSODin is highly used in skincare supplements as it promotes improvement in the skin’s structure and provides hydration to the skin. Thus, the rising demand for skin care products among people has increased the demand for antioxidant supplements.

Immune Booster Segment in Dominating the Market in Application Category

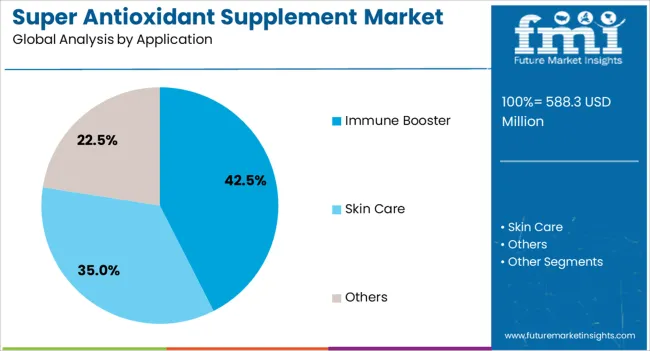
The immune booster segment is propelling the market of super antioxidant supplements by 41.5% of the market share in 2024 and is expected to expand with a CAGR of 5.9% by 2034. The growing prevalence of infectious diseases and other common disorders owing to insufficiency of immunity.

Application mmune Booster
CAGR 5.9%

Super antioxidant supplements are highly recommended for boosting immunity. Thus, the demand for super antioxidant supplements is increasing by driving the market growth.

Online Stores Benefiting the Sales of Super Antioxidant Supplements

Distribution Channel Online Store
CAGR 6.5%

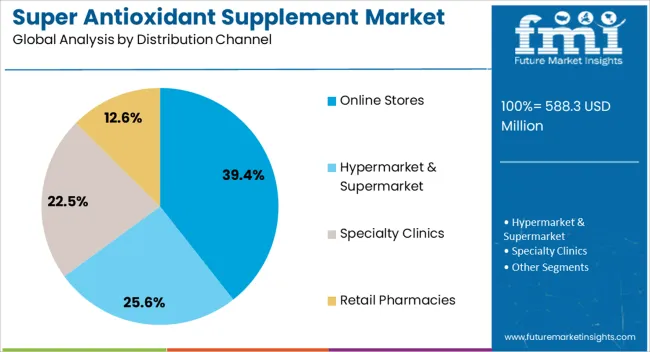
The online store segment held a significant market share of around 39.9% in 2024, with an expected growth rate of 6.5% by 2034. The availability of novel products on different online sites, and increasing accessibility of the products across different regions is expanding the market for super antioxidant supplements and is assumed to expand in the coming future.
Competitive Landscape of the Super Antioxidant Supplement Market

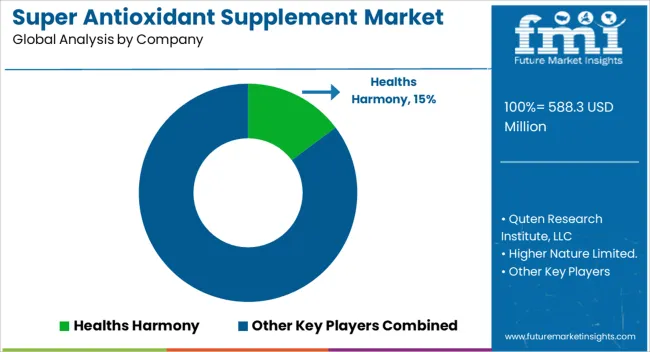
In the super antioxidant supplements market, market players are employing various strategies to boost their sales and generate revenue. These companies are actively engaging in activities such as marketing campaigns and launching new and innovative products to meet consumer demand and expand their market presence. Market players are adopting these strategies in the super antioxidant supplements market to enhance their competitiveness and capture a larger share of the market.

Recent Development

  • In April 2023, Now Foods launched a new campaign featuring exclusive lifestyle tips and skincare solutions. The campaign incorporated celebrities and dermatologists and aimed to inspire people to focus on health and achieve wellness goals.
  • In 2023, NutriJa launched an antioxidant supplement, NutriJa Advance Electrolyte +, to prevent cramps and restore the balance of electrolytes.

Scope and Coverage of the Super Antioxidant Supplement Industry Report

Attribute Details
Forecast Period 2024 to 2034
Historical Data Available for 2019 to 2023
Market Analysis USD million for Value
Key Regions Covered North America; Latin America; Europe; South Asia; East Asia; Oceania; and Middle East & Africa
Key Countries Covered United States, Canada, Brazil, Mexico, Argentina, United Kingdom, Germany, Italy, Russia, Spain, France, BENELUX, Nordic Countries, India, Thailand, Indonesia, Malaysia, Japan, China, South Korea, Australia, New Zealand, Turkey, GCC Countries, and South Africa
Key Market Segments Covered Ingredients, Application, Distribution Channel, and Region
Key Companies Profiled Healths Harmony; Quten Research Institute, LLC; Higher Nature Limited.; Inlife Pharma Pvt. Ltd.; NOW Foods; Bluebonnet Nutrition Corporation; Puritan's Pride, Inc.; Vegepower; Solgar Inc.; Sigmaceutical; Livestamin Healthcare LLP; Nu-Gen Nutrition, Inc.; Inlife Pharma Pvt. Ltd.
Pricing Available upon Request

Top Segments Studied in the Super Antioxidant Supplement Market

By Ingredients:

  • GliSODin
  • Pycnogenol
  • CoQ10

By Application:

  • Immune Booster
  • Skin Care
  • Others

By Distribution Channel:

  • Hypermarket & Supermarket
  • Online Stores
  • Specialty Clinics
  • Retail Pharmacies

By Region:

  • North America
  • Latin America
  • Europe
  • South Asia
  • East Asia
  • Oceania
  • The Middle East and Africa (MEA)

Table of Content

  • 1. Executive Summary
  • 2. Market Overview
  • 3. Brand Mapping Analysis
  • 4. Distribution Channel Wise Key Brand Positioning
  • 5. Consumer Buying Behavior Analysis
  • 6. Market Trends & Dynamics
  • 7. Value Added Insights
  • 8. Market Background
  • 9. Global Market Demand (in Value or Size in USD Million) Analysis 2017 to 2022 and Forecast, 2023 to 2033
  • 10. Global Market Analysis 2017 to 2022 and Forecast 2023 to 2033, by Ingredients
    • 10.1. GliSODin
    • 10.2. Pycnogenol
    • 10.3. CoQ10
  • 11. Global Market Analysis 2017 to 2022 and Forecast 2023 to 2033, by Application
    • 11.1. Immune Booster
    • 11.2. Skin Care
    • 11.3. Others
  • 12. Global Market Analysis 2017 to 2022 and Forecast 2023 to 2033, by Distribution Channel
    • 12.1. Hypermarket & Supermarket
    • 12.2. Online Stores
    • 12.3. Specialty Clinics
    • 12.4. Retail Pharmacies
  • 13. Global Market Analysis 2017 to 2022 and Forecast 2023 to 2033, by Region
    • 13.1. North America
    • 13.2. Latin America
    • 13.3. Europe
    • 13.4. South Asia
    • 13.5. East Asia
    • 13.6. Oceania
    • 13.7. Middle East & Africa
  • 14. North America Market Analysis 2017 to 2022 and Forecast 2023 to 2033
  • 15. Latin America Market Analysis 2017 to 2022 and Forecast 2023 to 2033
  • 16. Europe Market Analysis 2017 to 2022 and Forecast 2023 to 2033
  • 17. East Asia Market Analysis 2017 to 2022 and Forecast 2023 to 2033
  • 18. South Asia Market Analysis 2017 to 2022 and Forecast 2023 to 2033
  • 19. Oceania Market Analysis 2017 to 2022 and Forecast 2023 to 2033
  • 20. Middle East & Africa Market Analysis 2017 to 2022 and Forecast 2023 to 2033
  • 21. Market Structure Analysis
  • 22. Competition Analysis
    • 22.1. Healths Harmony
    • 22.2. Quten Research Institute, LLC
    • 22.3. Higher Nature Limited
    • 22.4. Inlife Pharma Pvt. Ltd.
    • 22.5. NOW® Foods
    • 22.6. Bluebonnet Nutrition Corporation
    • 22.7. Puritan's Pride, Inc.
    • 22.8. Vegepower
    • 22.9. Solgar Inc.
    • 22.10. Sigmaceutical
    • 22.11. Livestamin Healthcare LLP
    • 22.12. Nu-Gen Nutrition, Inc.
    • 22.13. Inlife Pharma Pvt. Ltd.
  • 23. Assumptions and Acronyms Used
  • 24. Research Methodology

List of Tables

Table 01: Global Market Value (US$ Million) Analysis 2017 to 2022, By Ingredients

Table 02: Global Market Value (US$ Million) Opportunity Assessment 2023 to 2033, By Ingredients

Table 03: Global Market Value (US$ Million) Analysis 2017 to 2022, By Application

Table 04: Global Market Value (US$ Million) Opportunity Assessment 2023 to 2033, By Application

Table 05: Global Market Value (US$ Million) Analysis 2017 to 2022, By Distribution Channel

Table 06: Global Market Value (US$ Million) Opportunity Assessment 2023 to 2033, By Distribution Channel

Table 07: Global Market Value (US$ Million) Analysis 2017 to 2022, By Region

Table 08: Global Market Value (US$ Million) Opportunity Assessment 2023 to 2033, By Region

Table 09: North America Market Value (US$ Million) Analysis 2017 to 2022, By Country

Table 10: North America Market Value (US$ Million) Opportunity Assessment 2023 to 2033, By Country

Table 11: North America Market Value (US$ Million) Analysis 2017 to 2022, By Ingredients

Table 12: North America Market Value (US$ Million) Opportunity Assessment 2023 to 2033, By Ingredients

Table 13: North America Market Value (US$ Million) Analysis 2017 to 2022, By Application

Table 14: North America Market Value (US$ Million) Opportunity Assessment 2023 to 2033, By Application

Table 15: North America Market Value (US$ Million) Analysis 2017 to 2022, By Distribution Channel

Table 16: North America Market Value (US$ Million) Opportunity Assessment 2023 to 2033, By Distribution Channel

Table 17: Latin America Market Value (US$ Million) Analysis 2017 to 2022, By Country

Table 18: Latin America Market Value (US$ Million) Opportunity Assessment 2023 to 2033, By Country

Table 19: Latin America Market Value (US$ Million) Analysis 2017 to 2022, By Ingredients

Table 20: Latin America Market Value (US$ Million) Opportunity Assessment 2023 to 2033, By Ingredients

Table 21: Latin America Market Value (US$ Million) Analysis 2017 to 2022, By Application

Table 22: Latin America Market Value (US$ Million) Opportunity Assessment 2023 to 2033, By Application

Table 23: Latin America Market Value (US$ Million) Analysis 2017 to 2022, By Distribution Channel

Table 24: Latin America Market Value (US$ Million) Opportunity Assessment 2023 to 2033, By Distribution Channel

Table 25: Europe Market Value (US$ Million) Analysis 2017 to 2022, By Country

Table 26: Europe Market Value (US$ Million) Opportunity Assessment 2023 to 2033, By Country

Table 27: Europe Market Value (US$ Million) Analysis 2017 to 2022, By Ingredients

Table 28: Europe Market Value (US$ Million) Opportunity Assessment 2023 to 2033, By Ingredients

Table 29: Europe Market Value (US$ Million) Analysis 2017 to 2022, By Application

Table 30: Europe Market Value (US$ Million) Opportunity Assessment 2023 to 2033, By Application

Table 31: Europe Market Value (US$ Million) Analysis 2017 to 2022, By Distribution Channel

Table 32: Europe Market Value (US$ Million) Opportunity Assessment 2023 to 2033, By Distribution Channel

Table 33: East Asia Market Value (US$ Million) Analysis 2017 to 2022, By Country

Table 34: East Asia Market Value (US$ Million) Opportunity Assessment 2023 to 2033, By Country

Table 35: East Asia Market Value (US$ Million) Analysis 2017 to 2022, By Ingredients

Table 36: East Asia Market Value (US$ Million) Opportunity Assessment 2023 to 2033, By Ingredients

Table 37: East Asia Market Value (US$ Million) Analysis 2017 to 2022, By Application

Table 38: East Asia Market Value (US$ Million) Opportunity Assessment 2023 to 2033, By Application

Table 39: East Asia Market Value (US$ Million) Analysis 2017 to 2022, By Distribution Channel

Table 40: East Asia Market Value (US$ Million) Opportunity Assessment 2023 to 2033, By Distribution Channel

Table 41: South Asia Market Value (US$ Million) Analysis 2017 to 2022, By Country

Table 42: South Asia Market Value (US$ Million) Opportunity Assessment 2023 to 2033, By Country

Table 43: South Asia Market Value (US$ Million) Analysis 2017 to 2022, By Ingredients

Table 44: South Asia Market Value (US$ Million) Opportunity Assessment 2023 to 2033, By Ingredients

Table 45: South Asia Market Value (US$ Million) Analysis 2017 to 2022, By Application

Table 46: South Asia Market Value (US$ Million) Opportunity Assessment 2023 to 2033, By Application

Table 47: South Asia Market Value (US$ Million) Analysis 2017 to 2022, By Distribution Channel

Table 48: South Asia Market Value (US$ Million) Opportunity Assessment 2023 to 2033, By Distribution Channel

Table 49: Oceania Market Value (US$ Million) Analysis 2017 to 2022, By Country

Table 50: Oceania Market Value (US$ Million) Opportunity Assessment 2023 to 2033, By Country

Table 51: Oceania Market Value (US$ Million) Analysis 2017 to 2022, By Ingredients

Table 52: Oceania Market Value (US$ Million) Opportunity Assessment 2023 to 2033, By Ingredients

Table 53: Oceania Market Value (US$ Million) Analysis 2017 to 2022, By Application

Table 54: Oceania Market Value (US$ Million) Opportunity Assessment 2023 to 2033, By Application

Table 55: Oceania Market Value (US$ Million) Analysis 2017 to 2022, By Distribution Channel

Table 56: Oceania Market Value (US$ Million) Opportunity Assessment 2023 to 2033, By Distribution Channel

Table 57: Middle East and Africa (MEA) Market Value (US$ Million) Analysis 2017 to 2022, By Country

Table 58: Middle East and Africa (MEA) Market Value (US$ Million) Opportunity Assessment 2023 to 2033, By Country

Table 59: Middle East and Africa (MEA) Market Value (US$ Million) Analysis 2017 to 2022, By Ingredients

Table 60: Middle East and Africa (MEA) Market Value (US$ Million) Opportunity Assessment 2023 to 2033, By Ingredients

Table 61: Middle East and Africa (MEA) Market Value (US$ Million) Analysis 2017 to 2022, By Application

Table 62: Middle East and Africa (MEA) Market Value (US$ Million) Opportunity Assessment 2023 to 2033, By Application

Table 63: Middle East and Africa (MEA) Market Value (US$ Million) Analysis 2017 to 2022, By Distribution Channel

Table 64: Middle East and Africa (MEA) Market Value (US$ Million) Opportunity Assessme

List of Figures

Figure 01: Global Market Historical Market Value (US$ Million) Analysis, 2017 to 2022

Figure 02: Global Market Value (US$ Million), 2023 to 2033 & Y-o-Y Growth Trend Analysis

Figure 03: Global Market Absolute $ Opportunity, 2023 to 2033

Figure 04: Global Market Share Analysis (%), By Ingredients, 2023 to 2033

Figure 05: Global Market Y-o-Y Analysis (%), By Ingredients, 2023 to 2033

Figure 06: Global Market Attractiveness Analysis, By Ingredients, 2023 to 2033

Figure 07: Global Market Share Analysis (%), By Application, 2023 to 2033

Figure 08: Global Market Y-o-Y Analysis (%), By Application, 2023 to 2033

Figure 09: Global Market Attractiveness Analysis, By Application, 2023 to 2033

Figure 10: Global Market Share Analysis (%), By Distribution Channel, 2023 to 2033

Figure 11: Global Market Y-o-Y Analysis (%), By Distribution Channel, 2023 to 2033

Figure 12: Global Market Attractiveness Analysis, By Distribution Channel, 2023 to 2033

Figure 13: Global Market Share Analysis (%), By Region, 2023 to 2033

Figure 14: Global Market Y-o-Y Analysis (%), By Region, 2023 to 2033

Figure 15: Global Market Attractiveness Analysis, By Region, 2023 to 2033

Figure 16: North America Market Share Analysis (%), By Country 2023 (E)

Figure 17: North America Market Share Analysis (%), By Ingredients 2023 (E)

Figure 18: North America Market Share Analysis (%), By Application 2023 (E)

Figure 19: North America Market Share Analysis (%), By Distribution Channel 2023 (E)

Figure 20: North America Historical Market Value (US$ Million) Analysis, 2017 to 2022

Figure 21: North America Current and Future Market Value (US$ Million), 2023 to 2033 & Y-o-Y Growth Trend Analysis

Figure 22: North America Market Attractiveness Analysis, By Country

Figure 23: North America Market Attractiveness Analysis, By Ingredients

Figure 24: North America Market Attractiveness Analysis, By Application

Figure 25: North America Market Attractiveness Analysis, By Distribution Channel

Figure 26: USA Market Value Proportion Analysis, 2022

Figure 27: Global Vs USA Y-o-Y Growth Comparison, 2023 to 2033

Figure 28: USA Market Share Analysis (%), By Ingredients, 2023 to 2033

Figure 29: USA Market Share Analysis (%), By Application, 2023 to 2033

Figure 30: USA Market Share Analysis (%), By Distribution Channel, 2023 to 2033

Figure 31: Global Vs Canada Y-o-Y Growth Comparison, 2023 to 2033

Figure 32: Canada Market Share Analysis (%), By Ingredients, 2023 to 2033

Figure 33: Canada Market Share Analysis (%), By Application, 2023 to 2033

Figure 34: Canada Market Share Analysis (%), By Distribution Channel, 2023 to 2033

Figure 35: Latin America Market Share Analysis (%), By Country 2023 (E)

Figure 36: Latin America Market Share Analysis (%), By Ingredients 2023 (E)

Figure 37: Latin America Market Share Analysis (%), By Application 2023 (E)

Figure 38: Latin America Market Share Analysis (%), By Distribution Channel 2023 (E)

Figure 39: Latin America Historical Market Value (US$ Million) Analysis, 2017 to 2022

Figure 40: Latin America Current and Future Market Value (US$ Million), 2023 to 2033 & Y-o-Y Growth Trend Analysis

Figure 41: Latin America Market Attractiveness Analysis, By Country

Figure 42: Latin America Market Attractiveness Analysis, By Ingredients

Figure 43: Latin America Market Attractiveness Analysis, By Application

Figure 44: Latin America Market Attractiveness Analysis, By Distribution Channel

Figure 45: Brazil Market Value Proportion Analysis, 2022

Figure 46: Global Vs Brazil Y-o-Y Growth Comparison, 2023 to 2033

Figure 47: Brazil Market Share Analysis (%), By Ingredients, 2023 to 2033

Figure 48: Brazil Market Share Analysis (%), By Application, 2023 to 2033

Figure 49: Brazil Market Share Analysis (%), By Distribution Channel, 2023 to 2033

Figure 50: Mexico Market Value Proportion Analysis, 2022

Figure 51: Global Vs Mexico Y-o-Y Growth Comparison, 2023 to 2033

Figure 52: Mexico Market Share Analysis (%), By Ingredients, 2023 to 2033

Figure 53: Mexico Market Share Analysis (%), By Application, 2023 to 2033

Figure 54: Mexico Market Share Analysis (%), By Distribution Channel, 2023 to 2033

Figure 55: Argentina Market Value Proportion Analysis, 2022

Figure 56: Global Vs Argentina Y-o-Y Growth Comparison, 2023 to 2033

Figure 57: Argentina Market Share Analysis (%), By Ingredients, 2023 to 2033

Figure 58: Argentina Market Share Analysis (%), By Application, 2023 to 2033

Figure 59: Argentina Market Share Analysis (%), By Distribution Channel, 2023 to 2033

Figure 60: Europe Market Share Analysis (%), By Country 2023 (E)

Figure 61: Europe Market Share Analysis (%), By Ingredients 2023 (E)

Figure 62: Europe Market Share Analysis (%), By Application 2023 (E)

Figure 63: Europe Market Share Analysis (%), By Distribution Channel 2023 (E)

Figure 64: Europe Historical Market Value (US$ Million) Analysis, 2017 to 2022

Figure 65: Europe Current and Future Market Value (US$ Million), 2023 to 2033 & Y-o-Y Growth Trend Analysis

Figure 66: Europe Market Attractiveness Analysis, By Country

Figure 67: Europe Market Attractiveness Analysis, By Ingredients

Figure 68: Europe Market Attractiveness Analysis, By Application

Figure 69: Europe Market Attractiveness Analysis, By Distribution Channel

Figure 70: UK Market Value Proportion Analysis, 2022

Figure 71: Global Vs UK Y-o-Y Growth Comparison, 2023 to 2033

Figure 72: UK Market Share Analysis (%), By Ingredients, 2023 to 2033

Figure 73: UK Market Share Analysis (%), By Application, 2023 to 2033

Figure 74: UK Market Share Analysis (%), By Distribution Channel, 2023 to 2033

Figure 75: Germany Market Value Proportion Analysis, 2022

Figure 76: Global Vs Germany Y-o-Y Growth Comparison, 2023 to 2033

Figure 77: Germany Market Share Analysis (%), By Ingredients, 2023 to 2033

Figure 78: Germany Market Share Analysis (%), By Application, 2023 to 2033

Figure 79: Germany Market Share Analysis (%), By Distribution Channel, 2023 to 2033

Figure 80: Italy Market Value Proportion Analysis, 2022

Figure 81: Global Vs Italy Y-o-Y Growth Comparison, 2023 to 2033

Figure 82: Italy Market Share Analysis (%), By Ingredients, 2023 to 2033

Figure 83: Italy Market Share Analysis (%), By Application, 2023 to 2033

Figure 84: Italy Market Share Analysis (%), By Distribution Channel, 2023 to 2033

Figure 85: France Market Value Proportion Analysis, 2022

Figure 86: Global Vs France Y-o-Y Growth Comparison, 2023 to 2033

Figure 87: France Market Share Analysis (%), By Ingredients, 2023 to 2033

Figure 88: France Market Share Analysis (%), By Application, 2023 to 2033

Figure 89: France Market Share Analysis (%), By Distribution Channel, 2023 to 2033

Figure 90: Spain Market Value Proportion Analysis, 2022

Figure 91: Global Vs Spain Y-o-Y Growth Comparison, 2023 to 2033

Figure 92: Spain Market Share Analysis (%), By Ingredients, 2023 to 2033

Figure 93: Spain Market Share Analysis (%), By Application, 2023 to 2033

Figure 94: Spain Market Share Analysis (%), By Distribution Channel, 2023 to 2033

Figure 95: Russia Market Value Proportion Analysis, 2022

Figure 96: Global Vs Russia Y-o-Y Growth Comparison, 2023 to 2033

Figure 97: Russia Market Share Analysis (%), By Ingredients, 2023 to 2033

Figure 98: Russia Market Share Analysis (%), By Application, 2023 to 2033

Figure 99: Russia Market Share Analysis (%), By Distribution Channel, 2023 to 2033

Figure 100: Nordic Countries Market Value Proportion Analysis, 2022

Figure 101: Global Vs Nordic Countries Y-o-Y Growth Comparison, 2023 to 2033

Figure 102: Nordic Countries Market Share Analysis (%), By Ingredients, 2023 to 2033

Figure 103: Nordic Countries Market Share Analysis (%), By Application, 2023 to 2033

Figure 104: Nordic Countries Market Share Analysis (%), By Distribution Channel, 2023 to 2033

Figure 105: BENELUX Market Value Proportion Analysis, 2022

Figure 106: Global Vs BENELUX Y-o-Y Growth Comparison, 2023 to 2033

Figure 107: BENELUX Market Share Analysis (%), By Ingredients, 2023 to 2033

Figure 108: BENELUX Market Share Analysis (%), By Application, 2023 to 2033

Figure 109: BENELUX Market Share Analysis (%), By Distribution Channel, 2023 to 2033

Figure 110: East Asia Market Share Analysis (%), By Country 2023 (E)

Figure 111: East Asia Market Share Analysis (%), By Ingredients 2023 (E)

Figure 112: East Asia Market Share Analysis (%), By Application 2023 (E)

Figure 113: East Asia Market Share Analysis (%), By Distribution Channel 2023 (E)

Figure 114: East Asia Historical Market Value (US$ Million) Analysis, 2017 to 2022

Figure 115: East Asia Current and Future Market Value (US$ Million), 2023 to 2033 & Y-o-Y Growth Trend Analysis

Figure 116: East Asia Market Attractiveness Analysis, By Country

Figure 117: East Asia Market Attractiveness Analysis, By Ingredients

Figure 118: East Asia Market Attractiveness Analysis, By Application

Figure 119: East Asia Market Attractiveness Analysis, By Distribution Channel

Figure 120: China Market Value Proportion Analysis, 2022

Figure 121: Global Vs China Y-o-Y Growth Comparison, 2023 to 2033

Figure 122: China Market Share Analysis (%), By Ingredients, 2023 to 2033

Figure 123: China Market Share Analysis (%), By Application, 2023 to 2033

Figure 124: China Market Share Analysis (%), By Distribution Channel, 2023 to 2033

Figure 125: Japan Market Value Proportion Analysis, 2022

Figure 126: Global Vs Japan Y-o-Y Growth Comparison, 2023 to 2033

Figure 127: Japan Market Share Analysis (%), By Ingredients, 2023 to 2033

Figure 128: Japan Market Share Analysis (%), By Application, 2023 to 2033

Figure 129: Japan Market Share Analysis (%), By Distribution Channel, 2023 to 2033

Figure 130: South Korea Market Value Proportion Analysis, 2022

Figure 131: Global Vs South Korea Y-o-Y Growth Comparison, 2023 to 2033

Figure 132: South Korea Market Share Analysis (%), By Ingredients, 2023 to 2033

Figure 133: South Korea Market Share Analysis (%), By Application, 2023 to 2033

Figure 134: South Korea Market Share Analysis (%), By Distribution Channel, 2023 to 2033

Figure 135: South Asia Market Share Analysis (%), By Country 2023 (E)

Figure 136: South Asia Market Share Analysis (%), By Ingredients 2023 (E)

Figure 137: South Asia Market Share Analysis (%), By Application 2023 (E)

Figure 138: South Asia Market Share Analysis (%), By Distribution Channel 2023 (E)

Figure 139: South Asia Historical Market Value (US$ Million) Analysis, 2017 to 2022

Figure 140: South Asia Current and Future Market Value (US$ Million), 2023 to 2033 & Y-o-Y Growth Trend Analysis

Figure 141: South Asia Market Attractiveness Analysis, By Country

Figure 142: South Asia Market Attractiveness Analysis, By Ingredients

Figure 143: South Asia Market Attractiveness Analysis, By Application

Figure 144: South Asia Market Attractiveness Analysis, By Distribution Channel

Figure 145: India Market Value Proportion Analysis, 2022

Figure 146: Global Vs India Y-o-Y Growth Comparison, 2023 to 2033

Figure 147: India Market Share Analysis (%), By Ingredients, 2023 to 2033

Figure 148: India Market Share Analysis (%), By Application, 2023 to 2033

Figure 149: India Market Share Analysis (%), By Distribution Channel, 2023 to 2033

Figure 150: Thailand Market Value Proportion Analysis, 2022

Figure 151: Global Vs Thailand Y-o-Y Growth Comparison, 2023 to 2033

Figure 152: Thailand Market Share Analysis (%), By Ingredients, 2023 to 2033

Figure 153: Thailand Market Share Analysis (%), By Application, 2023 to 2033

Figure 154: Thailand Market Share Analysis (%), By Distribution Channel, 2023 to 2033

Figure 155: Indonesia Market Value Proportion Analysis, 2022

Figure 156: Global Vs Indonesia Y-o-Y Growth Comparison, 2023 to 2033

Figure 157: Indonesia Market Share Analysis (%), By Ingredients, 2023 to 2033

Figure 158: Indonesia Market Share Analysis (%), By Application, 2023 to 2033

Figure 159: Indonesia Market Share Analysis (%), By Distribution Channel, 2023 to 2033

Figure 160: Malaysia Market Value Proportion Analysis, 2022

Figure 161: Global Vs Malaysia Y-o-Y Growth Comparison, 2023 to 2033

Figure 162: Malaysia Market Share Analysis (%), By Ingredients, 2023 to 2033

Figure 163: Malaysia Market Share Analysis (%), By Application, 2023 to 2033

Figure 164: Malaysia Market Share Analysis (%), By Distribution Channel, 2023 to 2033

Figure 165: Oceania Market Share Analysis (%), By Country 2023 (E)

Figure 166: Oceania Market Share Analysis (%), By Ingredients 2023 (E)

Figure 167: Oceania Market Share Analysis (%), By Application 2023 (E)

Figure 168: Oceania Market Share Analysis (%), By Distribution Channel 2023 (E)

Figure 169: Oceania Historical Market Value (US$ Million) Analysis, 2017 to 2022

Figure 170: Oceania Current and Future Market Value (US$ Million), 2023 to 2033 & Y-o-Y Growth Trend Analysis

Figure 171: Oceania Market Attractiveness Analysis, By Country

Figure 172: Oceania Market Attractiveness Analysis, By Ingredients

Figure 173: Oceania Market Attractiveness Analysis, By Application

Figure 174: Oceania Market Attractiveness Analysis, By Distribution Channel

Figure 175: Australia Market Value Proportion Analysis, 2022

Figure 176: Global Vs Australia Y-o-Y Growth Comparison, 2023 to 2033

Figure 177: Australia Market Share Analysis (%), By Ingredients, 2023 to 2033

Figure 178: Australia Market Share Analysis (%), By Application, 2023 to 2033

Figure 179: Australia Market Share Analysis (%), By Distribution Channel, 2023 to 2033

Figure 180: New Zealand Market Value Proportion Analysis, 2022

Figure 181: Global Vs New Zealand Y-o-Y Growth Comparison, 2023 to 2033

Figure 182: New Zealand Market Share Analysis (%), By Ingredients, 2023 to 2033

Figure 183: New Zealand Market Share Analysis (%), By Application, 2023 to 2033

Figure 184: New Zealand Market Share Analysis (%), By Distribution Channel, 2023 to 2033

Figure 185: Middle East and Africa (MEA) Market Share Analysis (%), By Country 2023 (E)

Figure 186: Middle East and Africa (MEA) Market Share Analysis (%), By Ingredients 2023 (E)

Figure 187: Middle East and Africa (MEA) Market Share Analysis (%), By Application 2023 (E)

Figure 188: Middle East and Africa (MEA) Market Share Analysis (%), By Distribution Channel 2023 (E)

Figure 189: Middle East and Africa (MEA) Historical Market Value (US$ Million) Analysis, 2017 to 2022

Figure 190: Middle East and Africa (MEA) Current and Future Market Value (US$ Million), 2023 to 2033 & Y-o-Y Growth Trend Analysis

Figure 191: Middle East and Africa (MEA) Market Attractiveness Analysis, By Country

Figure 192: Middle East and Africa (MEA) Market Attractiveness Analysis, By Ingredients

Figure 193: Middle East and Africa (MEA) Market Attractiveness Analysis, By Application

Figure 194: Middle East and Africa (MEA) Market Attractiveness Analysis, By Distribution Channel

Figure 195: Türkiye Market Value Proportion Analysis, 2022

Figure 196: Global Vs Türkiye Y-o-Y Growth Comparison, 2023 to 2033

Figure 197: Türkiye Market Share Analysis (%), By Ingredients, 2023 to 2033

Figure 198: Türkiye Market Share Analysis (%), By Application, 2023 to 2033

Figure 199: Türkiye Market Share Analysis (%), By Distribution Channel, 2023 to 2033

Figure 200: GCC Countries Market Value Proportion Analysis, 2022

Figure 201: Global Vs GCC Countries Y-o-Y Growth Comparison, 2023 to 2033

Figure 202: GCC Countries Market Share Analysis (%), By Ingredients, 2023 to 2033

Figure 203: GCC Countries Market Share Analysis (%), By Application, 2023 to 2033

Figure 204: GCC Countries Market Share Analysis (%), By Distribution Channel, 2023 to 2033

Figure 205: South Africa Market Value Proportion Analysis, 2022

Figure 206: Global Vs South Africa Y-o-Y Growth Comparison, 2023 to 2033

Figure 207: South Africa Market Share Analysis (%), By Ingredients, 2023 to 2033

Figure 208: South Africa Market Share Analysis (%), By Application, 2023 to 2033

Figure 209: South Africa Market Share Analysis (%), By Distribution Channel, 2023 to 2033

Frequently Asked Questions

How Much is the Super Antioxidant Supplement Market Worth in 2023?

The global super antioxidant supplements market is worth USD 529.6 million in 2023.

What is the Sales Forecast for the Super Antioxidant Supplement Market Through 2034?

The super antioxidant supplements market is expected to reach USD 942.0 million by the end of 2034, with sales revenue expected to register a 5.4% CAGR.

What are the Key Trends Shaping the Super Antioxidant Supplement Industry?

Increasing awareness of super antioxidant supplements and the growing demand for supplements due to the increasing concerns of skin issues.

Which are the Top Five Countries Driving Demand for Super Antioxidant Supplements Products?

The United States, India, China, Germany, and the United Kingdom are the top countries driving the demand for super antioxidant supplement products.

What is the North American Market Outlook For The Super Antioxidant Supplement Market?

The North American super antioxidant supplements market registered a market share of around 27.0% in the year 2023.

At What Percentage Is the Demand for the Super Antioxidant Supplement Market Expected to Register Growth in South Asia?

The South Asian super antioxidant supplements market is expected to register a growth rate of 5.4% during the forecast period.

How Much is the India Super Antioxidant Supplement Market Worth in 2023?

The India super antioxidant supplements market is worth USD 37.5 million in 2023.

What is the Outlook of the German Super Antioxidant Supplement Market?

The German super antioxidant supplements market is experiencing a market share of 27.4% in 2022.

Who are the Key Players in the Super Antioxidant Supplement Market Sphere?

Healths Harmony, Inlife Pharma Pvt. Ltd., NOW Foods, and Bluebonnet Nutrition Corporation are the key players in the super antioxidant supplements market.

Explore Similar Insights

Future Market Insights

Super Antioxidant Supplement Market