

- Market Size (2026)
- USD 1300 Mn
- Forecast (2036)
- USD 2600 Mn
- CAGR (2026 to 2036)
- 7.2%
How big is the Sustainable Fish Oil Concentrates Market in 2026?
USD 1300 million in 2026 and USD 2600 million by 2036 at a 7.2% CAGR.
Sales of sustainable fish oil concentrates are estimated to rise at 7.2% CAGR through 2036. Valuation is projected to increase from USD 1300 million in 2026 to USD 2600 million by 2036. Concentrators are being asked to pair potency with verified raw-material origin and oxidation control. IFFO reported in May 2025 that 53% of fish oil was produced from by-products. The by-product share broadens circular raw-material options but raises segregation and batch-traceability requirements. Procurement teams therefore compare the omega-3 ingredient market across potency claims and certification evidence before approving concentrate suppliers.
United States accounts are expected to emphasize claim substantiation and softgel consistency during supplier review. Saudi Arabian importers are projected to weigh pharmacy documentation and product registration more heavily before onboarding concentrate grades. Technical evaluation then covers oxidation stability across peroxide and anisidine measures. Total oxidation control adds a separate release check for finished formulations and long distribution routes. Friend of the Sea reported in April 2025 that Arbee Aquatic achieved certification for omega-3 fish oil concentrates. The certification raises the practical value of traceable marine inputs during supplier qualification. Within the fish oil industry outlook, purchasing decisions are expected to depend on usable documentation and stable batch performance.
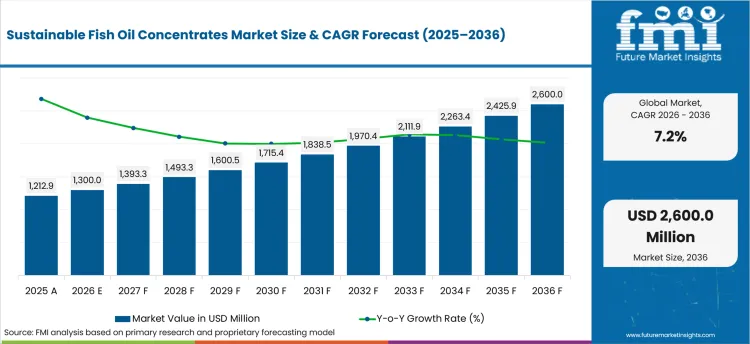
| Metric | Value |
|---|---|
| 2025 Market Size | USD 1212.9 million |
| 2026 Market Size | USD 1300 million |
| 2036 Market Size | USD 2600 million |
| Forecast CAGR (2026 to 2036) | 7.2% |
| Concentration Grade Focus | 51% to 80% EPA/DHA (43.6% share in 2026) |
| Molecular Form Focus | Re-Esterified Triglyceride (52.4% share in 2026) |
| End Use Focus | Dietary Supplements (58.7% share in 2026) |
Summary of the Sustainable Fish Oil Concentrates Market
| Market Signal | Commercial Impact |
|---|---|
| Demand and Growth Drivers | Certified sourcing is expected to shape approval because concentrate buyers need traceable marine inputs and repeatable oxidation control.
|
| Product and Segment View | Mid-range concentration grades are expected to serve broad supplement programs that balance potency with processing cost.
|
| Geography and Growth Outlook | Country growth is expected to differ according to claims rules and supplement registration practices.
|
| Competitive Landscape | Competition is expected to center on concentration breadth and batch consistency across approved marine feedstock routes.
|
| Analyst Perspective | Certification equivalence is becoming a practical procurement issue because duplicated assessments are expected to slow qualified supply expansion. Traceability must remain auditable after any streamlined recognition route.
|
Source: FMI's proprietary forecasting model and primary research
How is the Sustainable Fish Oil Concentrates Market segmented?
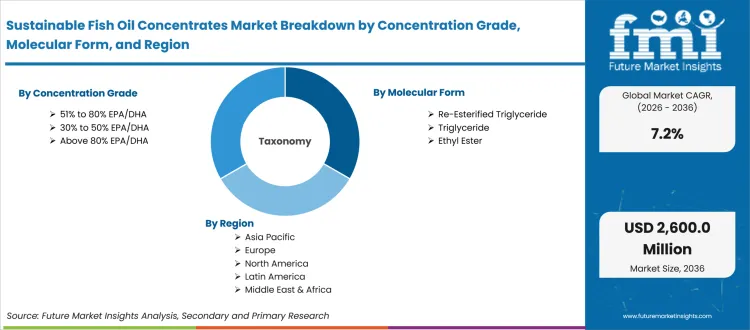
The Sustainable Fish Oil Concentrates Market is segmented by Concentration Grade, Molecular Form, Certification Type, End Use, Customer Type, and Region.
The market is segmented by concentration grade into 30% to 50% EPA/DHA, 51% to 80% EPA/DHA, and above 80% EPA/DHA. Molecular forms include triglyceride, re-esterified triglyceride, and ethyl ester. Certification coverage includes MarinTrust-linked, Friend of the Sea, MSC-linked, and internal traceability routes. End uses cover dietary supplements, pharma APIs, clinical nutrition, pet nutrition, and functional foods. Customer types include softgel manufacturers, supplement brands, pharma companies, ingredient distributors, and nutrition brands. GOED issued technical guidance in April 2025 covering three product classes across triglyceride oils and concentrate forms. Regional analysis connects this scope with the EPA and DHA ingredient analysis.
What supports use of 51% to 80% EPA/DHA within the concentration grade category?
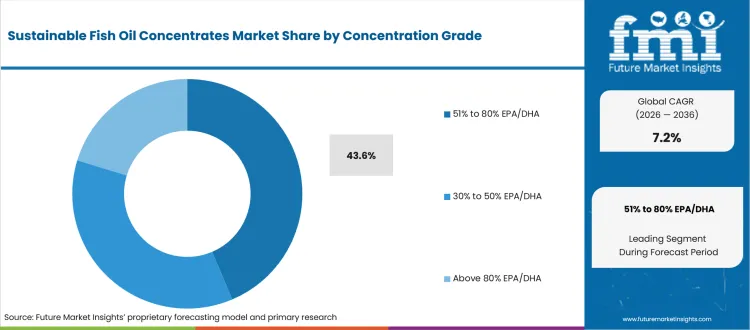
Capsule designers balance label potency against fill volume and concentrate processing cost. Friend of the Sea reported in March 2025 that HTC Health certified two omega-3 formulations with different EPA/DHA profiles. The portfolio example shows why brands evaluate concentration as a formulation choice instead of a simple purity ladder.
- By concentration grade, 51% to 80% EPA/DHA is estimated to hold 43.6% share in 2026 because the range supports label potency without forcing programs into the highest-cost purification route. Formulators use the grade across premium softgel programs and clinical nutrition products with manageable fill volumes and stable processing.
- Supplement brands are expected to use this concentration range when a smaller serving supports consumer convenience but an ultra-high assay is not required. Contract encapsulators evaluate viscosity and antioxidant systems alongside fill weight because concentrate behavior must stay predictable during storage and large commercial production runs across multiple customer labels.
How does re-esterified triglyceride shape purchasing within the molecular form category?
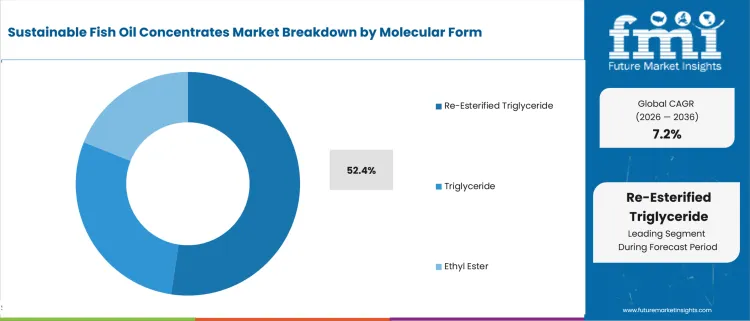
Molecular form affects processing history and finished-product positioning across supplement accounts. Epax published a June 2025 technical comparison of TG, EE, and rTG forms for omega-3 product teams. The company resource keeps form selection tied to specification needs and customer communication instead of unsupported absorption claims. Formulators therefore compare assay targets and oxidation behavior before choosing a commercial supplement format.
- In 2026, re-esterified triglyceride is projected to account for 52.4% of molecular form demand because selected premium softgel programs value a triglyceride-based concentrate story alongside high EPA/DHA density. Formulators require batch data and oxidation evidence before transferring a selected oil into commercial encapsulation and shelf-life release workflows.
- Softgel manufacturers are expected to purchase re-esterified triglyceride concentrates for wellness lines and practitioner-focused products. Their evaluation is centered on fill performance and supplier consistency because oil behavior changes are expected to alter encapsulation settings and finished-product release work. Reliable technical support therefore carries practical weight during repeat ordering decisions.
What keeps MarinTrust-linked certification relevant within the certification type category?
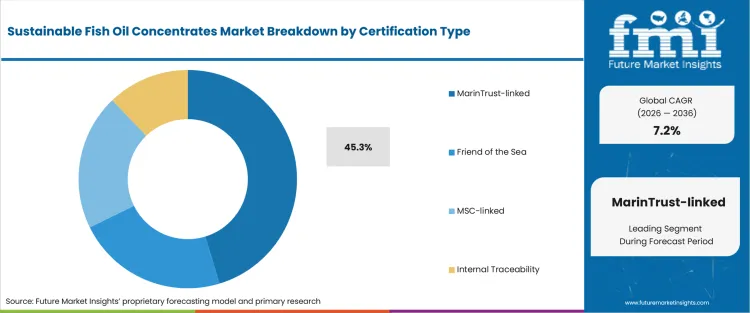
Marine ingredient certification is expected to reduce duplicated sourcing review when equivalence pathways are clearly defined. MarinTrust announced in April 2025 that selected fisheries certified to GSSI-benchmarked standards would meet its fishery assessment prerequisite from August 2025. The change is expected to streamline approved raw-material access while preserving documented assurance. Procurement teams need certificate scope and chain records that match the specific oil supplied.
- MarinTrust-linked certification is forecast to represent 45.3% share in 2026 because concentrate purchasers need a recognizable route for checking responsible raw-material sourcing. The certificate does not replace batch testing. It gives procurement teams a structured starting point for fishery review before quality staff assess oxidation records and concentrate specifications.
- Ingredient distributors and supplement brands are expected to compare certification scope against the exact facility and fishery route in their supply chain. The fishmeal and fish oil supply base remains relevant because crude oil origin affects traceability work. Clear chain records reduce follow-up questions during customer audits and renewal reviews.
What drives dietary supplement demand within the end use category?
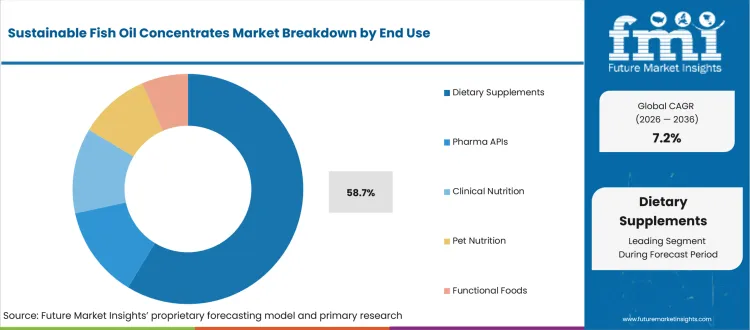
Dietary supplements translate concentrate potency into consumer-facing serving formats across softgels and liquids. The NIH Office of Dietary Supplements updated the pregnancy fact sheet in April 2025 and cited guidance calling for at least 250 mg/day of DHA plus EPA from diet or supplements. Such intake guidance keeps dose design connected to concentrate density. The commercial effect extends into dietary supplement demand where serving size influences formulation decisions.
- Dietary supplements are anticipated to represent 58.7% of end-use demand in 2026 because brands are expected to translate concentrated EPA and DHA into softgel formats. The channel supports multiple potency tiers and repeated consumer use. Product teams require substantiated claims and stable oxidation performance across the intended shelf-life period.
- Supplement brands and contract manufacturers are expected to purchase concentrates according to serving design and label positioning. High-density oils reduce capsule count for many products. Lower concentration grades remain useful when price architecture and broader access carry more weight than minimum fill volume across mainstream retail programs and pharmacy channels.
How do softgel manufacturers evaluate concentrates within the customer type category?
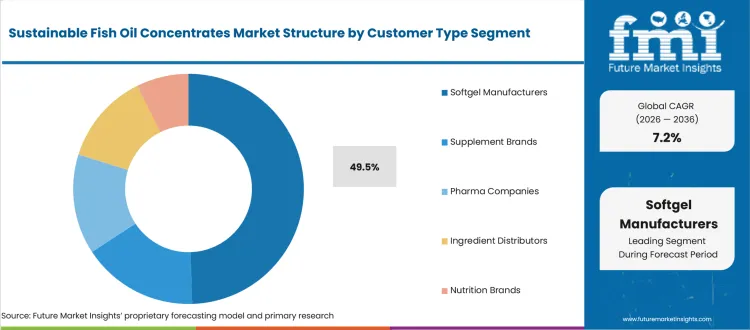
Softgel manufacturers connect bulk concentrate quality with finished-dose production and packaging schedules. KD Nutra reported in February 2026 that its Miami centre added a sixth softgel line to increase parallel processing and scheduling flexibility. The expansion illustrates why concentrate suppliers must support repeatable fill behavior across larger manufacturing networks. Similar workflow requirements influence veterinary supplement channels when omega-3 oils move into animal-health formats.
- Softgel manufacturers are projected to account for 49.5% of customer type demand in 2026 because concentrate programs require reliable encapsulation and packaging execution. These customers compare oil specifications against equipment settings and shell compatibility. Suppliers that resolve production deviations quickly are expected to receive repeat-order consideration during contract renewals.
- Contract encapsulators are expected to evaluate concentrate suppliers on batch consistency and antioxidant systems before assigning oil to customer campaigns. A late specification deviation interrupts private-label schedules. On-time release documentation is therefore valued by procurement teams alongside technical contacts that resolve formulation questions without delaying planned packaging windows.
What are the drivers, restraints, and opportunities in the Sustainable Fish Oil Concentrates Market?
Certified marine sourcing supports demand, variable fish oil availability constrains planning, and alternative omega-3 inputs widen formulation options.
- Driver: Verified marine sourcing is expected to support concentrate approval because brands need traceable feedstock records alongside potency claims.
- Restraint: Raw fish oil variability is anticipated to complicate production planning when harvest conditions reduce suitable concentrate feedstock.
- Opportunity: Hybrid marine and algal portfolios are projected to expand formulation choices across supplements and pet nutrition.
Concentrate buyers are expected to place greater weight on reliable crude-oil access and documented origin. IFFO reported in December 2025 that cumulative fish oil output through October was about 5% higher year on year across its reporting countries. The improvement supports raw-material availability but does not remove species and regional yield differences. Longer concentrate programs require procurement teams to compare the fishmeal and fish oil supply before committing to fixed-volume orders and firm delivery schedules.
Harvest volatility is anticipated to remain a planning constraint because concentrate plants depend on oils that meet quality and composition requirements. The Central Reserve Bank of Peru reported in its December 2025 Inflation Report that the second-season catch quota was reduced to 1 million metric tons. The lower quota was expected to reduce fishmeal and fish oil production. Concentrators therefore need diversified approved feedstock routes and realistic lead-time commitments before accepting fixed-volume customer programs.
Alternative omega-3 sources are projected to create portfolio opportunities without removing the need for marine concentrates. Corbion reported in its May 2025 annual report that its Nutrition business manufactures fermentation-based algae omega sources for animal nutrition. This capability gives formulators another DHA route when fish oil supply or label positioning requires flexibility. Marine concentrate suppliers are expected to respond by clarifying traceability and performance differences against algae omega alternatives for each target application.
Which country CAGRs are profiled in the Sustainable Fish Oil Concentrates Market?
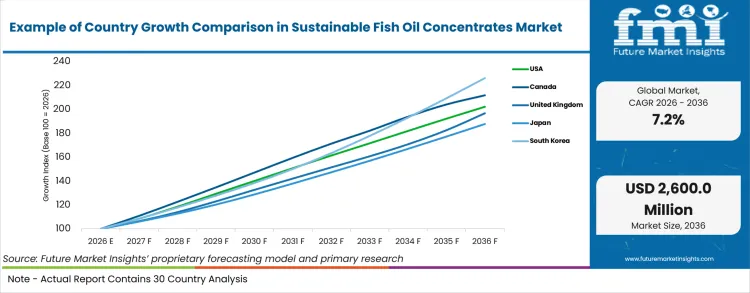
| Country | CAGR |
|---|---|
| United States | 7.3% |
| Canada | 7.8% |
| United Kingdom | 7.0% |
| Japan | 6.5% |
| South Korea | 8.5% |
| Australia | 8.2% |
| Saudi Arabia | 9.2% |
Source: FMI's proprietary forecasting model and primary research
How do country-level CAGRs compare in the Sustainable Fish Oil Concentrates Market?
Country growth is expected to reflect different approval systems and retail routes for concentrated omega-3 products. North American accounts are projected to emphasize authorized product status and substantiated labeling. Japan and South Korea are anticipated to put more weight on functional-food controls and manufacturing documentation. Australia is expected to maintain evidence-led listed medicine oversight. Saudi Arabia is projected to remain shaped by import review and pharmacy distribution. GOED reported in July 2025 that its ingredient market analysis covered 11 geographic regions. The coverage illustrates the category’s varied commercial settings. The omega-3 prescription drug landscape adds another country-specific procurement layer.
- United States supplement shelves support many omega-3 formats but regulatory review keeps claim wording central to product planning. The industry is expected to rise at 7.3% CAGR during the projected timeframe. FDA updated its ingredient directory in May 2026 and listed two qualified health claim letters for EPA and DHA topics. The directory reinforces why brands separate ingredient evidence from finished-product claims before launch. FDA remains the national regulator for dietary supplement labeling and safety communications.
- Canada combines established natural health product use with a licensing structure that makes product documentation visible during commercial review. Health Canada reported in September 2025 that 71% of Canadians had used natural health products. Canada is projected to rise at 7.8% CAGR through 2036. Marine-source essential fatty acids fall within the natural health product framework and licensed products carry an NPN or DIN-HM. Health Canada therefore remains central to market access. Brands are expected to evaluate concentrate identity and label support before finalizing formulations. Suppliers that keep authorization records organized are expected to support smoother renewal and portfolio extension work.
- United Kingdom purchasing is shaped by claims discipline across supplements sold through pharmacy and online channels. A 7.0% CAGR is estimated for the United Kingdom by 2036. The Department of Health and Social Care updated the Great Britain nutrition and health claims register in May 2026 and added one non-authorised claim. The register confirms that only authorised claims are permitted. Product teams therefore need concentrate evidence that fits permitted wording and declared composition.
- Japan places detailed attention on functional claims and manufacturing controls before concentrated omega-3 products reach broader consumer channels. The Consumer Affairs Agency described three categories of Foods with Health Claims in its April 2026 booklet. Japan is forecast to advance at 6.5% CAGR over the assessment period. CAA oversight keeps notification records and manufacturing expectations visible during product planning. Domestic nutrition brands are expected to assess supplier quality files before committing to new concentrate grades.
- South Korea has a structured health functional food sector and an active export base for specialized products. South Korea is projected to expand at 8.5% CAGR through 2036. The Ministry of Food and Drug Safety reported in May 2025 that health functional food exports increased 12.2% in 2024. Export activity raises the value of repeatable specifications because Korean manufacturers serve multiple destination requirements. MFDS remains the national regulator for health functional food controls. Local brands and contract manufacturers are expected to evaluate assay consistency and documentation speed before approving imported concentrate sources for repeated production campaigns.
- Australia combines high supplement familiarity with listed medicine controls that keep evidence and label compliance visible. The Therapeutic Goods Administration reported in December 2025 that its updated compliance database covered 19 listed medicines. The review program illustrates continuing attention to permitted claims and evidence support. Australia is anticipated to grow at 8.2% CAGR through 2036. TGA remains the national authority for listed medicine compliance. Australian sponsors are expected to compare concentrate specifications with formulation records before product release.
- Saudi Arabia routes many premium omega-3 supplements through pharmacies and import-led wellness channels. The Saudi Food and Drug Authority reported in January 2026 that a Ramadan safety campaign covered 793 establishments. Broad inspection activity keeps documentation and supply-chain control visible for imported health products. The market is expected to rise at 9.2% CAGR during the forecast period. Distributors are expected to check certificates and storage requirements before onboarding marine concentrates. Suppliers that support Arabic documentation needs and temperature-sensitive logistics are expected
Who are the notable companies in the Sustainable Fish Oil Concentrates Market?
BASF, KD Pharma Group, Epax, Golden Omega, and Arbee Group are the notable companies shaping this market.
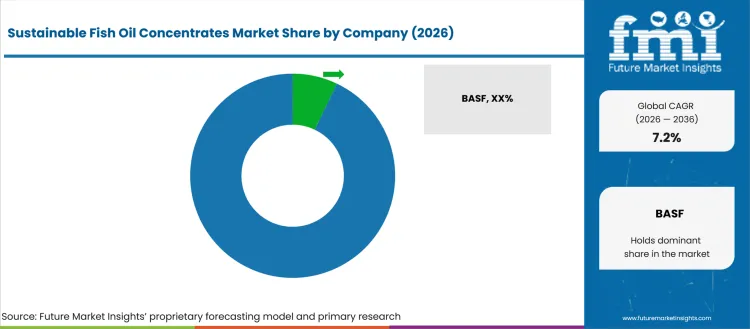
Competition is expected to center on concentrate breadth and traceable raw-material access. Purification depth has commercial weight because customers need different EPA/DHA ratios and molecular forms across supplements and clinical programs. Technical documentation is projected to influence approval speed when brands compare oxidation controls and contaminant testing. GOED launched a sustainability portal in June 2025 covering source-specific information for the global EPA and DHA category. The portal is expected to make sourcing claims easier to compare across the omega-3 fortified food outlook. Regional service remains commercially relevant when customers need rapid support during specification changes.
- BASF and KD Pharma Group compete across concentrated omega-3 supply where purification capability and technical support influence account selection. Their broader processing platforms are expected to appeal to customers that need multiple assay targets and dependable documentation across nutraceutical or pharmaceutical programs.
- Epax and Golden Omega compete through marine concentrate specialization and portfolio clarity. Both companies are expected to receive close review from supplement formulators that value traceability and application support. Their commercial differentiation depends on matching concentrate specifications with customer positioning and release requirements.
- Arbee Group connects fish oil production with refining and certified concentrate activity. Goerlich Pharma operates closer to formulation and finished-product supply. The two companies therefore address different parts of the same commercial chain. Account access depends on reliable transfer of quality information between ingredient and finished-format teams.
- dsm-firmenich provides an alternative omega-3 benchmark through algal oil technology for pet nutrition. Marine concentrate suppliers are expected to face closer substitution comparisons where customers prioritize supply diversification. Fish oil portfolios retain distinct value when traceability and EPA/DHA profiles fit the intended formulation.
Competitive Benchmarking: Sustainable Fish Oil Concentrates Market
| Company | Concentrate Breadth | Certification Fit | Softgel Workflow Support | Geographic Reach |
|---|---|---|---|---|
| BASF | High | High | Medium | Global |
| KD Pharma Group | High | High | High | Global |
| Epax | High | High | High | Global |
| Golden Omega | High | High | Medium | Global |
| Arbee Group | High | High | Medium | Regional: South Asia |
Source: Future Market Insights competitive analysis, 2026. Ratings reflect relative portfolio relevance and workflow fit. Service capability and geographic reach shape the remaining comparison.
Key Developments in the Sustainable Fish Oil Concentrates Market
- In April 2025, Epax launched EPAX Evolve 05 as a commercially available VLC-PUFA product for healthy-ageing applications. The launch extended the company’s marine lipid portfolio beyond conventional EPA and DHA concentrate positioning.
- In December 2025, KD Pharma Group signed an agreement to acquire dsm-firmenich’s distribution and supply business for food-grade oils. The transaction expanded KD Pharma’s commercial reach across food-grade omega-3 oil supply.
- In September 2025, Golden Omega participated in the launch of the Arica Capital del Omega-3 productive cluster in Chile. The initiative connected regional companies across ingredient production and related supply activities.
- In April 2026, dsm-firmenich announced Veramaris O3 Max Pure for pet nutrition. The microalgal oil was designed to provide EPA and DHA in a fish-oil-like ratio for formulation substitution.
Key Players in the Sustainable Fish Oil Concentrates Market
Concentrate manufacturers and refiners
- BASF
- KD Pharma Group
- Epax
- Golden Omega
- Arbee Group
Formulation and encapsulation partners
- Goerlich Pharma
- HTC Health
Alternative omega-3 benchmark
- dsm-firmenich
Sustainable Fish Oil Concentrates Market - Report Scope
| Coverage field | Report scope |
|---|---|
| Market breakdown | Concentration Grade, Molecular Form, Certification Type, End Use, Customer Type, and Region |
| Market Definition | Concentrated fish oils standardized for elevated EPA and DHA content with defined molecular form and sourcing documentation. |
| Regions Covered | North America, Europe, East Asia, South Asia and Pacific, Middle East and Africa, and Latin America |
| Countries Covered | United States, Canada, United Kingdom, Japan, South Korea, Australia, Saudi Arabia, and other regional markets |
| Key Companies Profiled | BASF, KD Pharma Group, Epax, Golden Omega, and Arbee Group |
| Forecast Period | 2026 to 2036 |
| Approach | Bottom-up supply assessment reconciled with customer interviews and segment demand modeling |
Source: Future Market Insights - analysis driven by proprietary forecasting models and primary research
Sustainable Fish Oil Concentrates Market - Research Methodology
| Method | Approach |
|---|---|
| Primary Research | Interviews with concentrate producers, supplement brands, contract softgel manufacturers, distributors, and technical procurement teams. |
| Desk Research | Review of government publications, regulator guidance, official industry association material, company disclosures, and product documentation. |
| Market Sizing and Forecasting | Bottom-up estimates from supplier output and customer demand are reconciled with segment adoption and country growth assumptions. |
| Data Validation | Estimates are cross-checked across supply evidence, customer feedback, historical demand patterns, and forecast consistency tests. |
Source: Future Market Insights (FMI) analysis, based on proprietary forecasting model and primary research
Sustainable Fish Oil Concentrates Market by Segments
Sustainable Fish Oil Concentrates Market segmented by Concentration Grade:
- 30% to 50% EPA/DHA
- 51% to 80% EPA/DHA
- Above 80% EPA/DHA
Sustainable Fish Oil Concentrates Market segmented by Molecular Form:
- Triglyceride
- Re-Esterified Triglyceride
- Ethyl Ester
Sustainable Fish Oil Concentrates Market segmented by Certification Type:
- MarinTrust-linked
- Friend of the Sea
- MSC-linked
- Internal Traceability
Sustainable Fish Oil Concentrates Market segmented by End Use:
- Dietary Supplements
- Pharma APIs
- Clinical Nutrition
- Pet Nutrition
- Functional Foods
Sustainable Fish Oil Concentrates Market segmented by Customer Type:
- Softgel Manufacturers
- Supplement Brands
- Pharma Companies
- Ingredient Distributors
- Nutrition Brands
Sustainable Fish Oil Concentrates Market by Region:
- North America
- United States
- Canada
- Europe
- United Kingdom
- Germany
- France
- Italy
- Spain
- East Asia
- China
- Japan
- South Korea
- South Asia and Pacific
- India
- Australia
- New Zealand
- Middle East and Africa
- Saudi Arabia
- United Arab Emirates
- South Africa
- Latin America
- Brazil
- Chile
- Mexico
Research Sources and Bibliography
- IFFO. (2025, May). Key takeaways from IFFO's 2025 Members Meeting - Day 2. IFFO.
- Friend of the Sea. (2025, April). Arbee Aquatic Sets New Standard: Certified Sustainable Omega-3 Fish Oil Concentrates Achieve Friend of the Sea Recognition. Friend of the Sea.
- Global Organization for EPA and DHA Omega-3s. (2025, April). GOED Technical Guidance Documents. GOED.
- Friend of the Sea. (2025, March). HTC Health Achieves Friend of the Sea Certification for Its Omega-3 Supplements. Friend of the Sea.
- Epax. (2025, June). TG, EE and rTG - what’s the difference? Epax.
- MarinTrust. (2025, April). GSSI and MarinTrust make life easier for marine ingredients value chains. MarinTrust.
- National Institutes of Health Office of Dietary Supplements. (2025, April). Dietary Supplements and Life Stages: Pregnancy - Health Professional Fact Sheet. National Institutes of Health.
- KD Pharma Group. (2026, February). Scaling Innovation: Miami Centre of Excellence Adds a 6th Softgels Line! KD Pharma Group.
- IFFO. (2025, December). Positive global trends in marine ingredients production reported in the first three quarters of 2025. IFFO.
- Central Reserve Bank of Peru. (2025, December). Recent trends and macroeconomic forecasts 2026-2027. Central Reserve Bank of Peru.
- Corbion. (2025, May). Corbion Annual Report 2024. Corbion.
- Global Organization for EPA and DHA Omega-3s. (2025, July). GOED Publishes 2025 Market Report Highlighting Recovery and Growth in the Global EPA and DHA Supply Chain. GOED.
- USA Food and Drug Administration. (2026, May). Information on Select Dietary Supplement Ingredients and Other Substances. USA Food and Drug Administration.
- Health Canada. (2025, September). About Natural Health Products. Government of Canada.
- Department of Health and Social Care. (2026, May). Great Britain nutrition and health claims (NHC) register. Government of the United Kingdom.
- Consumer Affairs Agency. (2026, April). Toward a Safe, Secure, and Prosperous Society. Government of Japan.
- Ministry of Food and Drug Safety. (2025, May). 2024 Food Production Performance Statistics. Ministry of Food and Drug Safety.
- Therapeutic Goods Administration. (2025, December). Listed Medicine Compliance Reports - December 2025 Update. Australian Government.
- Saudi Food and Drug Authority. (2026, January). SFDA Intensifies Inspection Campaigns Nationwide to Ensure the Safety of Commonly Consumed Products During Ramadan. Saudi Food and Drug Authority.
- Global Organization for EPA and DHA Omega-3s. (2025, June). GOED Unveils New Sustainability Portal for Omega-3 Industry. GOED.
- Epax. (2025, April). Epax launches first commercially available VLC-PUFA product. Epax.
- KD Pharma Group. (2026, January). Acquisition of the distribution and supply business for food grade oils from dsm-firmenich. KD Pharma Group.
- Golden Omega. (2025, October). Arica-based companies launch Omega-3 Cluster as a development engine for the region. Golden Omega.
- dsm-firmenich. (2026, April). dsm-firmenich launches Veramaris O3 Max Pure, a seamless fish oil replacement at Petfood Forum 2026. dsm-firmenich.
This bibliography is provided for reader reference and uses primary government sources, standards-body references, official trade bodies, and company sources.
This Report Answers
- What is the estimated market value in 2026 and the projected market value by 2036?
- What CAGR is forecast for sustainable fish oil concentrates through the assessment period?
- How is the market segmented by concentration grade and molecular form?
- Which sourcing and formulation requirements are expected to influence concentrate adoption?
- How do the profiled country CAGRs differ across regulatory and channel settings?
- Which technical and service dimensions are expected to shape supplier competition?
- How does FMI validate market sizing and forecast assumptions for this category?
- What should procurement teams review before approving a fish oil concentrate supplier?
- How do certification records and product claims affect commercial qualification decisions?
Frequently Asked Questions
What is driving growth in the Sustainable Fish Oil Concentrates Market?
Demand is being supported by supplement and nutrition brands that need higher EPA/DHA density with traceable marine sourcing. Concentrate suppliers gain relevance when they combine stable oxidation control with documentation that fits customer approval systems.
Who are the key players in the Sustainable Fish Oil Concentrates Market?
BASF, KD Pharma Group, Epax, Golden Omega, and Arbee Group are prominent participants across concentration and refining activities. Competition centers on assay breadth and traceability records alongside technical support for formulation and release work.
What is a significant restraint in the Sustainable Fish Oil Concentrates Market?
Variable fish oil availability is expected to disrupt production planning when suitable crude oils become harder to secure for specific concentrate grades. Approval cycles are expected to lengthen when substitute feedstock routes lack matching traceability records or quality histories.
Why should executives track the Sustainable Fish Oil Concentrates Market?
The category connects marine sourcing decisions with consumer supplement design and regulated nutrition programs. Executives should track how certification pathways and alternative omega-3 inputs change supply flexibility and supplier qualification requirements.
What business problem does the Sustainable Fish Oil Concentrates Market address?
The market helps formulators deliver meaningful EPA and DHA levels without relying on large volumes of standard fish oil. Concentrates support smaller serving formats while giving product teams more control over fatty-acid ratios and application positioning.
What should procurement leaders evaluate before selecting suppliers?
Procurement leaders should compare concentrate specifications and oxidation data with certificate scope and batch traceability. They should also assess delivery reliability and technical response because formulation changes are expected to affect encapsulation schedules and product release timing.
What limits return on investment for purchasers?
Returns are expected to weaken when a concentrate grade requires repeated reformulation or creates avoidable delays during documentation review. Poor batch consistency is also expected to raise testing burden and interrupt production schedules across private-label or pharmacy-focused programs.
How do suppliers build long-term account confidence?
Suppliers build account confidence by keeping concentrate quality stable and making traceability records easy to reconcile. Responsive technical support and clear change-control communication help customers manage investigations or formula updates without disrupting approved production routines.
Preview the report firsthand - request a free sample
Get SampleGet the brochure for pricing and purchase details.
Get PDFTable of Content
- Key Takeaways
- Market Size and CAGR
- Top Growth Driver
- Fastest Growing Segment
- Leading Region
- Key Companies
- Emerging Opportunities
- Executive Summary
- Global Market Outlook
- Demand-side Trends
- Supply-side Trends
- Technology Roadmap Analysis
- Analysis and Recommendations
- Analyst Perspective (What is happening? Why now? What should investors know?)
- Key Questions Answered
- How large is the market?
- What is the CAGR?
- What are key trends?
- Which region dominates?
- Who are the leaders?
- Market Overview
- Market Coverage / Taxonomy
- Market Definition / Scope / Limitations
- Research Methodology
- Chapter Orientation
- Analytical Lens and Working Hypotheses
- Market Structure, Signals, and Trend Drivers
- Benchmarking and Cross-market Comparability
- Market Sizing, Forecasting, and Opportunity Mapping
- Research Design and Evidence Framework
- Desk Research Programme (Secondary Evidence)
- Expert Input and Fieldwork (Primary Evidence)
- Tooling, Models, and Reference Databases
- Data Engineering and Model Build
- Quality Assurance and Audit Trail
- Market Background
- Market Dynamics (Drivers, Restraints, Opportunity, Trends)
- Scenario Forecast (Optimistic, Likely, Conservative)
- Impact Analysis
- AI Impact
- Sustainability Impact
- Regulatory Impact
- Technology Impact
- Consumer / Buyer Analysis
- Purchase Drivers
- Adoption Barriers
- Buyer Journey
- Opportunity Map Analysis
- Product Life Cycle Analysis
- Supply Chain Analysis
- Investment Feasibility Matrix
- Value Chain Analysis
- PESTLE and Porter's Analysis
- Regulatory Landscape
- Regional Parent Market Outlook
- Production and Consumption Statistics
- Import and Export Statistics
- Global Market Analysis and Forecast, 2021 to 2036
- Historical Market Size Value (USD Million) Analysis, 2021 to 2025
- Current and Future Market Size Value (USD Million) Projections, 2026 to 2036
- Y-o-Y Growth Trend Analysis
- Absolute $ Opportunity Analysis
- Global Market Pricing Analysis, 2021 to 2036
- Global Market Analysis and Forecast, By Concentration Grade, 2021 to 2036
- Introduction / Key Findings
- Historical Market Size Value (USD Million) Analysis By Concentration Grade, 2021 to 2025
- Current and Future Market Size Value (USD Million) Analysis and Forecast By Concentration Grade, 2026 to 2036
- 51% to 80% EPA/DHA
- 30% to 50% EPA/DHA
- Above 80% EPA/DHA
- 51% to 80% EPA/DHA
- Y-o-Y Growth Trend Analysis By Concentration Grade, 2021 to 2025
- Absolute $ Opportunity Analysis By Concentration Grade, 2026 to 2036
- Global Market Analysis and Forecast, By Molecular Form, 2021 to 2036
- Introduction / Key Findings
- Historical Market Size Value (USD Million) Analysis By Molecular Form, 2021 to 2025
- Current and Future Market Size Value (USD Million) Analysis and Forecast By Molecular Form, 2026 to 2036
- Re-Esterified Triglyceride
- Triglyceride
- Ethyl Ester
- Re-Esterified Triglyceride
- Y-o-Y Growth Trend Analysis By Molecular Form, 2021 to 2025
- Absolute $ Opportunity Analysis By Molecular Form, 2026 to 2036
- Global Market Analysis and Forecast, By Certification Type, 2021 to 2036
- Introduction / Key Findings
- Historical Market Size Value (USD Million) Analysis By Certification Type, 2021 to 2025
- Current and Future Market Size Value (USD Million) Analysis and Forecast By Certification Type, 2026 to 2036
- MarinTrust-linked
- Friend of the Sea
- MSC-linked
- Internal Traceability
- MarinTrust-linked
- Y-o-Y Growth Trend Analysis By Certification Type, 2021 to 2025
- Absolute $ Opportunity Analysis By Certification Type, 2026 to 2036
- Global Market Analysis and Forecast, By End Use, 2021 to 2036
- Introduction / Key Findings
- Historical Market Size Value (USD Million) Analysis By End Use, 2021 to 2025
- Current and Future Market Size Value (USD Million) Analysis and Forecast By End Use, 2026 to 2036
- Dietary Supplements
- Pharma APIs
- Clinical Nutrition
- Pet Nutrition
- Functional Foods
- Dietary Supplements
- Y-o-Y Growth Trend Analysis By End Use, 2021 to 2025
- Absolute $ Opportunity Analysis By End Use, 2026 to 2036
- Global Market Analysis and Forecast, By Customer Type, 2021 to 2036
- Introduction / Key Findings
- Historical Market Size Value (USD Million) Analysis By Customer Type, 2021 to 2025
- Current and Future Market Size Value (USD Million) Analysis and Forecast By Customer Type, 2026 to 2036
- Softgel Manufacturers
- Supplement Brands
- Pharma Companies
- Ingredient Distributors
- Nutrition Brands
- Softgel Manufacturers
- Y-o-Y Growth Trend Analysis By Customer Type, 2021 to 2025
- Absolute $ Opportunity Analysis By Customer Type, 2026 to 2036
- Global Market Analysis and Forecast, By Region, 2021 to 2036
- Introduction
- Historical Market Size Value (USD Million) Analysis By Region, 2021 to 2025
- Current Market Size Value (USD Million) Analysis and Forecast By Region, 2026 to 2036
- North America
- Latin America
- Western Europe
- Eastern Europe
- East Asia
- South Asia and Pacific
- Middle East & Africa
- Market Attractiveness Analysis By Region
- North America Market Analysis and Forecast, By Country, 2021 to 2036
- Historical Market Size Value (USD Million) Trend Analysis By Market Taxonomy, 2021 to 2025
- Market Size Value (USD Million) Forecast By Market Taxonomy, 2026 to 2036
- By Country
- USA
- Canada
- By Concentration Grade
- By Molecular Form
- By Certification Type
- By End Use
- By Customer Type
- By Country
- Market Attractiveness Analysis
- By Country
- By Concentration Grade
- By Molecular Form
- By Certification Type
- By End Use
- By Customer Type
- Key Takeaways
- Latin America Market Analysis and Forecast, By Country
- Historical Market Size Value (USD Million) Trend Analysis By Market Taxonomy, 2021 to 2025
- Market Size Value (USD Million) Forecast By Market Taxonomy, 2026 to 2036
- By Country
- Brazil
- Mexico
- Chile
- Rest of Latin America
- By Concentration Grade
- By Molecular Form
- By Certification Type
- By End Use
- By Customer Type
- By Country
- Market Attractiveness Analysis
- By Country
- By Concentration Grade
- By Molecular Form
- By Certification Type
- By End Use
- By Customer Type
- Key Takeaways
- Western Europe Market Analysis and Forecast, By Country
- Historical Market Size Value (USD Million) Trend Analysis By Market Taxonomy, 2021 to 2025
- Market Size Value (USD Million) Forecast By Market Taxonomy, 2026 to 2036
- By Country
- Germany
- UK
- Italy
- Spain
- France
- Nordic
- BENELUX
- Rest of Western Europe
- By Concentration Grade
- By Molecular Form
- By Certification Type
- By End Use
- By Customer Type
- By Country
- Market Attractiveness Analysis
- By Country
- By Concentration Grade
- By Molecular Form
- By Certification Type
- By End Use
- By Customer Type
- Key Takeaways
- Eastern Europe Market Analysis and Forecast, By Country
- Historical Market Size Value (USD Million) Trend Analysis By Market Taxonomy, 2021 to 2025
- Market Size Value (USD Million) Forecast By Market Taxonomy, 2026 to 2036
- By Country
- Russia
- Poland
- Hungary
- Balkan & Baltic
- Rest of Eastern Europe
- By Concentration Grade
- By Molecular Form
- By Certification Type
- By End Use
- By Customer Type
- By Country
- Market Attractiveness Analysis
- By Country
- By Concentration Grade
- By Molecular Form
- By Certification Type
- By End Use
- By Customer Type
- Key Takeaways
- East Asia Market Analysis and Forecast, By Country
- Historical Market Size Value (USD Million) Trend Analysis By Market Taxonomy, 2021 to 2025
- Market Size Value (USD Million) Forecast By Market Taxonomy, 2026 to 2036
- By Country
- China
- Japan
- South Korea
- By Concentration Grade
- By Molecular Form
- By Certification Type
- By End Use
- By Customer Type
- By Country
- Market Attractiveness Analysis
- By Country
- By Concentration Grade
- By Molecular Form
- By Certification Type
- By End Use
- By Customer Type
- Key Takeaways
- South Asia and Pacific Market Analysis and Forecast, By Country
- Historical Market Size Value (USD Million) Trend Analysis By Market Taxonomy, 2021 to 2025
- Market Size Value (USD Million) Forecast By Market Taxonomy, 2026 to 2036
- By Country
- India
- ASEAN
- Australia & New Zealand
- Rest of South Asia and Pacific
- By Concentration Grade
- By Molecular Form
- By Certification Type
- By End Use
- By Customer Type
- By Country
- Market Attractiveness Analysis
- By Country
- By Concentration Grade
- By Molecular Form
- By Certification Type
- By End Use
- By Customer Type
- Key Takeaways
- Middle East & Africa Market Analysis and Forecast, By Country
- Historical Market Size Value (USD Million) Trend Analysis By Market Taxonomy, 2021 to 2025
- Market Size Value (USD Million) Forecast By Market Taxonomy, 2026 to 2036
- By Country
- Kingdom of Saudi Arabia
- Other GCC Countries
- Türkiye
- South Africa
- Other African Union
- Rest of Middle East & Africa
- By Concentration Grade
- By Molecular Form
- By Certification Type
- By End Use
- By Customer Type
- By Country
- Market Attractiveness Analysis
- By Country
- By Concentration Grade
- By Molecular Form
- By Certification Type
- By End Use
- By Customer Type
- Key Takeaways
- Key Countries Market Analysis
- USA
- Pricing Analysis
- Market Share Analysis, 2025
- By Concentration Grade
- By Molecular Form
- By Certification Type
- By End Use
- By Customer Type
- Canada
- Pricing Analysis
- Market Share Analysis, 2025
- By Concentration Grade
- By Molecular Form
- By Certification Type
- By End Use
- By Customer Type
- Mexico
- Pricing Analysis
- Market Share Analysis, 2025
- By Concentration Grade
- By Molecular Form
- By Certification Type
- By End Use
- By Customer Type
- Brazil
- Pricing Analysis
- Market Share Analysis, 2025
- By Concentration Grade
- By Molecular Form
- By Certification Type
- By End Use
- By Customer Type
- Chile
- Pricing Analysis
- Market Share Analysis, 2025
- By Concentration Grade
- By Molecular Form
- By Certification Type
- By End Use
- By Customer Type
- Germany
- Pricing Analysis
- Market Share Analysis, 2025
- By Concentration Grade
- By Molecular Form
- By Certification Type
- By End Use
- By Customer Type
- UK
- Pricing Analysis
- Market Share Analysis, 2025
- By Concentration Grade
- By Molecular Form
- By Certification Type
- By End Use
- By Customer Type
- Italy
- Pricing Analysis
- Market Share Analysis, 2025
- By Concentration Grade
- By Molecular Form
- By Certification Type
- By End Use
- By Customer Type
- Spain
- Pricing Analysis
- Market Share Analysis, 2025
- By Concentration Grade
- By Molecular Form
- By Certification Type
- By End Use
- By Customer Type
- France
- Pricing Analysis
- Market Share Analysis, 2025
- By Concentration Grade
- By Molecular Form
- By Certification Type
- By End Use
- By Customer Type
- India
- Pricing Analysis
- Market Share Analysis, 2025
- By Concentration Grade
- By Molecular Form
- By Certification Type
- By End Use
- By Customer Type
- ASEAN
- Pricing Analysis
- Market Share Analysis, 2025
- By Concentration Grade
- By Molecular Form
- By Certification Type
- By End Use
- By Customer Type
- Australia & New Zealand
- Pricing Analysis
- Market Share Analysis, 2025
- By Concentration Grade
- By Molecular Form
- By Certification Type
- By End Use
- By Customer Type
- China
- Pricing Analysis
- Market Share Analysis, 2025
- By Concentration Grade
- By Molecular Form
- By Certification Type
- By End Use
- By Customer Type
- Japan
- Pricing Analysis
- Market Share Analysis, 2025
- By Concentration Grade
- By Molecular Form
- By Certification Type
- By End Use
- By Customer Type
- South Korea
- Pricing Analysis
- Market Share Analysis, 2025
- By Concentration Grade
- By Molecular Form
- By Certification Type
- By End Use
- By Customer Type
- Russia
- Pricing Analysis
- Market Share Analysis, 2025
- By Concentration Grade
- By Molecular Form
- By Certification Type
- By End Use
- By Customer Type
- Poland
- Pricing Analysis
- Market Share Analysis, 2025
- By Concentration Grade
- By Molecular Form
- By Certification Type
- By End Use
- By Customer Type
- Hungary
- Pricing Analysis
- Market Share Analysis, 2025
- By Concentration Grade
- By Molecular Form
- By Certification Type
- By End Use
- By Customer Type
- Kingdom of Saudi Arabia
- Pricing Analysis
- Market Share Analysis, 2025
- By Concentration Grade
- By Molecular Form
- By Certification Type
- By End Use
- By Customer Type
- Türkiye
- Pricing Analysis
- Market Share Analysis, 2025
- By Concentration Grade
- By Molecular Form
- By Certification Type
- By End Use
- By Customer Type
- South Africa
- Pricing Analysis
- Market Share Analysis, 2025
- By Concentration Grade
- By Molecular Form
- By Certification Type
- By End Use
- By Customer Type
- USA
- Market Structure Analysis
- Competition Dashboard
- Competition Benchmarking
- Market Share Analysis of Top Players
- By Regional
- By Concentration Grade
- By Molecular Form
- By Certification Type
- By End Use
- By Customer Type
- Emerging Startups
- Innovation Benchmarking
- Competition Analysis
- Competition Deep Dive
- BASF
- Overview
- Product Portfolio
- Profitability by Market Segments
- Sales Footprint
- Strategy Overview
- Marketing Strategy
- Product Strategy
- Channel Strategy
- KD Pharma Group
- Epax
- Golden Omega
- Arbee Group
- BASF
- Case Studies
- Success Stories
- Recent Developments
- Competition Deep Dive
- Assumptions & Acronyms Used


