

- Market Size (2026)
- USD 245.2 Bn
- Forecast (2036)
- USD 447.5 Bn
- CAGR (2026 to 2036)
- 6.2%
How big is Technical Textiles Market in 2026?
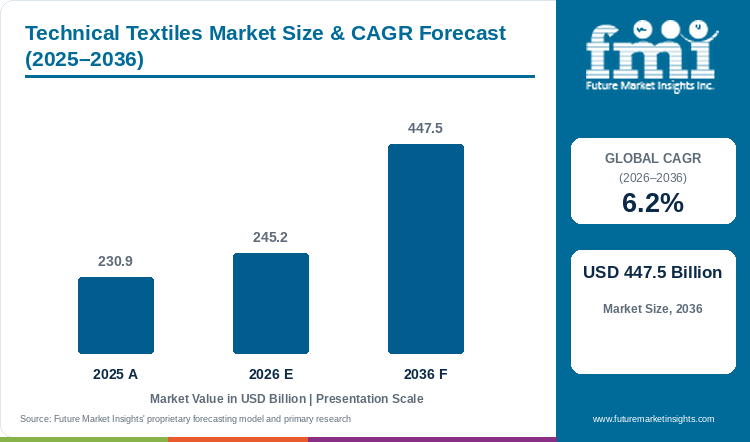
A CAGR of 6.2% between 2026 and 2036 moves technical textiles from USD 245.2 billion (2026, estimated) to USD 447.5 billion (2036, projected). In 2025 the base stood at USD 230.9 billion.
Technical textile sales are estimated at USD 245.2 billion in 2026, up from USD 230.9 billion in 2025. On FMI figures, the market will record a 6.2% CAGR from 2026 to 2036 and reach USD 447.5 billion by 2036.
Geogrids for road and slope work form one product group inside technical textiles, and the reinforcement geosynthetics market is forecast at a 10.7% CAGR from 2026 to 2036. A 4.5-point lead over technical textiles means mills with geogrid lines will book road orders first.
The government approved 52 new applications under Round III of the PLI Scheme for Textiles, 18 of them for technical textiles, Textile Excellence reported on 16 April 2026.[1] The ₹6,708 crore that applicants committed is igniting the next phase of business growth, as funded lines add nonwoven, coated and composite output.[1] Nonwoven routes take 45% of 2026 process sales.
However, smaller converters will face qualification costs and testing delays, and plain grades will meet low-cost Asian imports. Mills with tested geotextile and protective grades will hold longer public contracts.
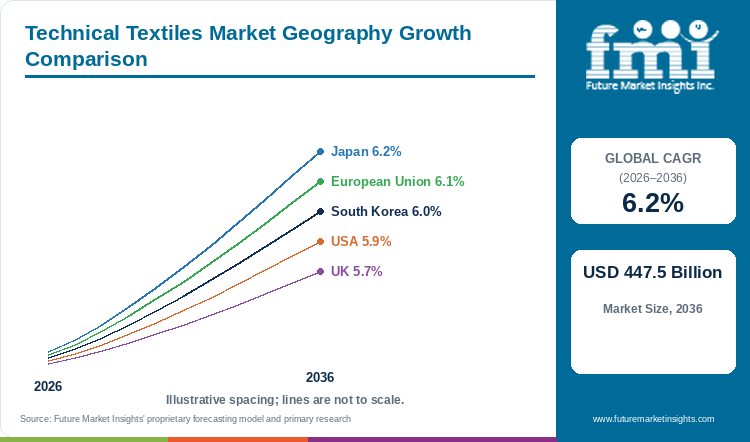
Japanese sales match the global 6.2% CAGR, the top profiled rate, and the UK closes the table at 5.7%. Mobiltech holds 25% of 2026 application sales. Glass and carbon fabrics are the upstream input for vehicle panels in the automotive composites market, which posts a 12.3% CAGR across 2026 to 2036, so vehicle makers will stay the largest buyer group for technical textiles.
Key Market Trends & Insights
- Application: Mobiltech held 25% of 2026 sales. Packtech accounted for 37.5% of Indian technical textile exports in FY 2024-25, with Indutech at 28%.[2]
- Process: nonwoven routes took 45% of 2026 sales, ahead of composites at an estimated 33.6%.
- End use: the automotive industry led at an estimated 22.8%, with construction second.
- Deployment: smart textiles held about 9.4% (estimated). Indian mission grants funded smart textile research among 79 sanctioned projects.[3]
Regional Highlights
- Japan matches the 6.2% global CAGR, the highest rate among profiled countries.
- Next on CAGR come the European Union at 6.1%, South Korea at 6.0% and the USA at 5.9%. The UK closes the table on a 5.7% CAGR.
- Indian technical textile exports reached USD 2.92 billion in FY 2024-25, per Ministry of Textiles data carried by Textile World.[2]
Market Size & Forecast
Table 1: Market Size and Forecast for the Technical Textiles Market (USD billion and percentage), 2025 to 2036
| Metric | Value |
|---|---|
| 2025 Market Size | USD 230.9 billion |
| Estimated Market Size in 2026 | USD 245.2 billion |
| Projected Market Size by 2036 | USD 447.5 billion |
| CAGR, 2026 to 2036 | 6.2% |
| Added Revenue, 2026 to 2036 | USD 202.3 billion |
| Market Expansion Multiple | 1.8x |
Polyester fiber and nonwoven fabrics feed technical textile mills. Upstream, mills buy base fibre from the polyester fiber market. For roll goods, converters draw on the nonwoven fabrics market. Engineered grades for vehicles, roads and protective kit will carry the 6.2% technical textiles CAGR from 2026 to 2036. Mills will therefore pay more for specialty fibre and web inputs than for commodity polyester fiber.
Mission Grants, PLI Rounds and Public Tenders in Indian Technical Textiles
India runs a dedicated state programme for this sector. The Ministry of Textiles has approved 168 projects under the National Technical Textiles Mission, KNN India reported on 6 December 2025.[3] Rs 1,480 crore was set aside for the mission at launch in 2020.[3] Research grants worth Rs 247 crore went to 79 projects in specialty fibres, geotextiles, agro-textiles and smart textiles.[3] Approved work spans advanced fibres and composites for defence and healthcare, plus geotextiles for railways and erosion control.[3] PLI participants reported investment of ₹944.48 crore and exports of ₹363.55 crore across three quarters of FY 2025-26.[1] NTTM research grants will move specialty fibres, geotextiles and smart textiles from lab trials into tender specifications.
Defence and rural road budgets turn new PLI-funded mill lines in India into purchase orders. Defence protective textiles make up about 10-12% of the Indian technical textiles ecosystem, Textile Excellence reported on 28 July 2026.[4] Domestic defence production hit a record ₹1.78 lakh crore in FY2025-26, the same report noted.[4] On rural roads, coir and jute geotextiles went into over 5,000 km of PMGSY roads in Kerala and Tamil Nadu, Indian Infrastructure reported in March 2026.[5] Audits found 40-50% compliance with the hill road geosynthetics mandate on the Char Dham and Zojila Tunnel projects.[5] FMI links infrastructure investment to growth in technical textiles. Tighter enforcement of the hill road geosynthetics mandate will add Geotech volume on Char Dham and other hill road projects.
Table 2: Programme and Procurement Indicators for the Technical Textiles Market (counts, INR and percentage), mixed reporting years from 2020 to 2026
| Indicator | Data Point | Relevance | Source |
|---|---|---|---|
| NTTM projects approved, December 2025 | 168 | Breadth of state-backed technical textile work in India. | [3] |
| NTTM outlay, mission launched 2020 | Rs 1,480 crore | Size of the mission budget. | [3] |
| NTTM research projects sanctioned | 79 projects worth Rs 247 crore | Grants for specialty fibres, geotextiles, agro and smart textiles. | [3] |
| PLI Round III approvals, April 2026 | 52 applications, 18 in technical textiles | New incentive-backed capacity. | [1] |
| PLI Round III committed investment | ₹6,708 crore | Capital lined up for MMF and technical textile lines. | [1] |
| Defence protective textiles in Indian technical textiles | About 10-12% | Weight of Protech procurement. | [4] |
| Domestic defence production, FY2025-26 | ₹1.78 lakh crore | Budget pool behind protective kit orders. | [4] |
| PMGSY roads with coir and jute geotextiles | Over 5,000 km in Kerala and Tamil Nadu | Rural road procurement of natural-fibre Geotech. | [5] |
Analyst Perspective
“Road, defence and hospital buyers now write technical textile specifications into public tenders, and I see certified geotextile and protective fabric capacity as the clearest opportunity of the decade. Mills that secure test approvals early in India, Japan and the European Union will hold the long-run supply contracts as Geotech and Protech volumes scale.”
- Nikhil Kaitwade, Principal Consultant, Future Market Insights.
How is the technical textiles market segmented?
Four product axes and region divide the technical textiles market. Mobiltech ranks first among applications on 25%, and nonwoven ranks first among processes on 45%.
By application: Mobiltech, Agrotech, Buildtech, Hometech, Indutech, Sportech, Packtech, Meditech, Clothtech, Geotech, Protech, and Oekotech.
By process: nonwoven, composites, and others.
By end use: construction, agriculture, healthcare, automotive, industrial, packaging, sports, environmental.
By deployment: conventional textiles and smart textiles.
By region: Middle East and Africa, South Asia and Pacific, East Asia, Western Europe, Eastern Europe, Latin America and North America.
Why does Mobiltech lead technical textile applications?
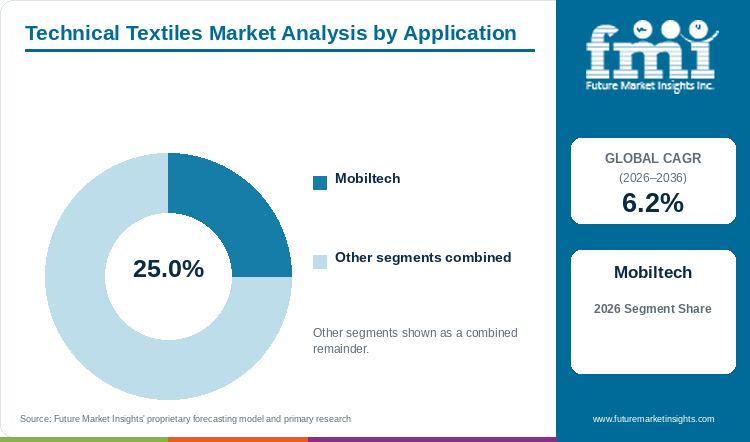
A 25% portion of 2026 application sales puts Mobiltech first among twelve groups.
Table 3: Application Share for the Technical Textiles Market (percentage share), 2026
| Application | Estimated Share (2026) |
|---|---|
| Mobiltech | 25% |
| Indutech | 13.4% |
| Packtech | 11.8% |
| Buildtech | 9.6% |
| Hometech | 8.2% |
| Meditech | 7.5% |
| Protech | 6.1% |
| Clothtech | 5.3% |
| Agrotech | 4.7% |
| Geotech | 3.6% |
| Sportech | 3.1% |
| Oekotech | 1.7% |
| Total | 100.0% |
Table 4: Application Leadership and Market Growth for the Technical Textiles Market (segment and CAGR percentage), 2026 to 2036
| Metric | Value |
|---|---|
| Global CAGR (2026 to 2036) | 6.2% |
| Leading Segment | Mobiltech |
One vehicle draws on seat fabric, airbag cloth, filter media and insulation at once, and that spread of parts gives Mobiltech the widest volume base among application groups. In the FMI split, Mobiltech takes 25% of application sales. Indutech ranks next at an estimated 13.4%, and Packtech holds about 11.8%. Composite vehicle panels use woven reinforcement as a base layer, and the automotive composites market that buys the reinforcement posts a 12.3% CAGR from 2026 to 2036, about double the 6.2% technical textiles CAGR. Lighter composite panels and battery insulation will therefore keep Mobiltech ahead through 2036. Indutech will gain on filtration and conveyor fabrics.
- Packtech led Indian technical textile exports with 37.5% in FY 2024-25, ahead of Indutech at 28%.[2]
- Geotech will grow from a 3.6% share as road agencies tighten hill road geosynthetics rules.
Why do nonwovens lead the technical textiles process split?
Nonwoven processes take 45% of 2026 sales, with composites and other routes sharing the balance.
Table 5: Process Share for the Technical Textiles Market (percentage share), 2026
| Process | Estimated Share (2026) |
|---|---|
| Nonwoven | 45% |
| Composites | 33.6% |
| Others | 21.4% |
| Total | 100.0% |
Ahlstrom reported 2025 net sales of EUR 2,930 million on 26 February 2026 and named Filtration and Life Sciences and Protective Materials among three Core divisions.[6] Filter and protective grades draw heavily on nonwoven lines, and that customer spread gives nonwovens a wider base than composites. FMI data show nonwovens at 45% of process sales. Composites hold second place on an estimated 33.6%. Other processes make up about 21.4%. Fast nonwoven lines will keep a cost edge over woven and knitted routes through 2036. Composites will grow fastest in vehicle and wind blade parts.
- Ahlstrom said in February 2026 that the pulp mill and two older paper machines at Mosinee, Wisconsin, will close.[6]
- Composite fabrics will gain from lighter vehicle and aerospace parts.
Why does the automotive industry lead end-use demand?
The automotive industry takes an estimated 22.8% of end-use demand in 2026, ahead of construction and the industrial sector.
Table 6: End Use Share for the Technical Textiles Market (percentage share), 2026
| End Use | Estimated Share (2026) |
|---|---|
| Automotive Industry | 22.8% |
| Construction Industry | 17.4% |
| Industrial Sector | 16.2% |
| Healthcare Industry | 12.5% |
| Packaging Industry | 11.7% |
| Agriculture Industry | 7.9% |
| Sports Industry | 6.3% |
| Environmental Sector | 5.2% |
| Total | 100.0% |
Carmakers buy technical fabrics for cabins, safety systems and engine bays on every model line, and orders on every model line put the automotive industry first among end uses. Automotive buyers take an estimated 22.8% of end-use demand in 2026. Construction ranks second, estimated at 17.4%, and the industrial sector follows near 16.2%. Healthcare claims about 12.5% (estimated). Kimberly-Clark agreed in November 2025 to acquire Kenvue at an enterprise value of about $48.7 billion.[7] A combined Kimberly-Clark and Kenvue group will pull larger volumes of wipes, wound care and hygiene nonwovens. FMI ties end-use growth to infrastructure investment and lighter automotive components. Construction will gain ground as road and housing budgets grow in South Asia.
- Healthcare demand, about 12.5% of end use, will track hospital tenders and hygiene product volumes.
- The combined Kimberly-Clark and Kenvue group projects about $32 billion in 2025 annual net revenues.[7]
Why do conventional textiles dominate deployment?
Conventional textiles account for an estimated 90.6% of deployment sales in 2026, and smart textiles take about 9.4%.
Table 7: Deployment Share for the Technical Textiles Market (percentage share), 2026
| Deployment | Estimated Share (2026) |
|---|---|
| Conventional Textiles | 90.6% |
| Smart Textiles | 9.4% |
| Total | 100.0% |
Smart textiles carry sensors, conductive yarns or heating elements, and those parts add cost that road, packaging and hygiene buyers avoid. Conventional grades hold an estimated 90.6% of deployment sales because plain fabrics carry no sensor or heating-element cost. Smart grades take about 9.4% (estimated). NTTM-backed projects in India include wearable electronics and solar fabrics, KNN India reported in December 2025.[3] Smart grades will grow in defence uniforms and patient monitoring. Conventional fabrics will keep the volume base in geotextiles, packaging and filters.
- Price premiums on conductive yarns will hold smart textiles to high-value orders.
- Wash durability will decide repeat orders for sensor fabrics.
What are the drivers, restraints, and opportunities in the technical textiles market?
Demand for technical textiles grows with state incentive schemes, infrastructure budgets and lighter vehicle parts. Key challenges faced by manufacturers include certification costs and slow mandate compliance, and sales potential lies in defence and Geotech procurement.
- Driver: PLI Round III approvals and NTTM grants add specialty capacity in India.
- Restraint: Geosynthetics carry a 20-30% material cost premium over traditional aggregates.[5]
- Opportunity: Protective fabrics for defence stores and geotextiles for hill roads.
Incentive Rounds Bring New Capacity to Indian Mills
PLI incentives lower the investment risk of new technical textile lines in India. Round III PLI approvals split into 5 MMF apparel, 19 MMF fabric, 18 technical textile and 10 multi-segment applications, Textile Excellence reported in April 2026.[1] Seventeen newly approved companies committed Rs 2,374 crore in investments, according to an IANS report dated 20 November 2025.[8] Lines from the 18 technical textile approvals will cut Indian import reliance for nonwoven and coated grades. FMI counts regulatory support for quality and environmental standards among the drivers.
Cost Premiums and Thin Training Slow Geosynthetic Adoption
Geosynthetics cost 20-30% above traditional aggregates, Indian Infrastructure reported in March 2026.[5] Key challenges faced by manufacturers include price gaps against traditional materials. Only 10-15% of engineers hold training in geosynthetics, the same article noted.[5] Errors appeared in 25% of hill road projects.[5] Maharashtra and Gujarat account for 80% of production.[5] Long haul routes from Maharashtra and Gujarat will raise delivered cost at Himalayan sites. Reinforcement geosynthetics still grow at a 10.7% CAGR from 2026 to 2036, so suppliers that train site engineers will turn the 20-30% price gap into repeat road orders.
Protective Fabrics and Hill-Road Geotech Open Public Contracts
DMSRDE, a DRDO laboratory, signed an MoU with UPTTI Kanpur to jointly develop next-generation textile technologies for defence and civilian use, Textile Excellence reported in July 2026.[4] The pact is expected to strengthen capabilities in protective clothing, ballistic materials and specialised fabrics.[4] Sales potential is expected to emerge from protective clothing and ballistic fabric programmes. The Uttar Pradesh Defence Industrial Corridor holds investment proposals worth ₹35,526.76 crore across six nodes.[4] Ballistic fabric programmes in India buy yarn from the aramid fiber market. Ballistic and flame-resistant grades will take a growing part of aramid fiber volume in India.
Which country CAGRs are profiled in the technical textiles market?
Table 8: Country CAGR Comparison for the Technical Textiles Market (CAGR percentage), 2026 to 2036
| Country | CAGR |
|---|---|
| Japan | 6.2% |
| European Union | 6.1% |
| South Korea | 6.0% |
| USA | 5.9% |
| UK | 5.7% |
How do country-level CAGRs compare in the technical textiles market?
Country CAGRs in the profiled set bunch inside a narrow band of 5.7% to 6.2%. Japan tops the table on a 6.2% CAGR from 2026 to 2036, equal to the global rate. As per FMI, the European Union comes next on a 6.1% CAGR, and South Korea posts 6.0%. American demand advances on a 5.9% CAGR, and the UK is lowest at 5.7%. Vehicle buyers in Japan and South Korea and defence buyers in the USA are shaping the outlook, and mature buyer bases in all five countries will tie growth to product upgrades.
- Japan pairs a large vehicle base with high-specification fibre makers.
- The European Union combines strict product standards with a broad filtration and hygiene base.
- South Korea links growth to vehicle, battery and electronics supply chains.
- The USA grows on defence, medical and infrastructure buyers.
- The UK posts the lowest profiled rate and buys specialty grades from India and Europe.
Full report country CAGRs cover: Over 30 countries spread across Eastern Europe, Latin America, North America, East Asia, Middle East and Africa, Western Europe, and South Asia and Pacific.
Country-wise Analysis
Japan Technical Textiles Market Outlook (2026 to 2036)
Vehicle and electronics makers will stay the core buyers in Japan, ordering seat fabrics, filters and separator films in large lots. Japanese sales post a 6.2% CAGR from 2026 to 2036, the quickest of the five profiled countries. An ageing population will raise purchases of medical and hygiene nonwovens. Domestic fibre makers will move output toward high-margin grades and export more to Southeast Asia.
Key takeaway: Japan matches the global pace, and medical nonwovens for older patients will add a second growth line beside Mobiltech.
European Union Technical Textiles Market Outlook (2026 to 2036)
Freudenberg reported 2025 group sales of €11,731.9 million, down 1.8%, on 30 March 2026.[9] The group invested €142.9 million in Germany during the year.[9] High energy costs will keep pressure on European nonwoven margins. Sales across the European Union record a 6.1% CAGR from 2026 to 2036 on filtration, hygiene and building products that meet strict standards.
Key takeaway: EU sales will reward producers that cut energy cost per tonne and certify filtration and building grades early.
South Korea Technical Textiles Market Outlook (2026 to 2036)
Export exposure to vehicle and battery programmes in the USA and Europe leaves South Korean orders open to tariff and trade shifts. Korean sales will record a 6.0% CAGR during the forecast period. Korean fibre makers will feed airbag yarn, tyre cord and separator materials to domestic carmakers and battery plants. Defence modernisation will add orders for protective fabrics.
Key takeaway: Supply contracts with domestic carmakers and battery plants will decide whether Korea reaches the 6.0% CAGR.
USA Technical Textiles Market Outlook (2026 to 2036)
DuPont said on 1 April 2026 that the divestiture of the Aramids business to Arclin was complete, at a value of about $1.8 billion.[10] The Kevlar and Nomex brands moved with the sale, and the DuPont stake in Arclin is expected to represent about 16%.[10] US sales post a 5.9% CAGR between 2026 and 2036. Federal defence and hospital buyers will keep domestic sourcing rules central to supplier choice.
Key takeaway: Ownership changes in aramid assets will reshape US supply, and protective-wear buyers will audit continuity of Kevlar and Nomex grades.
UK Technical Textiles Market Outlook (2026 to 2036)
Indian technical textile exports to the UK reached USD 136 million in FY 2024-25, a 4.7% share, Textile World reported.[2] Ahlstrom has started a consultation on a possible closure of the Radcliffe site.[6] Indian imports and the Radcliffe closure consultation point to a thinner UK production base. The UK grows slowest of the five, with a 5.7% CAGR from 2026 to 2036. UK healthcare and defence buyers will place the steadiest orders.
Key takeaway: UK buyers will lean on imports for volume grades and keep local supply for defence and medical work.
Who are the notable companies in the technical textiles market?
Five companies anchor the technical textiles market, namely DuPont de Nemours, Inc., Freudenberg Performance Materials, 3M Company, Ahlstrom-Munksjö Oyj and Kimberly-Clark Corporation.
Reach scores split the five companies into a global band and a regional band. FMI rates DuPont and Freudenberg high on product portfolio and manufacturing, with strong distribution and global reach. 3M scores high on manufacturing and medium on portfolio, with regional reach. Ahlstrom-Munksjö and Kimberly-Clark score medium on portfolio and manufacturing and serve buyers regionally.
Four of the five companies changed portfolios in 2025 and 2026. DuPont sold the Aramids business to Arclin in April 2026 and took pre-tax cash proceeds of about $1.2 billion.[10] Ahlstrom sold the non-core Abrasives business and set up a Performance Material Cluster.[6] Kimberly-Clark agreed to buy Kenvue, with closing expected in the second half of 2026.[7] Freudenberg spent about €800 million on acquisitions in 2025, including Fuji Seiko in medical technology.[9]
- High portfolio and global reach: DuPont de Nemours, Inc. and Freudenberg Performance Materials.
- High manufacturing with regional reach: 3M Company.
- Medium portfolio with regional reach: Ahlstrom-Munksjö Oyj and Kimberly-Clark Corporation.
Competitive Benchmarking: Technical Textiles Market
Table 9: Competitive Benchmarking for the Technical Textiles Market (qualitative capability ratings), 2026
| Company | Product Portfolio | Manufacturing | Distribution | Reach |
|---|---|---|---|---|
| DuPont de Nemours, Inc. | High | High | Strong | Global |
| Freudenberg Performance Materials | High | High | Strong | Global |
| 3M Company | Medium | High | Moderate | Regional |
| Ahlstrom-Munksjö Oyj | Medium | Medium | Moderate | Regional |
| Kimberly-Clark Corporation | Medium | Medium | Moderate | Regional |
Ratings of High, Medium, Strong, Moderate, Global and Regional cover portfolio, plant scale, distribution and reach.
Key Developments in the Technical Textiles Market
- In July 2026, DMSRDE and UPTTI Kanpur signed an MoU to develop textile technologies for defence and civilian use.[4]
- In April 2026, the government approved 52 new applications under Round III of the PLI Scheme for Textiles.[1]
- In April 2026, DuPont completed the divestiture of the Aramids business to Arclin.[10]
- In March 2026, Freudenberg reported 2025 sales of €11,731.9 million.[9]
- In February 2026, Ahlstrom published financial statements for 2025 and announced right-sizing at Mosinee.[6]
- In December 2025, KNN India reported 168 projects approved under the National Technical Textiles Mission.[3]
- In November 2025, Kimberly-Clark announced an agreement to acquire Kenvue.[7]
Key Players in the Technical Textiles Market
High Portfolio, Global Reach
- DuPont de Nemours, Inc.
- Freudenberg Performance Materials
High Manufacturing, Regional Reach
- 3M Company
Medium Portfolio, Regional Reach
- Ahlstrom-Munksjö Oyj
- Kimberly-Clark Corporation
Technical Textiles Market - Report Scope
Table 10: Report Scope for the Technical Textiles Market (coverage fields and definitions), 2026 to 2036
| Coverage field | Report scope |
|---|---|
| Market breakdown | Application; process; end use; deployment; region |
| Quantitative units | USD billion |
| Market definition | Technical textiles market covering engineered fabrics and nonwovens made for function, across twelve application groups from Mobiltech to Oekotech. |
| Regions covered | North America; Latin America; Western Europe; Eastern Europe; East Asia; South Asia and Pacific; Middle East and Africa |
| Countries covered | Japan; European Union; South Korea; USA; UK |
| Key companies profiled | DuPont de Nemours, Inc., Freudenberg Performance Materials, 3M Company, Ahlstrom-Munksjö Oyj, Kimberly-Clark Corporation |
| Forecast period | 2026 to 2036 |
Technical Textiles Market - Research Methodology
Table 11: Research Methodology for the Technical Textiles Market (research methods and approach), 2026 edition
| Method | Approach |
|---|---|
| Data Sources | Ministry releases, parliamentary replies, company results and trade press from May 2025 onward support the programme and company facts. |
| Desk Research | Desk work tracked mission grants, PLI rounds, defence textile programmes, geosynthetics rules and company portfolio moves. |
| Market Sizing and Forecasting | Sizing starts from the 2025 base of USD 230.9 billion and the 6.2% CAGR from 2026 to 2036. |
| Data Validation | Scheme figures were matched across ministry statements and trade press reports of the same round. |
Technical Textiles Market by Segments
Technical Textiles Market segmented by Application:
- Mobiltech
- Agrotech
- Buildtech
- Hometech
- Indutech
- Sportech
- Packtech
- Meditech
- Clothtech
- Geotech
- Protech
- Oekotech
Technical Textiles Market segmented by Process:
- Nonwoven
- Composites
- Others
Technical Textiles Market segmented by End Use:
- Construction Industry
- Agriculture Industry
- Healthcare Industry
- Automotive Industry
- Industrial Sector
- Packaging Industry
- Sports Industry
- Environmental Sector
Technical Textiles Market segmented by Deployment:
- Conventional Textiles
- Smart Textiles
Technical Textiles Market by Region
- North America
- Latin America
- Western Europe
- Eastern Europe
- East Asia
- South Asia and Pacific
- Middle East and Africa
Research Sources and Bibliography
- [1] Textile Excellence. (2026, April 16). 52 new applications approved under PLI scheme for textiles. https://textileexcellence.com/single-news/6885/52-new-applications-approved-under-pli-scheme-for-textiles
- [2] Textile World. (2025, November 13). Techtextil India 2025: Weaving India's Journey Toward Global Functional Textile Leadership. https://www.textileworld.com/textile-world/nonwovens-technical-textiles/2025/11/techtextil-india-2025-weaving-indias-journey-toward-global-functional-textile-leadership/
- [3] KNN India. (2025, December 6). National Technical Textiles Mission advances with new projects, startup funding boost. https://knnindia.co.in/news/newsdetails/sectors/textilegarmentshandicraft/national-technical-textiles-mission-advances-with-new-projects-startup-funding-boost
- [4] Textile Excellence. (2026, July 28). DRDO MoU with Uttar Pradesh Textile Tech Institute signals big push for defence textiles. https://textileexcellence.com/single-news/7094/drdo-mou-with-uttar-pradesh-textile-tech-institute-signals-big-push-for-defence-textiles
- [5] Indian Infrastructure. (2026, March 6). Material of Choice: Growing uptake of geosynthetics in infrastructure projects. https://indianinfrastructure.com/2026/03/06/material-of-choice-growing-uptake-of-geosynthetics-in-infrastructure-projects/
- [6] Ahlstrom. (2026, February 26). Ahlstrom financial statements 2025 published and strategic updates announced. https://www.ahlstrom.com/Media/releases/press-releases2/2026/ahlstrom-financial-statements-2025-published-and-strategic-updates-announced/
- [7] Kimberly-Clark Corporation (Form 8-K, Exhibit 99.1). (2025, November 3). Kimberly-Clark to acquire Kenvue. https://www.sec.gov/Archives/edgar/data/55785/000110465925105220/tm2530027d1_ex99-1.htm
- [8] IANS. (2025, November 20). India's exports surge in man-made fibre, technical textiles sectors. https://ianslive.in/indias-exports-surge-in-man-made-fibre-technical-textiles-sectors--20251120092341
- [9] Freudenberg Group. (2026, March 30). Freudenberg presents financials for 2025. https://freudenberg.com/en/company/press-media/news-detail/freudenberg-presents-financials-for-2025
- [10] DuPont de Nemours, Inc. (2026, April 1). DuPont Completes Divestiture of Aramids Business. https://www.dupont.com/news/dupont-completes-divestiture-of-aramids-business.html
This bibliography is provided for reader reference. The full report contains the complete reference list and detailed citations.
This Report Answers
- What will technical textile sales total in 2026 and 2036?
- What CAGR will the market post from 2026 to 2036?
- Which application group will hold the largest share?
- Which process will carry the most sales?
- Which profiled country will grow fastest?
- Which companies will shape supply through 2036?
Frequently Asked Questions
What is the size of the technical textiles market in 2026?
Around USD 245.2 billion of sales will land in 2026, and FMI sees USD 447.5 billion for 2036. At what rate will the technical textiles market grow? Infrastructure, vehicle and protective fabric orders will hold the CAGR at 6.2% across 2026 to 2036.
Which application will lead in 2026?
Mobiltech will hold 25% of application sales, with Indutech and Packtech next. Will nonwovens stay ahead of composites? Yes. A 45% process share in 2026 will keep nonwovens first, and composites will grow fastest in lighter vehicle parts.
Which country will post the fastest growth?
Japan, per FMI, will post the top country rate of 6.2%, level with the global CAGR.
Which companies will matter most?
Five names will shape competition through 2036, namely DuPont, Freudenberg Performance Materials, 3M, Ahlstrom-Munksjö and Kimberly-Clark.
Preview the report firsthand - request a free sample
Get SampleGet the brochure for pricing and purchase details.
Get PDFTable of Content
- Key Takeaways
- Market Size and CAGR
- Top Growth Driver
- Fastest Growing Segment
- Leading Region
- Key Companies
- Emerging Opportunities
- Executive Summary
- Global Market Outlook
- Demand-side Trends
- Supply-side Trends
- Technology Roadmap Analysis
- Analysis and Recommendations
- Analyst Perspective (What is happening? Why now? What should investors know?)
- Key Questions Answered
- How large is the market?
- What is the CAGR?
- What are key trends?
- Which region dominates?
- Who are the leaders?
- Market Overview
- Market Coverage / Taxonomy
- Market Definition / Scope / Limitations
- Research Methodology
- Chapter Orientation
- Analytical Lens and Working Hypotheses
- Market Structure, Signals, and Trend Drivers
- Benchmarking and Cross-market Comparability
- Market Sizing, Forecasting, and Opportunity Mapping
- Research Design and Evidence Framework
- Desk Research Programme (Secondary Evidence)
- Expert Input and Fieldwork (Primary Evidence)
- Tooling, Models, and Reference Databases
- Data Engineering and Model Build
- Quality Assurance and Audit Trail
- Market Background
- Market Dynamics (Drivers, Restraints, Opportunity, Trends)
- Scenario Forecast (Optimistic, Likely, Conservative)
- Impact Analysis
- AI Impact
- Sustainability Impact
- Regulatory Impact
- Technology Impact
- Consumer / Buyer Analysis
- Purchase Drivers
- Adoption Barriers
- Buyer Journey
- Opportunity Map Analysis
- Product Life Cycle Analysis
- Supply Chain Analysis
- Investment Feasibility Matrix
- Value Chain Analysis
- PESTLE and Porter's Analysis
- Regulatory Landscape
- Regional Parent Market Outlook
- Production and Consumption Statistics
- Import and Export Statistics
- Global Market Analysis and Forecast, 2021 to 2036
- Historical Market Size Value (USD Billion) Analysis, 2021 to 2025
- Current and Future Market Size Value (USD Billion) Projections, 2026 to 2036
- Y-o-Y Growth Trend Analysis
- Absolute $ Opportunity Analysis
- Global Market Pricing Analysis, 2021 to 2036
- Global Market Analysis and Forecast, By Application, 2021 to 2036
- Introduction / Key Findings
- Historical Market Size Value (USD Billion) Analysis By Application, 2021 to 2025
- Current and Future Market Size Value (USD Billion) Analysis and Forecast By Application, 2026 to 2036
- Mobiltech
- Agrotech
- Buildtech
- Hometech
- Indutech
- Sportech
- Packtech
- Meditech
- Clothtech
- Geotech
- Protech
- Oekotech
- Y-o-Y Growth Trend Analysis By Application, 2021 to 2025
- Absolute $ Opportunity Analysis By Application, 2026 to 2036
- Global Market Analysis and Forecast, By Process, 2021 to 2036
- Introduction / Key Findings
- Historical Market Size Value (USD Billion) Analysis By Process, 2021 to 2025
- Current and Future Market Size Value (USD Billion) Analysis and Forecast By Process, 2026 to 2036
- Nonwoven
- Composites
- Others
- Y-o-Y Growth Trend Analysis By Process, 2021 to 2025
- Absolute $ Opportunity Analysis By Process, 2026 to 2036
- Global Market Analysis and Forecast, By End Use, 2021 to 2036
- Introduction / Key Findings
- Historical Market Size Value (USD Billion) Analysis By End Use, 2021 to 2025
- Current and Future Market Size Value (USD Billion) Analysis and Forecast By End Use, 2026 to 2036
- Construction Industry
- Agriculture Industry
- Healthcare Industry
- Automotive Industry
- Industrial Sector
- Packaging Industry
- Sports Industry
- Environmental Sector
- Y-o-Y Growth Trend Analysis By End Use, 2021 to 2025
- Absolute $ Opportunity Analysis By End Use, 2026 to 2036
- Global Market Analysis and Forecast, By Deployment, 2021 to 2036
- Introduction / Key Findings
- Historical Market Size Value (USD Billion) Analysis By Deployment, 2021 to 2025
- Current and Future Market Size Value (USD Billion) Analysis and Forecast By Deployment, 2026 to 2036
- Conventional Textiles
- Smart Textiles
- Y-o-Y Growth Trend Analysis By Deployment, 2021 to 2025
- Absolute $ Opportunity Analysis By Deployment, 2026 to 2036
- Global Market Analysis and Forecast, By Region, 2021 to 2036
- Introduction
- Historical Market Size Value (USD Billion) Analysis By Region, 2021 to 2025
- Current Market Size Value (USD Billion) Analysis and Forecast By Region, 2026 to 2036
- North America
- Latin America
- Western Europe
- Eastern Europe
- East Asia
- South Asia and Pacific
- Middle East and Africa
- Market Attractiveness Analysis By Region
- North America Market Analysis and Forecast, By Country, 2021 to 2036
- Historical Market Size Value (USD Billion) Trend Analysis By Market Taxonomy, 2021 to 2025
- Market Size Value (USD Billion) Forecast By Market Taxonomy, 2026 to 2036
- By Country
- By Application
- By Process
- By End Use
- By Deployment
- Market Attractiveness Analysis
- By Country
- By Application
- By Process
- By End Use
- By Deployment
- Key Takeaways
- Latin America Market Analysis and Forecast, By Country
- Historical Market Size Value (USD Billion) Trend Analysis By Market Taxonomy, 2021 to 2025
- Market Size Value (USD Billion) Forecast By Market Taxonomy, 2026 to 2036
- By Country
- By Application
- By Process
- By End Use
- By Deployment
- Market Attractiveness Analysis
- By Country
- By Application
- By Process
- By End Use
- By Deployment
- Key Takeaways
- Western Europe Market Analysis and Forecast, By Country
- Historical Market Size Value (USD Billion) Trend Analysis By Market Taxonomy, 2021 to 2025
- Market Size Value (USD Billion) Forecast By Market Taxonomy, 2026 to 2036
- By Country
- By Application
- By Process
- By End Use
- By Deployment
- Market Attractiveness Analysis
- By Country
- By Application
- By Process
- By End Use
- By Deployment
- Key Takeaways
- Eastern Europe Market Analysis and Forecast, By Country
- Historical Market Size Value (USD Billion) Trend Analysis By Market Taxonomy, 2021 to 2025
- Market Size Value (USD Billion) Forecast By Market Taxonomy, 2026 to 2036
- By Country
- By Application
- By Process
- By End Use
- By Deployment
- Market Attractiveness Analysis
- By Country
- By Application
- By Process
- By End Use
- By Deployment
- Key Takeaways
- East Asia Market Analysis and Forecast, By Country
- Historical Market Size Value (USD Billion) Trend Analysis By Market Taxonomy, 2021 to 2025
- Market Size Value (USD Billion) Forecast By Market Taxonomy, 2026 to 2036
- By Country
- By Application
- By Process
- By End Use
- By Deployment
- Market Attractiveness Analysis
- By Country
- By Application
- By Process
- By End Use
- By Deployment
- Key Takeaways
- South Asia and Pacific Market Analysis and Forecast, By Country
- Historical Market Size Value (USD Billion) Trend Analysis By Market Taxonomy, 2021 to 2025
- Market Size Value (USD Billion) Forecast By Market Taxonomy, 2026 to 2036
- By Country
- By Application
- By Process
- By End Use
- By Deployment
- Market Attractiveness Analysis
- By Country
- By Application
- By Process
- By End Use
- By Deployment
- Key Takeaways
- Middle East and Africa Market Analysis and Forecast, By Country
- Historical Market Size Value (USD Billion) Trend Analysis By Market Taxonomy, 2021 to 2025
- Market Size Value (USD Billion) Forecast By Market Taxonomy, 2026 to 2036
- By Country
- By Application
- By Process
- By End Use
- By Deployment
- Market Attractiveness Analysis
- By Country
- By Application
- By Process
- By End Use
- By Deployment
- Key Takeaways
- Key Countries Market Analysis
- Japan
- Pricing Analysis
- Market Share Analysis, 2025
- By Application
- By Process
- By End Use
- By Deployment
- European Union
- Pricing Analysis
- Market Share Analysis, 2025
- By Application
- By Process
- By End Use
- By Deployment
- South Korea
- Pricing Analysis
- Market Share Analysis, 2025
- By Application
- By Process
- By End Use
- By Deployment
- USA
- Pricing Analysis
- Market Share Analysis, 2025
- By Application
- By Process
- By End Use
- By Deployment
- UK
- Pricing Analysis
- Market Share Analysis, 2025
- By Application
- By Process
- By End Use
- By Deployment
- Japan
- Market Structure Analysis
- Competition Dashboard
- Competition Benchmarking
- Market Share Analysis of Top Players
- By Regional
- By Application
- By Process
- By End Use
- By Deployment
- Emerging Startups
- Innovation Benchmarking
- Competition Analysis
- Competition Deep Dive
- DuPont de Nemours, Inc.
- Overview
- Product Portfolio
- Profitability by Market Segments
- Sales Footprint
- Strategy Overview
- Marketing Strategy
- Product Strategy
- Channel Strategy
- Freudenberg Performance Materials
- 3M Company
- Ahlstrom-Munksjö Oyj
- Kimberly-Clark Corporation
- DuPont de Nemours, Inc.
- Case Studies
- Success Stories
- Recent Developments
- Competition Deep Dive
- Assumptions & Acronyms Used


