The Tendonitis Treatment Market is estimated to be valued at USD 227.7 billion in 2025 and is projected to reach USD 340.2 billion by 2035, registering a compound annual growth rate (CAGR) of 4.1% over the forecast period.
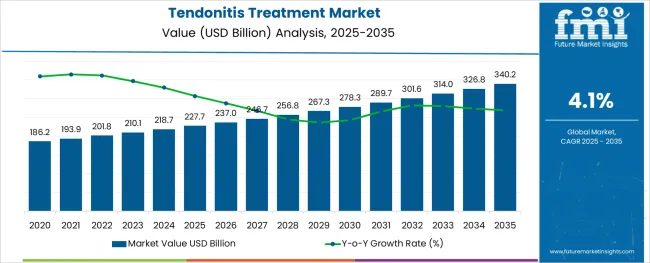
The tendonitis treatment market is progressing steadily as the prevalence of repetitive strain injuries, aging populations, and increasing participation in sports activities continue to rise globally. Heightened awareness about musculoskeletal health and improved access to specialized care have fueled demand for effective treatments.
Medical professionals are prioritizing non-invasive and evidence-based approaches, which has shifted focus toward therapies that offer sustained relief and functional recovery. The future outlook is expected to be shaped by advancements in regenerative medicine, wider acceptance of physical rehabilitation protocols, and integration of digital health tools to monitor patient progress.
Evolving clinical guidelines favoring early intervention and multidisciplinary management are paving the way for further innovations and broader adoption of treatment modalities.
The market is segmented by Treatment Type and Condition and region. By Treatment Type, the market is divided into Therapy and Surgery. In terms of Condition, the market is classified into Tennis Elbow, Golfer’s Elbow, Pitcher’s Elbow, Jumper’s Knee, Swimmer’s Shoulder, and Achilles Tendonitis. Regionally, the market is classified into North America, Latin America, Western Europe, Eastern Europe, Balkan & Baltic Countries, Russia & Belarus, Central Asia, East Asia, South Asia & Pacific, and the Middle East & Africa.
The market is segmented by Treatment Type and Condition and region. By Treatment Type, the market is divided into Therapy and Surgery. In terms of Condition, the market is classified into Tennis Elbow, Golfer’s Elbow, Pitcher’s Elbow, Jumper’s Knee, Swimmer’s Shoulder, and Achilles Tendonitis. Regionally, the market is classified into North America, Latin America, Western Europe, Eastern Europe, Balkan & Baltic Countries, Russia & Belarus, Central Asia, East Asia, South Asia & Pacific, and the Middle East & Africa.
tendonitis-treatment-market-analysis-by-treatment-type
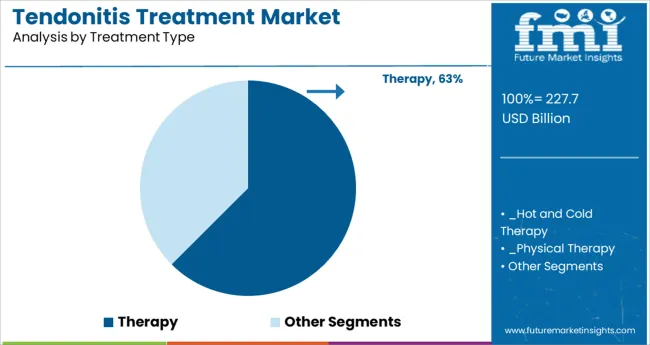
When segmented by treatment type, therapy is projected to command 62.5% of the total market revenue in 2025, establishing itself as the leading segment. This leadership has been supported by the growing clinical preference for non-surgical and conservative interventions that minimize risks and promote long-term recovery.
Therapy, encompassing physical rehabilitation, ultrasound, and manual techniques, has been widely adopted due to its ability to address underlying biomechanical issues, enhance mobility, and reduce pain without pharmacological side effects. The accessibility of therapy services and increasing integration into workplace wellness programs have reinforced its prominence.
Continuous innovation in therapeutic equipment and protocols has further enhanced outcomes, solidifying therapy as the cornerstone of tendonitis management across diverse patient populations.
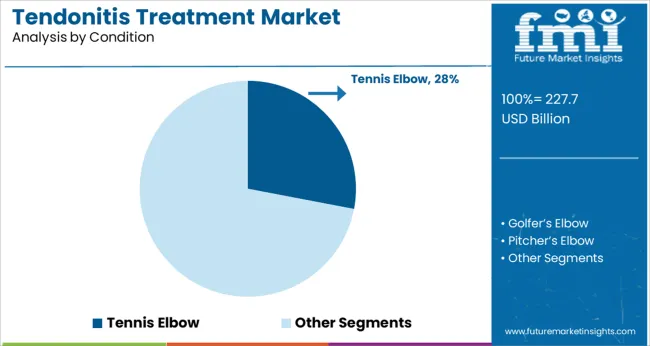
Segmented by condition, tennis elbow is anticipated to account for 28.0% of the market revenue in 2025, maintaining its position as the dominant condition segment. This prominence has been driven by its high incidence among both athletes and individuals engaged in repetitive manual activities, making it one of the most commonly diagnosed forms of tendonitis.
Clinical observations indicate that tennis elbow often requires a multidisciplinary approach, blending targeted therapy with ergonomic modifications and preventive education. The visibility of this condition in public health discussions and its association with occupational health concerns have led to increased screening and earlier intervention.
Enhanced patient awareness and the availability of specialized treatment programs tailored to tennis elbow have strengthened its share within the overall market, affirming its role as a critical focus area in tendonitis care.
As per the Tendonitis Treatment Market research by Future Market Insights - a market research and competitive intelligence provider, historically, from 2020 to 2024, the market value of the Tendonitis Treatment Market increased at around 3.8% CAGR.
Following the COVID-19 epidemic, the medical community altered existing treatment for tendonitis. Athletic injury-related costs and general companies fell due to lockdowns, severe travel restrictions, and a high infection load in medical care.
The 2024 coronavirus outbreak kept the treatment of tendonitis by doctors to a minimum, as fewer people could undergo the treatment. The popularity of day-to-day sports activities declined, and injuries in Achilles tendons did not increase as fast as expected. As a result, the tendonitis market faced less demand for treatment.
The market's growth may be boosted in the years ahead owing to increased acceptance of continual technological innovation, as more Americans suffer from geriatric diseases and people’s growing participation in sports. However, insufficient knowledge of this illness and rising treatment choices may have a negative effect on the market. Owing to these factors, Tendonitis Treatment Market is projected to grow at a CAGR of 4.1% over the coming 10 years.
The leading cause of soft tissue injuries worldwide and a major impact-rendering driver for the market is the rising incidence of sports-related injuries as a result of the rapid increase in sports activities. Furthermore, increasing career opportunities and a growing desire for fitness have increased the number of people who choose sports as a career or a hobby. As a result, their chances of getting hurt are expected to rise.
Furthermore, as various treatment options such as physical therapy, over-the-counter pain relievers, and various surgical procedures have become more widely available, the number of people seeking treatment has increased, assisting market growth. Physical therapy has emerged as the first-line treatment for tendonitis, as eccentric strengthening has been shown to be an effective treatment for a variety of chronic tendon conditions.
Clinical grafts currently used in tendon treatment have a number of limitations, and there is a high demand for alternative engineered tissue. As a result, innovative strategies such as tendon replacement and regeneration are in high demand to maintain market growth.
North America accounts for the highest expected market share during the forecast period. Because of the presence of major players and higher spending on healthcare advancements in the region, the market in North America is expected to dominate the global market.
People in North America are becoming more aware of the disease than in other parts of the world. North America is expected to dominate the global market due to well-established healthcare facilities and a growing geriatric population, as well as an increase in the number of orthopedic procedures.
Furthermore, the aging population pool, as well as improvements in healthcare and medical infrastructure, are expected to aid Asia Pacific's remarkable growth in the near future. Due to an increase in the number of tendonitis surgeries performed in the region, as well as rising disposable income.
The market in the region has significant growth opportunities due to the increasing penetration of local medical device manufacturers and a growing population suffering from tendonitis. Furthermore, ongoing research in this field, increasing products in the pipeline for tendonitis treatment, particularly in China and Japan, as well as an increasing number of sports-related injuries, are further driving the market.
The USA Tendonitis Treatment Market Analysis
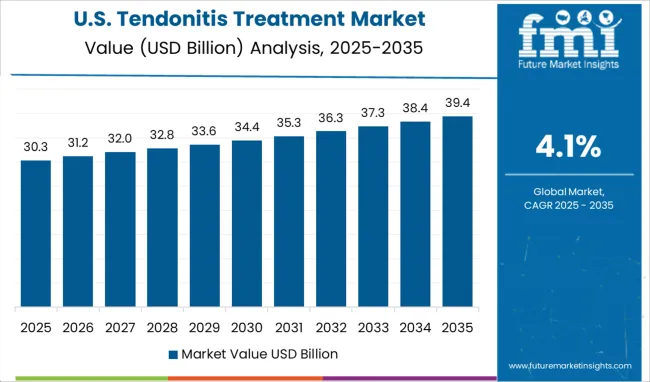
The United States is expected to account for the highest market of USD 36.8 billion by the end of 2035. This is attributable to a significant increase in research & development activities. Furthermore, advances in the healthcare industry have resulted in the development of new technologies and equipment, which is expected to boost the market in the United States even further.
Furthermore, the presence of well-known corporations, as well as early access to new and developing technology, is projected to aid the United States in maintaining its global market supremacy in the next years.
China Tendonitis Treatment Market Analysis
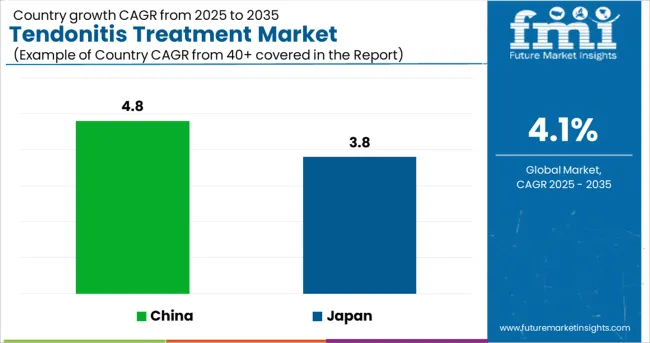
China will dominate the Asia Pacific market from 2025 to 2035, with a CAGR of 4.8%, approaching a market revenue of USD 340.2 million by 2035. During the forecast period, the market is expected to witness an absolute dollar opportunity of USD 36 million.
Japan Tendonitis Treatment Market Analysis
The market in Japan on other hand is expected to register a CAGR of 3.8% approaching the market revenue of USD 30.2 million by 2035. Because of the developing healthcare infrastructure and the adoption of advanced technologies, the region is expected to account for lucrative market growth. Furthermore, rising disposable income and improved access to organized healthcare in developing countries like India and China are expected to boost the regional market over the forecast period.
The therapy treatment segment dominated the market in 2024, accounting for the most revenue with a 3.9% CAGR. It is due to the patients' growing preference for non-invasive therapies over surgical procedures for tendonitis treatment.
Physical therapy had the largest market share in the therapy segment, owing to the fact that it is the first line of treatment. In addition, other types of therapy, such as hot and cold therapy and shockwave therapy, have seen significant increases in demand in recent years.
Surgery is considered the last resort for tendonitis treatment when severe damage to tendons cannot be treated with pharmacological treatments. During the first 48 hours after an injury, however, cold therapy, including cold compresses, is usually effective. Tendonitis treatment options vary depending on the type of indication. Achilles tendonitis is the most common type of tendonitis, and the Achilles tendon is the largest tendon in the human body.
On basis of condition, because of the rising prevalence of Achilles tendonitis among athletes and sports players, the Achilles tendonitis segment dominated the market in 2024. Achilles tendonitis can be treated with both conservative and surgical procedures, depending on whether the condition is acute or chronic.
The surgical treatment procedure is highly recommended by specialists in the case of individuals who have a full rupture. During the forecast period, the rising prevalence of tendonitis due to an increase in sports and occupational work injuries is expected to generate significant sales opportunities in the global market. Golfer's elbow, tennis elbow, jumper's knee, pitcher's elbow, Achilles tendonitis, and swimmer's shoulder are some of the health issues for which tendonitis treatment is used.
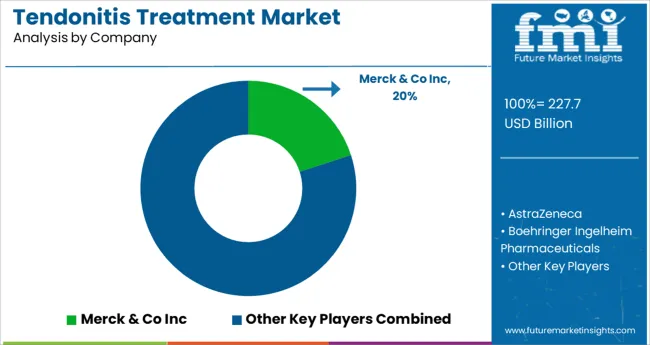
The market for tendonitis treatment is being driven by a large number of well-established and small domestic and international players. To expand their product portfolio and reach, the majority of companies are forming multiple partnerships, mergers, and acquisitions.
Merck and Co Inc, AstraZeneca, Boehringer Ingelheim Pharmaceuticals, Abbott, and Pfizer are some of the most well-known companies in the tendonitis treatment market. Major market players use a variety of methods to preserve their dominance, including high Research and Development (R&D) activity, global expansion strategies, broad product offers, and frequent introduction of advanced versions of existing items.
Some of the recent developments of key Tendonitis Treatment providers are as follows:
Similarly, the team at Future Market Insights has tracked recent developments related to companies offering Tendonitis Treatment, which is available in the full report.
The global tendonitis treatment market is estimated to be valued at USD 227.7 billion in 2025.
It is projected to reach USD 340.2 billion by 2035.
The market is expected to grow at a 4.1% CAGR between 2025 and 2035.
The key product types are therapy, _hot and cold therapy, _physical therapy, _shockwave therapy and surgery.
tennis elbow segment is expected to dominate with a 28.0% industry share in 2025.


Our Research Products

The "Full Research Suite" delivers actionable market intel, deep dives on markets or technologies, so clients act faster, cut risk, and unlock growth.

The Leaderboard benchmarks and ranks top vendors, classifying them as Established Leaders, Leading Challengers, or Disruptors & Challengers.

Locates where complements amplify value and substitutes erode it, forecasting net impact by horizon

We deliver granular, decision-grade intel: market sizing, 5-year forecasts, pricing, adoption, usage, revenue, and operational KPIs—plus competitor tracking, regulation, and value chains—across 60 countries broadly.

Spot the shifts before they hit your P&L. We track inflection points, adoption curves, pricing moves, and ecosystem plays to show where demand is heading, why it is changing, and what to do next across high-growth markets and disruptive tech

Real-time reads of user behavior. We track shifting priorities, perceptions of today’s and next-gen services, and provider experience, then pace how fast tech moves from trial to adoption, blending buyer, consumer, and channel inputs with social signals (#WhySwitch, #UX).

Partner with our analyst team to build a custom report designed around your business priorities. From analysing market trends to assessing competitors or crafting bespoke datasets, we tailor insights to your needs.
Supplier Intelligence
Discovery & Profiling
Capacity & Footprint
Performance & Risk
Compliance & Governance
Commercial Readiness
Who Supplies Whom
Scorecards & Shortlists
Playbooks & Docs
Category Intelligence
Definition & Scope
Demand & Use Cases
Cost Drivers
Market Structure
Supply Chain Map
Trade & Policy
Operating Norms
Deliverables
Buyer Intelligence
Account Basics
Spend & Scope
Procurement Model
Vendor Requirements
Terms & Policies
Entry Strategy
Pain Points & Triggers
Outputs
Pricing Analysis
Benchmarks
Trends
Should-Cost
Indexation
Landed Cost
Commercial Terms
Deliverables
Brand Analysis
Positioning & Value Prop
Share & Presence
Customer Evidence
Go-to-Market
Digital & Reputation
Compliance & Trust
KPIs & Gaps
Outputs
Full Research Suite comprises of:
Market outlook & trends analysis
Interviews & case studies
Strategic recommendations
Vendor profiles & capabilities analysis
5-year forecasts
8 regions and 60+ country-level data splits
Market segment data splits
12 months of continuous data updates
DELIVERED AS:
PDF EXCEL ONLINE
Treatment-Resistant Hypertension Management Market Size and Share Forecast Outlook 2025 to 2035
Treatment-Resistant Depression Treatment Market Size and Share Forecast Outlook 2025 to 2035
Treatment Pumps Market Insights Growth & Demand Forecast 2025 to 2035
Pretreatment Coatings Market Size and Share Forecast Outlook 2025 to 2035
Air Treatment Ozone Generator Market Size and Share Forecast Outlook 2025 to 2035
CNS Treatment and Therapy Market Insights - Trends & Growth Forecast 2025 to 2035
Seed Treatment Materials Market Size and Share Forecast Outlook 2025 to 2035
Acne Treatment Solutions Market Size and Share Forecast Outlook 2025 to 2035
Scar Treatment Market Overview - Growth & Demand Forecast 2025 to 2035
Soil Treatment Chemicals Market
Water Treatment System Market Size and Share Forecast Outlook 2025 to 2035
Water Treatment Chemical Market Size and Share Forecast Outlook 2025 to 2035
Algae Treatment Chemical Market Forecast and Outlook 2025 to 2035
Water Treatment Market Size and Share Forecast Outlook 2025 to 2035
Water Treatment Ozone Generator Market Size and Share Forecast Outlook 2025 to 2035
Water Treatment Equipment Market Size and Share Forecast Outlook 2025 to 2035
Burns Treatment Market Overview – Growth, Demand & Forecast 2025 to 2035
CRBSI Treatment Market Insights - Growth, Trends & Forecast 2025 to 2035
Water Treatment Polymers Market Growth & Demand 2025 to 2035
Asthma Treatment Market Forecast and Outlook 2025 to 2035

Thank you!
You will receive an email from our Business Development Manager. Please be sure to check your SPAM/JUNK folder too.
Chat With
MaRIA