Tomato Pomace Powder Market Size and Share Forecast Outlook 2025 to 2035

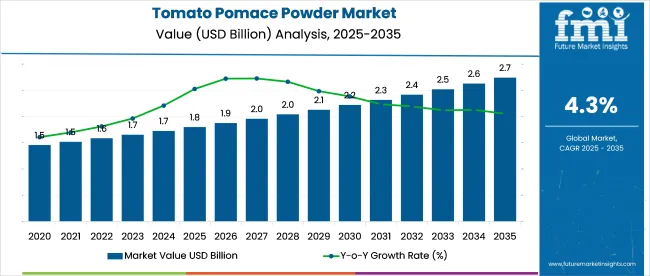
The tomato pomace powder market is estimated at USD 1.8 billion in 2025 and is forecast to attain USD 2.7 billion by 2035, expanding at a CAGR of 4.3%.
Quick Stats of the Tomato Pomace Powder Market

  • Tomato Pomace Powder Market Size (2025): USD 1.8 billion
  • Tomato Pomace Powder Market Value (2035): USD 2.7 billion
  • Forecast CAGR of Tomato Pomace Powder Market (2025 to 2035): 4.3%
  • Leading Segment in the Tomato Pomace Powder Market: Powder Form (55%)
  • Key Growth Region of the Tomato Pomace Powder Market: Asia Pacific (India)
  • Key Players in the Tomato Pomace Powder Market: DMH Ingredients, Drytech Processes, Givaudan (Naturex), Ambe NS Agro Products, Harmony House Foods

Tomato Pomace Powder Market Market Value Analysis

Metric Value
Industry Size (2025E) USD 1.8 billion
Industry Value (2035F) USD 2.7 billion
CAGR (2025 to 2035) 4.3%

This trajectory is being driven by demand for fiber-rich fruit pomace derivatives in bakery, snack, and beverage formulations, as tomato by-products are being favored for cost-effective nutritional enhancement. Powdered tomato pomace is being praised for its high dietary-fiber content and ease of incorporation into extruded snacks and cereals. It is argued that differentiation will depend on flavored blends and clean-label positioning. It is suggested that inconsistent processing infrastructure and variable raw-material supply may restrain expansion unless traceability systems and supply consolidation are prioritized.

In March 2025, Native Extracts partnered with Kagome Australia to launch Red Velvet Oil™, a premium skincare ingredient derived from upcycled tomato seeds-a byproduct of large-scale tomato processing. The initiative aimed to repurpose tomato pomace into high-value botanical oil for clean beauty applications. The launch marked a significant step in Australia's emerging upcycled ingredient economy.

Highlighting the broader impact, Lisa Carroll, Founder and Managing Director of Native Extracts, stated, “This partnership showcases Australia’s most ambitious upcycled ingredient initiative... and the power of upcycling waste into high-value ingredients, giving ethical brands new options to meet the demands of the growing conscious consumer culture.

Red Velvet Oil™ is more than a beauty ingredient; it's a statement of how the Reduce, Reuse & Repurpose sustainability movement and science can come together to create real change and innovation. This signifies the birth of Australia’s upcycled ingredient revolution... and there is more to come.”

The Tomato Pomace Powder Market holds a specialized share within its parent markets. In the fruit and vegetable processing market, it accounts for approximately 3-5%, as tomato pomace is a byproduct in tomato processing. Within the food ingredients market, its share is around 2-3%, as it is used in food products like sauces, soups, and snacks.

In the animal feed market, the share is about 1-2%, as tomato pomace powder is used as a supplement for animal nutrition. In the natural and organic products market, the share is approximately 4-6%, driven by its natural composition. In the bio-based products market, its share is around 2-3%, as a sustainable, plant-based ingredient.

Analyzing Tomato Pomace Powder Market by Top Investment Segments

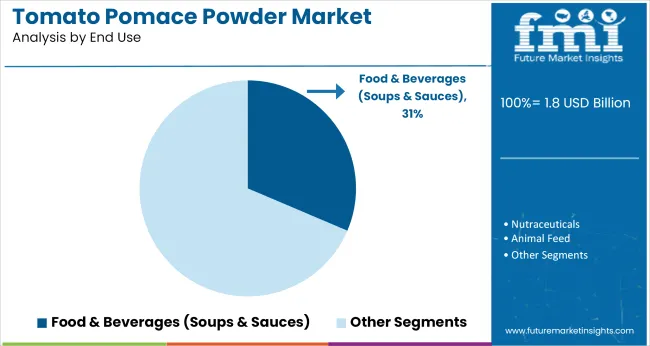
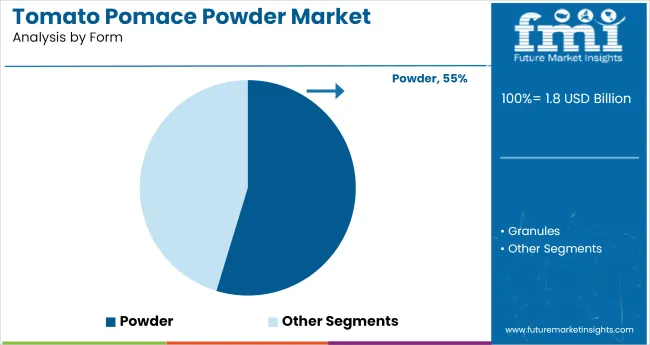
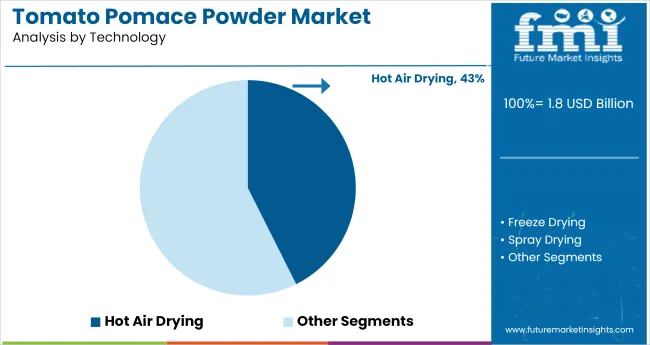
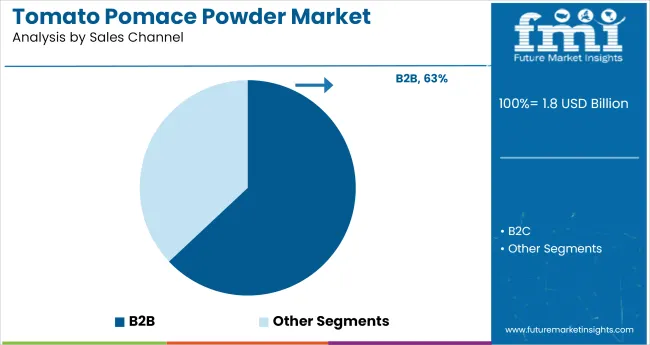
In 2025, the tomato pomace powder market will be driven by food & beverages (soups & sauces) with 31%, powder form holding 55%, hot air-drying technology at 43%, and B2B sales channels dominating at 63%.
Soups and sauces lead the end-use segment with 31% market share

Tomato Pomace Powder Market Analysis By End Use

Soups and sauces are expected to capture 31% of the tomato pomace powder market share in 2025, driven by the growing demand for natural, sustainable ingredients in the food and beverage sector. Tomato pomace powder enhances the texture, flavor, and nutritional content of soups and sauces while offering an eco-friendly solution by upcycling waste from tomato processing. As more manufacturers seek clean-label, plant-based alternatives for their products, tomato pomace powder's functional benefits, including its high fiber and antioxidant content, are fueling its popularity in these applications.
  • Used to enhance texture, flavor, and nutrition in soups and sauces
  • Eco-friendly and sustainable, contributing to reduced food waste
  • Increasing demand for clean-label, plant-based ingredients drives market growth

Powder form dominates with 55% market share

Tomato Pomace Powder Market Analysis By Form

The powder form of tomato pomace is projected to hold 55% of the market share in 2025, making it the preferred format for manufacturers. Its versatility in food and beverage applications, especially in ready-to-eat and processed foods, makes it a staple ingredient in the industry. Powdered tomato pomace is easy to handle, store, and incorporate into various formulations. It offers manufacturers an efficient, cost-effective solution for boosting the nutritional value of their products, particularly in dry mixes, snacks, and health supplements.
  • Powder form is easy to store, handle, and incorporate into various products
  • Preferred for use in dry mixes, snacks, and health supplements
  • Provides a cost-effective way to enhance the nutritional content of processed foods

Hot air drying technology leads with 43% market share

Tomato Pomace Powder Market Analysis By Technology

Hot air drying is expected to dominate the technology segment with 43% market share in 2025. This method is widely used for its cost-effectiveness, scalability, and ability to preserve the flavor, color, and nutritional content of tomato pomace powder. Hot air drying effectively removes moisture from tomato pomace, ensuring a longer shelf life and making the powder suitable for various applications, particularly in food processing. The efficiency and affordability of hot air drying continue to make it the go-to technology for producing high-quality tomato pomace powder.
  • Cost-effective and scalable technology for large-scale production
  • Preserves flavor, color, and nutrients, making it ideal for food processing
  • Widely adopted in the industry due to its efficiency and affordability

B2B sales channels dominate with 63% market share

Tomato Pomace Powder Market Analysis By Sales Channel

B2B sales channels are projected to hold a dominant 63% of the market share in 2025. The B2B model allows suppliers and manufacturers to meet the growing demand for tomato pomace powder from food producers, health product manufacturers, and other industrial users. This distribution channel is particularly advantageous for large-scale buyers seeking bulk quantities of the ingredient, ensuring steady supply and lower prices for both parties. As demand for sustainable and functional ingredients continues to rise in the food industry, B2B sales will remain a critical channel for tomato pomace powder distribution.

  • Dominant distribution channel, facilitating bulk supply to food manufacturers and industrial users
  • Ensures cost-effective pricing and steady supply for large-scale buyers
  • Supports the increasing demand for sustainable, functional ingredients in food and beverage sectors

Top Tomato Pomace Powder Market Dynamics

The tomato pomace powder market is expanding due to increasing demand for natural, high-fiber ingredients in food and animal feed. However, challenges such as inconsistent raw material quality, processing complexities, and limited consumer awareness are hindering broader adoption.

Rising Demand for Natural, High-Fiber Ingredients

The tomato pomace powder market is experiencing growth driven by the increasing consumer preference for natural, high-fiber ingredients in food products. Tomato pomace, a by-product of tomato processing, is rich in dietary fiber, antioxidants, and other bioactive compounds. These nutritional benefits make it an attractive addition to various food products, including bakery items, snacks, and dietary supplements. As consumers become more health-conscious and seek clean-label products, the demand for tomato pomace powder as a functional ingredient is on the rise.

  • Health-conscious consumers are seeking natural, high-fiber ingredients.
  • Tomato pomace powder offers nutritional benefits, including dietary fiber and antioxidants.
  • Clean-label products are gaining popularity among consumers.

Challenges in Raw Material Quality and Processing

Despite its benefits, the tomato pomace powder market faces challenges related to raw material quality and processing complexities. The quality of tomato pomace can vary depending on the source and processing methods, leading to inconsistencies in the final powder product. Additionally, the processing of tomato pomace into powder requires specialized equipment and energy-intensive procedures, contributing to high production costs. These factors can limit the scalability and affordability of tomato pomace powder, hindering its widespread adoption in the food industry.
  • Inconsistent raw material quality affects the final product.
  • Specialized processing equipment and energy-intensive procedures increase production costs.
  • High production costs limit scalability and affordability.

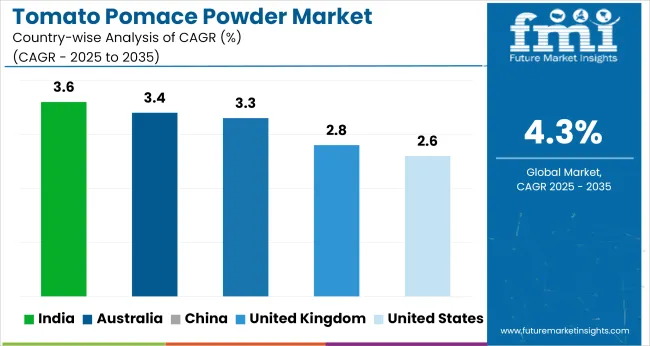
Top Countries Advancing, Utilizing, and Scaling Tomato Pomace Powder Demand

Tomato Pomace Powder Market Cagr Analysis By Country

Countries CAGR (2025 to 2035)
United States 2.6%
United Kingdom 2.7%
China 3.3%
India 3.6%
Australia 3.4%

Global tomato pomace powder market demand is projected to rise at a 4.3% CAGR from 2025 to 2035. Of the five profiled markets out of 40 covered, India leads at 3.6%, followed by China at 3.3%, and Australia at 3.4%, while the United States records 2.6% and the United Kingdom posts 2.7%. These rates translate to a growth premium of -16% for India, -23% for China, and -35% for the United States versus the baseline, while Australia and the United Kingdom show slower growth.

Divergence reflects local catalysts: rising demand for sustainable, plant-based ingredients and natural additives in India and China, while more mature markets like the United States and the United Kingdom experience slower growth due to market saturation and limited adoption of tomato pomace powder in mainstream food products.

Growth Analysis of Tomato Pomace Powder Market in the United States

Sales of tomato pomace powder in the United States are expected to grow at a CAGR of 2.6% from 2025 to 2035. The market benefits from its positioning as a cost-effective, fiber-rich additive in pet food, baked goods, and dietary supplements. Demand is supported by clean-label and upcycled ingredient trends in specialty nutrition.

However, limited consumer awareness and fragmented supply have constrained growth beyond B2B applications. Processors focus on shelf stability and microbial safety to comply with FDA standards. While culinary uses remain niche, the nutraceutical and feed sectors continue to absorb most output.

  • Midwest processors use tomato pomace powder in gut-health-oriented pet food.
  • USDA-backed pilot projects explored its use in school nutrition programs.
  • Retail traction remains low, with industrial use dominating demand channels.

Future Outlook for Tomato Pomace Powder Market in the United Kingdom

The United Kingdom tomato pomace powder market is projected to grow at a CAGR of 2.7% through 2035. Its use in high-fiber bakery formulations and functional beverages is expanding due to consumer interest in upcycled ingredients. Leading manufacturers are incorporating it into meat alternatives and sauces to enhance lycopene content and texture.

Regulatory flexibility on food waste valorization has encouraged processors to scale production. Despite moderate public recognition, inclusion in zero-waste and carbon-label initiatives has improved visibility in health-centric product lines.

  • Food tech startups are blending tomato pomace into vegan burger patties.
  • Public campaigns on food waste reduction feature upcycled tomato-derived products.
  • Retailers offer pomace-enriched flours in eco-labeled baking mixes.

Demand Forecast for Tomato Pomace Powder Market in China

Demand for tomato pomace powder in China is estimated to rise at a CAGR of 3.3% between 2025 and 2035. High tomato processing volumes in Xinjiang and Inner Mongolia provide abundant raw material. Domestic firms incorporate it in traditional noodles and ready-to-eat congee for fiber enrichment. Growth in pet nutrition and livestock feed segments supports steady industrial use.

Market adoption has been strengthened by provincial grants for food waste valorization and investments in spray-drying facilities. Expansion into the sports nutrition and beverage sectors remains exploratory but promising.

  • Tomato pomace flour is added to hotpot seasoning blends for color and texture.
  • Feed mills in Hebei utilize it for cattle digestive health supplements.
  • E-commerce platforms introduced fiber-rich instant porridge with tomato pomace base.

Tomato Pomace Powder Market Growth Outlook in India

The tomato pomace powder market in India is projected to expand at a CAGR of 3.6% from 2025 to 2035. Strong tomato production hubs in Andhra Pradesh and Maharashtra fuel supply, while increased focus on functional flours in Ayurveda-aligned formulations drives demand. Manufacturers are deploying low-heat drying systems to preserve antioxidant profiles.

Rising interest from pet food and poultry feed industries, driven by feed cost concerns, has widened use cases. Retail presence is limited, but institutional buyers and agri-cooperatives are increasingly sourcing tomato pomace-based blends.

  • Agro-startups incorporate tomato pomace in fortified chapati mixes.
  • Poultry farms in Telangana substitute pomace for corn in partial feed trials.
  • FSSAI advisory permits pomace powder in bakery and snack categories.

Analysis of Tomato Pomace Powder Market in Australia

The tomato pomace powder market in Australia is set to grow at a CAGR of 3.4% during 2025-2035. The processing regions in Victoria and Queensland ensure consistent supply to foodservice and animal feed channels. Its antioxidant content and umami-enhancing traits have led to pilot use in seasoning powders and gourmet dry mixes.

Consumer-facing demand remains marginal, but food manufacturers exploring natural coloring and fiber enrichment see it as a viable option. Institutional kitchens and nutritionists use it in low-waste recipe design. Sustainability-driven innovation in snack foods continues to open new application avenues.
  • Meatless meal kits include tomato pomace powder in high-fiber filler bases.
  • Feed producers use it to enrich pellet digestibility for ruminants.
  • Farm-to-shelf brands highlight pomace sourcing in traceability campaigns.

Leading Tomato Pomace Powder Market Suppliers

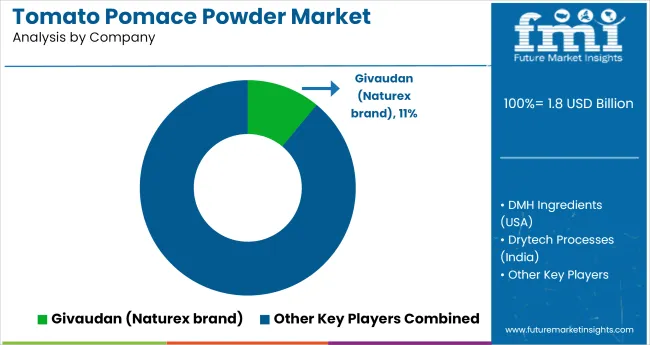
Tomato Pomace Powder Market Analysis By Company

In the tomato pomace powder market, differentiation has focused on concentration level, pesticide-free sourcing, and application-specific formats. Givaudan, through its Naturex portfolio, leads global demand by supplying antioxidant-rich extracts to nutraceutical, seasoning, and processed food manufacturers across Europe and North America. DMH Ingredients and Harmony House Foods have secured USA shelf space through bulk and clean-label offerings targeting B2B bakery and soup bases. In India, Drytech Processes and Ambe NS Agro Products rely on direct-from-farm tomato skins and seeds, producing for both domestic and ASEAN snack manufacturers. Regulatory clarity around lycopene content, colorant use, and solvent-free drying has shaped labeling and functional claims globally.

Recent Industry News

  • In December 2023, Morning Star began transforming tomato peel and seed byproducts into dehydrated tomato pomace powder. The initiative supports zero-waste production, supplying functional powders to the pet food and cosmetic sectors using solar and mechanical drying technologies.
  • In July 2024, Kagome introduced LycoFibre, a tomato pomace-derived powder rich in antioxidants and dietary fiber. Designed for pet food and nutraceuticals, LycoFibre reflects Kagome’s strategy to monetize byproduct streams from over 200,000 tonnes of processed tomatoes annually through sustainable upcycling.

Key Players in the Tomato Pomace Powder Market

  • DMH Ingredients (USA)
  • Drytech Processes (India)
  • Givaudan (Naturex brand)
  • Ambe NS Agro Products Pvt. Ltd. (India)
  • Harmony House Foods (USA)
  • Others

Report Scope

Attribute Category Details
Industry Size (2025E) USD 1.8 billion
Projected Industry Value (2035F) USD 2.7 billion
Value-based CAGR (2025-2035) 4.3%
Base Year for Estimation 2024
Historical Period 2020 to 2024
Projections Period 2025 to 2035
Report Parameter Revenue in USD billion / Volume in metric tons
By Form Powder, Granules
By Source Organic, Conventional
By End Use Food & Beverages (Bakery, Soups & Sauces, Seasonings, Ready Meals), Nutraceuticals, Animal Feed (Livestock Feed, Pet Food), Cosmetics & Personal Care, Industrial (Colorants, Bioplastics)
By Sales Channel B2B (Ingredient Supplie rs, Contract Manufacturers), B2C (Supermarkets/Hypermarkets, Specialty Stores, Online Retail)
By Technology Hot Air Drying, Freeze Drying, Spray Drying
By Region North America, Latin America, Western Europe, Eastern Europe, East Asia, South Asia & Pacific, Central Asia, Balkan and Baltic Countries, Russia & Belarus, Middle East & Africa
Countries Covered United States, Canada, Mexico, Brazil, Germany, France, United Kingdom, Italy, Poland, Spain, Russia, China, India, Japan, South Korea, Australia, Indonesia, Saudi Arabia, UAE, South Africa
Key Players DMH Ingredients (USA), Drytech Processes (India), Givaudan (Naturex), Ambe NS Agro Products Pvt. Ltd. (India), Harmony House Foods (USA)
Additional Attributes Dollar by sales, share by form and end use, regional shifts in drying technology, ingredient demand across feed and food industries, pricing elasticity in bulk B2B segments, and pet food enrichment trends

Tomato Pomace Powder Market Analyzed by Key Investment Segments

By Form:

Form segmentation includes powder and granules.

By Source:

Source-based categories include organic and conventional.

By End Use:

End-use applications comprise food & beverages (bakery, soups & sauces, seasonings, ready meals), nutraceuticals, animal feed (livestock feed, pet food), cosmetics & personal care, and industrial (colorants, bioplastics).

By Sales Channel:

Sales channels include B2B (ingredient suppliers, contract manufacturers) and B2C (supermarkets/hypermarkets, specialty stores, online retail).

By Technology:

Technology segmentation includes hot air drying, freeze drying, and spray drying.

By Region:

Regional analysis includes North America, Latin America, Eastern Europe, Western Europe, East Asia, South Asia & Pacific, Central Asia, Balkan and Baltic Countries, Russia & Belarus, and the Middle East & Africa.

Table of Content

  1. Executive Summary
    • Global Market Outlook
    • Demand-side Trends
    • Supply-side Trends
    • Technology Roadmap Analysis
    • Analysis and Recommendations
  2. Market Overview
    • Market Coverage / Taxonomy
    • Market Definition / Scope / Limitations
  3. Market Background
    • Market Dynamics
      • Drivers
      • Restraints
      • Opportunity
      • Trends
    • Scenario Forecast
      • Demand in Optimistic Scenario
      • Demand in Likely Scenario
      • Demand in Conservative Scenario
    • Opportunity Map Analysis
    • Product Life Cycle Analysis
    • Supply Chain Analysis
      • Supply Side Participants and their Roles
        • Producers
        • Mid-Level Participants (Traders/ Agents/ Brokers)
        • Wholesalers and Distributors
      • Value Added and Value Created at Node in the Supply Chain
      • List of Raw Material Suppliers
      • List of Existing and Potential Buyer’s
    • Investment Feasibility Matrix
    • Value Chain Analysis
      • Profit Margin Analysis
      • Wholesalers and Distributors
      • Retailers
    • PESTLE and Porter’s Analysis
    • Regulatory Landscape
      • By Key Regions
      • By Key Countries
    • Regional Parent Market Outlook
    • Production and Consumption Statistics
    • Import and Export Statistics
  4. Global Market Analysis 2020-2024 and Forecast, 2025-2035
    • Historical Market Size Value (USD Billion) & Volume (Metric Tons) Analysis, 2020-2024
    • Current and Future Market Size Value (USD Billion) & Volume (Metric Tons) Projections, 2025-2035
      • Y-o-Y Growth Trend Analysis
      • Absolute $ Opportunity Analysis
  5. Global Market Pricing Analysis 2020-2024 and Forecast 2025-2035
  6. Global Market Analysis 2020-2024 and Forecast 2025-2035, By Form
    • Introduction / Key Findings
    • Historical Market Size Value (USD Billion) & Volume (Metric Tons) Analysis By Form, 2020-2024
    • Current and Future Market Size Value (USD Billion) & Volume (Metric Tons) Analysis and Forecast By Form, 2025-2035
      • Powder
      • Granules
    • Y-o-Y Growth Trend Analysis By Form, 2020-2024
    • Absolute $ Opportunity Analysis By Form, 2025-2035
  7. Global Market Analysis 2020-2024 and Forecast 2025-2035, By Source
    • Introduction / Key Findings
    • Historical Market Size Value (USD Billion) & Volume (Metric Tons) Analysis By Source, 2020-2024
    • Current and Future Market Size Value (USD Billion) & Volume (Metric Tons) Analysis and Forecast By Source, 2025-2035
      • Organic
      • Conventional
    • Y-o-Y Growth Trend Analysis By Source, 2020-2024
    • Absolute $ Opportunity Analysis By Source, 2025-2035
  8. Global Market Analysis 2020-2024 and Forecast 2025-2035, By End Use
    • Introduction / Key Findings
    • Historical Market Size Value (USD Billion) & Volume (Metric Tons) Analysis By End Use, 2020-2024
    • Current and Future Market Size Value (USD Billion) & Volume (Metric Tons) Analysis and Forecast By End Use, 2025-2035
      • Food & Beverages
        • Bakery
        • Soups & Sauces
        • Seasonings
        • Ready Meals
      • Nutraceuticals
      • Animal Feed
        • Livestock Feed
        • Pet Food
      • Cosmetics & Personal Care
      • Industrial
        • Colorants
        • Bioplastics
    • Y-o-Y Growth Trend Analysis By End Use, 2020-2024
    • Absolute $ Opportunity Analysis By End Use, 2025-2035
  9. Global Market Analysis 2020-2024 and Forecast 2025-2035, By Sales Channel
    • Introduction / Key Findings
    • Historical Market Size Value (USD Billion) & Volume (Metric Tons) Analysis By Sales Channel, 2020-2024
    • Current and Future Market Size Value (USD Billion) & Volume (Metric Tons) Analysis and Forecast By Sales Channel, 2025-2035
      • B2B
        • Ingredient Suppliers
        • Contract Manufacturers
      • B2C
        • Supermarkets/Hypermarkets
        • Specialty Stores
        • Online Retail
    • Y-o-Y Growth Trend Analysis By Sales Channel, 2020-2024
    • Absolute $ Opportunity Analysis By Sales Channel, 2025-2035
  10. Global Market Analysis 2020-2024 and Forecast 2025-2035, By Technology
    • Introduction / Key Findings
    • Historical Market Size Value (USD Billion) & Volume (Metric Tons) Analysis By Technology, 2020-2024
    • Current and Future Market Size Value (USD Billion) & Volume (Metric Tons) Analysis and Forecast By Technology, 2025-2035
      • Hot Air Drying
      • Freeze Drying
      • Spray Drying
    • Y-o-Y Growth Trend Analysis By Technology, 2020-2024
    • Absolute $ Opportunity Analysis By Technology, 2025-2035
  11. Global Market Analysis 2020-2024 and Forecast 2025-2035, By Region
    • Introduction
    • Historical Market Size Value (USD Billion) & Volume (Metric Tons) Analysis By Region, 2020-2024
    • Current Market Size Value (USD Billion) & Volume (Metric Tons) Analysis and Forecast By Region, 2025-2035
      • North America
      • Latin America
      • Western Europe
      • Eastern Europe
      • East Asia
      • South Asia & Pacific
      • Middle East and Africa
    • Market Attractiveness Analysis By Region
  12. North America Market Analysis 2020-2024 and Forecast 2025-2035, By Country
    • Historical Market Size Value (USD Billion) & Volume (Metric Tons) Trend Analysis By Market Taxonomy, 2020-2024
    • Market Size Value (USD Billion) & Volume (Metric Tons) Forecast By Market Taxonomy, 2025-2035
      • By Country
        • USA
        • Canada
        • Mexico
      • By Form
      • By Source
      • By End Use
      • By Sales Channel
      • By Technology
    • Market Attractiveness Analysis
      • By Country
      • By Form
      • By Source
      • By End Use
      • By Sales Channel
      • By Technology
    • Key Takeaways
  13. Latin America Market Analysis 2020-2024 and Forecast 2025-2035, By Country
    • Historical Market Size Value (USD Billion) & Volume (Metric Tons) Trend Analysis By Market Taxonomy, 2020-2024
    • Market Size Value (USD Billion) & Volume (Metric Tons) Forecast By Market Taxonomy, 2025-2035
      • By Country
        • Brazil
        • Argentina
        • Rest of LATAM
      • By Form
      • By Source
      • By End Use
      • By Sales Channel
      • By Technology
    • Market Attractiveness Analysis
      • By Country
      • By Form
      • By Source
      • By End Use
      • By Sales Channel
      • By Technology
    • Key Takeaways
  14. Western Europe Market Analysis 2020-2024 and Forecast 2025-2035, By Country
    • Historical Market Size Value (USD Billion) & Volume (Metric Tons) Trend Analysis By Market Taxonomy, 2020-2024
    • Market Size Value (USD Billion) & Volume (Metric Tons) Forecast By Market Taxonomy, 2025-2035
      • By Country
        • Germany
        • Italy
        • France
        • UK
        • Spain
        • BENELUX
        • Nordic
        • Rest of W.Europe
      • By Form
      • By Source
      • By End Use
      • By Sales Channel
      • By Technology
    • Market Attractiveness Analysis
      • By Country
      • By Form
      • By Source
      • By End Use
      • By Sales Channel
      • By Technology
    • Key Takeaways
  15. Eastern Europe Market Analysis 2020-2024 and Forecast 2025-2035, By Country
    • Historical Market Size Value (USD Billion) & Volume (Metric Tons) Trend Analysis By Market Taxonomy, 2020-2024
    • Market Size Value (USD Billion) & Volume (Metric Tons) Forecast By Market Taxonomy, 2025-2035
      • By Country
        • Russia
        • Hungary
        • Poland
        • Balkan & Baltics
        • Rest of E. Europe
      • By Form
      • By Source
      • By End Use
      • By Sales Channel
      • By Technology
    • Market Attractiveness Analysis
      • By Country
      • By Form
      • By Source
      • By End Use
      • By Sales Channel
      • By Technology
    • Key Takeaways
  16. East Asia Market Analysis 2020-2024 and Forecast 2025-2035, By Country
    • Historical Market Size Value (USD Billion) & Volume (Metric Tons) Trend Analysis By Market Taxonomy, 2020-2024
    • Market Size Value (USD Billion) & Volume (Metric Tons) Forecast By Market Taxonomy, 2025-2035
      • By Country
        • China
        • Japan
        • South Korea
      • By Form
      • By Source
      • By End Use
      • By Sales Channel
      • By Technology
    • Market Attractiveness Analysis
      • By Country
      • By Form
      • By Source
      • By End Use
      • By Sales Channel
      • By Technology
    • Key Takeaways
  17. South Asia & Pacific Market Analysis 2020-2024 and Forecast 2025-2035, By Country
    • Historical Market Size Value (USD Billion) & Volume (Metric Tons) Trend Analysis By Market Taxonomy, 2020-2024
    • Market Size Value (USD Billion) & Volume (Metric Tons) Forecast By Market Taxonomy, 2025-2035
      • By Country
        • India
        • Australia & New Zealand
        • ASEAN
        • Rest of SAP
      • By Form
      • By Source
      • By End Use
      • By Sales Channel
      • By Technology
    • Market Attractiveness Analysis
      • By Country
      • By Form
      • By Source
      • By End Use
      • By Sales Channel
      • By Technology
    • Key Takeaways
  18. Middle East and Africa Market Analysis 2020-2024 and Forecast 2025-2035, By Country
    • Historical Market Size Value (USD Billion) & Volume (Metric Tons) Trend Analysis By Market Taxonomy, 2020-2024
    • Market Size Value (USD Billion) & Volume (Metric Tons) Forecast By Market Taxonomy, 2025-2035
      • By Country
        • GCC Countries
        • Northern Africa
        • South Africa
        • Turkiye
        • Rest of MEA
      • By Form
      • By Source
      • By End Use
      • By Sales Channel
      • By Technology
    • Market Attractiveness Analysis
      • By Country
      • By Form
      • By Source
      • By End Use
      • By Sales Channel
      • By Technology
    • Key Takeaways
  19. Key Countries Market Analysis
    • USA
      • Pricing Analysis
      • Market Share Analysis, 2024
        • By Form
        • By Source
        • By End Use
        • By Sales Channel
        • By Technology
    • Canada
      • Pricing Analysis
      • Market Share Analysis, 2024
        • By Form
        • By Source
        • By End Use
        • By Sales Channel
        • By Technology
    • Brazil
      • Pricing Analysis
      • Market Share Analysis, 2024
        • By Form
        • By Source
        • By End Use
        • By Sales Channel
        • By Technology
    • Mexico
      • Pricing Analysis
      • Market Share Analysis, 2024
        • By Form
        • By Source
        • By End Use
        • By Sales Channel
        • By Technology
    • Argentina
      • Pricing Analysis
      • Market Share Analysis, 2024
        • By Form
        • By Source
        • By End Use
        • By Sales Channel
        • By Technology
  20. Market Structure Analysis
    • Competition Dashboard
    • Competition Benchmarking
    • Market Share Analysis of Top Players
      • By Regional
      • By Form
      • By Source
      • By End Use
      • By Sales Channel
      • By Technology
  21. Competition Analysis
    • Competition Deep Dive
      • DMH Ingredients (USA)
        • Overview
        • Product Portfolio
        • Profitability by Market Segments (Product/Age /Sales Channel/Region)
        • Sales Footprint
        • Strategy Overview
          • Marketing Strategy
          • Product Strategy
          • Channel Strategy
      • Drytech Processes (India)
        • Overview
        • Product Portfolio
        • Profitability by Market Segments (Product/Age /Sales Channel/Region)
        • Sales Footprint
        • Strategy Overview
          • Marketing Strategy
          • Product Strategy
          • Channel Strategy
      • Givaudan (Naturex brand)
        • Overview
        • Product Portfolio
        • Profitability by Market Segments (Product/Age /Sales Channel/Region)
        • Sales Footprint
        • Strategy Overview
          • Marketing Strategy
          • Product Strategy
          • Channel Strategy
      • Ambe NS Agro Products Pvt. Ltd. (India)
        • Overview
        • Product Portfolio
        • Profitability by Market Segments (Product/Age /Sales Channel/Region)
        • Sales Footprint
        • Strategy Overview
          • Marketing Strategy
          • Product Strategy
          • Channel Strategy
      • Harmony House Foods (USA)
        • Overview
        • Product Portfolio
        • Profitability by Market Segments (Product/Age /Sales Channel/Region)
        • Sales Footprint
        • Strategy Overview
          • Marketing Strategy
          • Product Strategy
          • Channel Strategy
  22. Assumptions & Acronyms Used
  23. Research Methodology

List of Tables

  • Table 1: Global Market Value (USD Billion) Forecast by Region, 2020-2035
  • Table 2: Global Market Volume (Metric Tons) Forecast by Region, 2020-2035
  • Table 3: Global Market Value (USD Billion) Forecast by Form, 2020-2035
  • Table 4: Global Market Volume (Metric Tons) Forecast by Form, 2020-2035
  • Table 5: Global Market Value (USD Billion) Forecast by Source, 2020-2035
  • Table 6: Global Market Volume (Metric Tons) Forecast by Source, 2020-2035
  • Table 7: Global Market Value (USD Billion) Forecast by End Use, 2020-2035
  • Table 8: Global Market Volume (Metric Tons) Forecast by End Use, 2020-2035
  • Table 9: Global Market Value (USD Billion) Forecast by Sales Channel, 2020-2035
  • Table 10: Global Market Volume (Metric Tons) Forecast by Sales Channel, 2020-2035
  • Table 11: Global Market Value (USD Billion) Forecast by Technology, 2020-2035
  • Table 12: Global Market Volume (Metric Tons) Forecast by Technology, 2020-2035
  • Table 13: North America Market Value (USD Billion) Forecast by Country, 2020-2035
  • Table 14: North America Market Volume (Metric Tons) Forecast by Country, 2020-2035
  • Table 15: North America Market Value (USD Billion) Forecast by Form, 2020-2035
  • Table 16: North America Market Volume (Metric Tons) Forecast by Form, 2020-2035
  • Table 17: North America Market Value (USD Billion) Forecast by Source, 2020-2035
  • Table 18: North America Market Volume (Metric Tons) Forecast by Source, 2020-2035
  • Table 19: North America Market Value (USD Billion) Forecast by End Use, 2020-2035
  • Table 20: North America Market Volume (Metric Tons) Forecast by End Use, 2020-2035
  • Table 21: North America Market Value (USD Billion) Forecast by Sales Channel, 2020-2035
  • Table 22: North America Market Volume (Metric Tons) Forecast by Sales Channel, 2020-2035
  • Table 23: North America Market Value (USD Billion) Forecast by Technology, 2020-2035
  • Table 24: North America Market Volume (Metric Tons) Forecast by Technology, 2020-2035
  • Table 25: Latin America Market Value (USD Billion) Forecast by Country, 2020-2035
  • Table 26: Latin America Market Volume (Metric Tons) Forecast by Country, 2020-2035
  • Table 27: Latin America Market Value (USD Billion) Forecast by Form, 2020-2035
  • Table 28: Latin America Market Volume (Metric Tons) Forecast by Form, 2020-2035
  • Table 29: Latin America Market Value (USD Billion) Forecast by Source, 2020-2035
  • Table 30: Latin America Market Volume (Metric Tons) Forecast by Source, 2020-2035
  • Table 31: Latin America Market Value (USD Billion) Forecast by End Use, 2020-2035
  • Table 32: Latin America Market Volume (Metric Tons) Forecast by End Use, 2020-2035
  • Table 33: Latin America Market Value (USD Billion) Forecast by Sales Channel, 2020-2035
  • Table 34: Latin America Market Volume (Metric Tons) Forecast by Sales Channel, 2020-2035
  • Table 35: Latin America Market Value (USD Billion) Forecast by Technology, 2020-2035
  • Table 36: Latin America Market Volume (Metric Tons) Forecast by Technology, 2020-2035
  • Table 37: Western Europe Market Value (USD Billion) Forecast by Country, 2020-2035
  • Table 38: Western Europe Market Volume (Metric Tons) Forecast by Country, 2020-2035
  • Table 39: Western Europe Market Value (USD Billion) Forecast by Form, 2020-2035
  • Table 40: Western Europe Market Volume (Metric Tons) Forecast by Form, 2020-2035
  • Table 41: Western Europe Market Value (USD Billion) Forecast by Source, 2020-2035
  • Table 42: Western Europe Market Volume (Metric Tons) Forecast by Source, 2020-2035
  • Table 43: Western Europe Market Value (USD Billion) Forecast by End Use, 2020-2035
  • Table 44: Western Europe Market Volume (Metric Tons) Forecast by End Use, 2020-2035
  • Table 45: Western Europe Market Value (USD Billion) Forecast by Sales Channel, 2020-2035
  • Table 46: Western Europe Market Volume (Metric Tons) Forecast by Sales Channel, 2020-2035
  • Table 47: Western Europe Market Value (USD Billion) Forecast by Technology, 2020-2035
  • Table 48: Western Europe Market Volume (Metric Tons) Forecast by Technology, 2020-2035
  • Table 49: Eastern Europe Market Value (USD Billion) Forecast by Country, 2020-2035
  • Table 50: Eastern Europe Market Volume (Metric Tons) Forecast by Country, 2020-2035
  • Table 51: Eastern Europe Market Value (USD Billion) Forecast by Form, 2020-2035
  • Table 52: Eastern Europe Market Volume (Metric Tons) Forecast by Form, 2020-2035
  • Table 53: Eastern Europe Market Value (USD Billion) Forecast by Source, 2020-2035
  • Table 54: Eastern Europe Market Volume (Metric Tons) Forecast by Source, 2020-2035
  • Table 55: Eastern Europe Market Value (USD Billion) Forecast by End Use, 2020-2035
  • Table 56: Eastern Europe Market Volume (Metric Tons) Forecast by End Use, 2020-2035
  • Table 57: Eastern Europe Market Value (USD Billion) Forecast by Sales Channel, 2020-2035
  • Table 58: Eastern Europe Market Volume (Metric Tons) Forecast by Sales Channel, 2020-2035
  • Table 59: Eastern Europe Market Value (USD Billion) Forecast by Technology, 2020-2035
  • Table 60: Eastern Europe Market Volume (Metric Tons) Forecast by Technology, 2020-2035
  • Table 61: East Asia Market Value (USD Billion) Forecast by Country, 2020-2035
  • Table 62: East Asia Market Volume (Metric Tons) Forecast by Country, 2020-2035
  • Table 63: East Asia Market Value (USD Billion) Forecast by Form, 2020-2035
  • Table 64: East Asia Market Volume (Metric Tons) Forecast by Form, 2020-2035
  • Table 65: East Asia Market Value (USD Billion) Forecast by Source, 2020-2035
  • Table 66: East Asia Market Volume (Metric Tons) Forecast by Source, 2020-2035
  • Table 67: East Asia Market Value (USD Billion) Forecast by End Use, 2020-2035
  • Table 68: East Asia Market Volume (Metric Tons) Forecast by End Use, 2020-2035
  • Table 69: East Asia Market Value (USD Billion) Forecast by Sales Channel, 2020-2035
  • Table 70: East Asia Market Volume (Metric Tons) Forecast by Sales Channel, 2020-2035
  • Table 71: East Asia Market Value (USD Billion) Forecast by Technology, 2020-2035
  • Table 72: East Asia Market Volume (Metric Tons) Forecast by Technology, 2020-2035
  • Table 73: South Asia & Pacific Market Value (USD Billion) Forecast by Country, 2020-2035
  • Table 74: South Asia & Pacific Market Volume (Metric Tons) Forecast by Country, 2020-2035
  • Table 75: South Asia & Pacific Market Value (USD Billion) Forecast by Form, 2020-2035
  • Table 76: South Asia & Pacific Market Volume (Metric Tons) Forecast by Form, 2020-2035
  • Table 77: South Asia & Pacific Market Value (USD Billion) Forecast by Source, 2020-2035
  • Table 78: South Asia & Pacific Market Volume (Metric Tons) Forecast by Source, 2020-2035
  • Table 79: South Asia & Pacific Market Value (USD Billion) Forecast by End Use, 2020-2035
  • Table 80: South Asia & Pacific Market Volume (Metric Tons) Forecast by End Use, 2020-2035
  • Table 81: South Asia & Pacific Market Value (USD Billion) Forecast by Sales Channel, 2020-2035
  • Table 82: South Asia & Pacific Market Volume (Metric Tons) Forecast by Sales Channel, 2020-2035
  • Table 83: South Asia & Pacific Market Value (USD Billion) Forecast by Technology, 2020-2035
  • Table 84: South Asia & Pacific Market Volume (Metric Tons) Forecast by Technology, 2020-2035
  • Table 85: Middle East and Africa Market Value (USD Billion) Forecast by Country, 2020-2035
  • Table 86: Middle East and Africa Market Volume (Metric Tons) Forecast by Country, 2020-2035
  • Table 87: Middle East and Africa Market Value (USD Billion) Forecast by Form, 2020-2035
  • Table 88: Middle East and Africa Market Volume (Metric Tons) Forecast by Form, 2020-2035
  • Table 89: Middle East and Africa Market Value (USD Billion) Forecast by Source, 2020-2035
  • Table 90: Middle East and Africa Market Volume (Metric Tons) Forecast by Source, 2020-2035
  • Table 91: Middle East and Africa Market Value (USD Billion) Forecast by End Use, 2020-2035
  • Table 92: Middle East and Africa Market Volume (Metric Tons) Forecast by End Use, 2020-2035
  • Table 93: Middle East and Africa Market Value (USD Billion) Forecast by Sales Channel, 2020-2035
  • Table 94: Middle East and Africa Market Volume (Metric Tons) Forecast by Sales Channel, 2020-2035
  • Table 95: Middle East and Africa Market Value (USD Billion) Forecast by Technology, 2020-2035
  • Table 96: Middle East and Africa Market Volume (Metric Tons) Forecast by Technology, 2020-2035

List of Figures

  • Figure 1: Global Market Volume (Metric Tons) Forecast 2020-2035
  • Figure 2: Global Market Pricing Analysis
  • Figure 3: Global Market Value (USD Billion) Forecast 2020-2035
  • Figure 4: Global Market Value Share and BPS Analysis by Form, 2025 and 2035
  • Figure 5: Global Market Y-o-Y Growth Comparison by Form, 2025-2035
  • Figure 6: Global Market Attractiveness Analysis by Form
  • Figure 7: Global Market Value Share and BPS Analysis by Source, 2025 and 2035
  • Figure 8: Global Market Y-o-Y Growth Comparison by Source, 2025-2035
  • Figure 9: Global Market Attractiveness Analysis by Source
  • Figure 10: Global Market Value Share and BPS Analysis by End Use, 2025 and 2035
  • Figure 11: Global Market Y-o-Y Growth Comparison by End Use, 2025-2035
  • Figure 12: Global Market Attractiveness Analysis by End Use
  • Figure 13: Global Market Value Share and BPS Analysis by Sales Channel, 2025 and 2035
  • Figure 14: Global Market Y-o-Y Growth Comparison by Sales Channel, 2025-2035
  • Figure 15: Global Market Attractiveness Analysis by Sales Channel
  • Figure 16: Global Market Value Share and BPS Analysis by Technology, 2025 and 2035
  • Figure 17: Global Market Y-o-Y Growth Comparison by Technology, 2025-2035
  • Figure 18: Global Market Attractiveness Analysis by Technology
  • Figure 19: Global Market Value (USD Billion) Share and BPS Analysis by Region, 2025 and 2035
  • Figure 20: Global Market Y-o-Y Growth Comparison by Region, 2025-2035
  • Figure 21: Global Market Attractiveness Analysis by Region
  • Figure 22: North America Market Incremental $ Opportunity, 2025-2035
  • Figure 23: Latin America Market Incremental $ Opportunity, 2025-2035
  • Figure 24: Western Europe Market Incremental $ Opportunity, 2025-2035
  • Figure 25: Eastern Europe Market Incremental $ Opportunity, 2025-2035
  • Figure 26: East Asia Market Incremental $ Opportunity, 2025-2035
  • Figure 27: South Asia & Pacific Market Incremental $ Opportunity, 2025-2035
  • Figure 28: Middle East and Africa Market Incremental $ Opportunity, 2025-2035
  • Figure 29: North America Market Value Share and BPS Analysis by Country, 2025 and 2035
  • Figure 30: North America Market Value Share and BPS Analysis by Form, 2025 and 2035
  • Figure 31: North America Market Y-o-Y Growth Comparison by Form, 2025-2035
  • Figure 32: North America Market Attractiveness Analysis by Form
  • Figure 33: North America Market Value Share and BPS Analysis by Source, 2025 and 2035
  • Figure 34: North America Market Y-o-Y Growth Comparison by Source, 2025-2035
  • Figure 35: North America Market Attractiveness Analysis by Source
  • Figure 36: North America Market Value Share and BPS Analysis by End Use, 2025 and 2035
  • Figure 37: North America Market Y-o-Y Growth Comparison by End Use, 2025-2035
  • Figure 38: North America Market Attractiveness Analysis by End Use
  • Figure 39: North America Market Value Share and BPS Analysis by Sales Channel, 2025 and 2035
  • Figure 40: North America Market Y-o-Y Growth Comparison by Sales Channel, 2025-2035
  • Figure 41: North America Market Attractiveness Analysis by Sales Channel
  • Figure 42: North America Market Value Share and BPS Analysis by Technology, 2025 and 2035
  • Figure 43: North America Market Y-o-Y Growth Comparison by Technology, 2025-2035
  • Figure 44: North America Market Attractiveness Analysis by Technology
  • Figure 45: Latin America Market Value Share and BPS Analysis by Country, 2025 and 2035
  • Figure 46: Latin America Market Value Share and BPS Analysis by Form, 2025 and 2035
  • Figure 47: Latin America Market Y-o-Y Growth Comparison by Form, 2025-2035
  • Figure 48: Latin America Market Attractiveness Analysis by Form
  • Figure 49: Latin America Market Value Share and BPS Analysis by Source, 2025 and 2035
  • Figure 50: Latin America Market Y-o-Y Growth Comparison by Source, 2025-2035
  • Figure 51: Latin America Market Attractiveness Analysis by Source
  • Figure 52: Latin America Market Value Share and BPS Analysis by End Use, 2025 and 2035
  • Figure 53: Latin America Market Y-o-Y Growth Comparison by End Use, 2025-2035
  • Figure 54: Latin America Market Attractiveness Analysis by End Use
  • Figure 55: Latin America Market Value Share and BPS Analysis by Sales Channel, 2025 and 2035
  • Figure 56: Latin America Market Y-o-Y Growth Comparison by Sales Channel, 2025-2035
  • Figure 57: Latin America Market Attractiveness Analysis by Sales Channel
  • Figure 58: Latin America Market Value Share and BPS Analysis by Technology, 2025 and 2035
  • Figure 59: Latin America Market Y-o-Y Growth Comparison by Technology, 2025-2035
  • Figure 60: Latin America Market Attractiveness Analysis by Technology
  • Figure 61: Western Europe Market Value Share and BPS Analysis by Country, 2025 and 2035
  • Figure 62: Western Europe Market Value Share and BPS Analysis by Form, 2025 and 2035
  • Figure 63: Western Europe Market Y-o-Y Growth Comparison by Form, 2025-2035
  • Figure 64: Western Europe Market Attractiveness Analysis by Form
  • Figure 65: Western Europe Market Value Share and BPS Analysis by Source, 2025 and 2035
  • Figure 66: Western Europe Market Y-o-Y Growth Comparison by Source, 2025-2035
  • Figure 67: Western Europe Market Attractiveness Analysis by Source
  • Figure 68: Western Europe Market Value Share and BPS Analysis by End Use, 2025 and 2035
  • Figure 69: Western Europe Market Y-o-Y Growth Comparison by End Use, 2025-2035
  • Figure 70: Western Europe Market Attractiveness Analysis by End Use
  • Figure 71: Western Europe Market Value Share and BPS Analysis by Sales Channel, 2025 and 2035
  • Figure 72: Western Europe Market Y-o-Y Growth Comparison by Sales Channel, 2025-2035
  • Figure 73: Western Europe Market Attractiveness Analysis by Sales Channel
  • Figure 74: Western Europe Market Value Share and BPS Analysis by Technology, 2025 and 2035
  • Figure 75: Western Europe Market Y-o-Y Growth Comparison by Technology, 2025-2035
  • Figure 76: Western Europe Market Attractiveness Analysis by Technology
  • Figure 77: Eastern Europe Market Value Share and BPS Analysis by Country, 2025 and 2035
  • Figure 78: Eastern Europe Market Value Share and BPS Analysis by Form, 2025 and 2035
  • Figure 79: Eastern Europe Market Y-o-Y Growth Comparison by Form, 2025-2035
  • Figure 80: Eastern Europe Market Attractiveness Analysis by Form
  • Figure 81: Eastern Europe Market Value Share and BPS Analysis by Source, 2025 and 2035
  • Figure 82: Eastern Europe Market Y-o-Y Growth Comparison by Source, 2025-2035
  • Figure 83: Eastern Europe Market Attractiveness Analysis by Source
  • Figure 84: Eastern Europe Market Value Share and BPS Analysis by End Use, 2025 and 2035
  • Figure 85: Eastern Europe Market Y-o-Y Growth Comparison by End Use, 2025-2035
  • Figure 86: Eastern Europe Market Attractiveness Analysis by End Use
  • Figure 87: Eastern Europe Market Value Share and BPS Analysis by Sales Channel, 2025 and 2035
  • Figure 88: Eastern Europe Market Y-o-Y Growth Comparison by Sales Channel, 2025-2035
  • Figure 89: Eastern Europe Market Attractiveness Analysis by Sales Channel
  • Figure 90: Eastern Europe Market Value Share and BPS Analysis by Technology, 2025 and 2035
  • Figure 91: Eastern Europe Market Y-o-Y Growth Comparison by Technology, 2025-2035
  • Figure 92: Eastern Europe Market Attractiveness Analysis by Technology
  • Figure 93: East Asia Market Value Share and BPS Analysis by Country, 2025 and 2035
  • Figure 94: East Asia Market Value Share and BPS Analysis by Form, 2025 and 2035
  • Figure 95: East Asia Market Y-o-Y Growth Comparison by Form, 2025-2035
  • Figure 96: East Asia Market Attractiveness Analysis by Form
  • Figure 97: East Asia Market Value Share and BPS Analysis by Source, 2025 and 2035
  • Figure 98: East Asia Market Y-o-Y Growth Comparison by Source, 2025-2035
  • Figure 99: East Asia Market Attractiveness Analysis by Source
  • Figure 100: East Asia Market Value Share and BPS Analysis by End Use, 2025 and 2035
  • Figure 101: East Asia Market Y-o-Y Growth Comparison by End Use, 2025-2035
  • Figure 102: East Asia Market Attractiveness Analysis by End Use
  • Figure 103: East Asia Market Value Share and BPS Analysis by Sales Channel, 2025 and 2035
  • Figure 104: East Asia Market Y-o-Y Growth Comparison by Sales Channel, 2025-2035
  • Figure 105: East Asia Market Attractiveness Analysis by Sales Channel
  • Figure 106: East Asia Market Value Share and BPS Analysis by Technology, 2025 and 2035
  • Figure 107: East Asia Market Y-o-Y Growth Comparison by Technology, 2025-2035
  • Figure 108: East Asia Market Attractiveness Analysis by Technology
  • Figure 109: South Asia & Pacific Market Value Share and BPS Analysis by Country, 2025 and 2035
  • Figure 110: South Asia & Pacific Market Value Share and BPS Analysis by Form, 2025 and 2035
  • Figure 111: South Asia & Pacific Market Y-o-Y Growth Comparison by Form, 2025-2035
  • Figure 112: South Asia & Pacific Market Attractiveness Analysis by Form
  • Figure 113: South Asia & Pacific Market Value Share and BPS Analysis by Source, 2025 and 2035
  • Figure 114: South Asia & Pacific Market Y-o-Y Growth Comparison by Source, 2025-2035
  • Figure 115: South Asia & Pacific Market Attractiveness Analysis by Source
  • Figure 116: South Asia & Pacific Market Value Share and BPS Analysis by End Use, 2025 and 2035
  • Figure 117: South Asia & Pacific Market Y-o-Y Growth Comparison by End Use, 2025-2035
  • Figure 118: South Asia & Pacific Market Attractiveness Analysis by End Use
  • Figure 119: South Asia & Pacific Market Value Share and BPS Analysis by Sales Channel, 2025 and 2035
  • Figure 120: South Asia & Pacific Market Y-o-Y Growth Comparison by Sales Channel, 2025-2035
  • Figure 121: South Asia & Pacific Market Attractiveness Analysis by Sales Channel
  • Figure 122: South Asia & Pacific Market Value Share and BPS Analysis by Technology, 2025 and 2035
  • Figure 123: South Asia & Pacific Market Y-o-Y Growth Comparison by Technology, 2025-2035
  • Figure 124: South Asia & Pacific Market Attractiveness Analysis by Technology
  • Figure 125: Middle East and Africa Market Value Share and BPS Analysis by Country, 2025 and 2035
  • Figure 126: Middle East and Africa Market Value Share and BPS Analysis by Form, 2025 and 2035
  • Figure 127: Middle East and Africa Market Y-o-Y Growth Comparison by Form, 2025-2035
  • Figure 128: Middle East and Africa Market Attractiveness Analysis by Form
  • Figure 129: Middle East and Africa Market Value Share and BPS Analysis by Source, 2025 and 2035
  • Figure 130: Middle East and Africa Market Y-o-Y Growth Comparison by Source, 2025-2035
  • Figure 131: Middle East and Africa Market Attractiveness Analysis by Source
  • Figure 132: Middle East and Africa Market Value Share and BPS Analysis by End Use, 2025 and 2035
  • Figure 133: Middle East and Africa Market Y-o-Y Growth Comparison by End Use, 2025-2035
  • Figure 134: Middle East and Africa Market Attractiveness Analysis by End Use
  • Figure 135: Middle East and Africa Market Value Share and BPS Analysis by Sales Channel, 2025 and 2035
  • Figure 136: Middle East and Africa Market Y-o-Y Growth Comparison by Sales Channel, 2025-2035
  • Figure 137: Middle East and Africa Market Attractiveness Analysis by Sales Channel
  • Figure 138: Middle East and Africa Market Value Share and BPS Analysis by Technology, 2025 and 2035
  • Figure 139: Middle East and Africa Market Y-o-Y Growth Comparison by Technology, 2025-2035
  • Figure 140: Middle East and Africa Market Attractiveness Analysis by Technology
  • Figure 141: Global Market - Tier Structure Analysis
  • Figure 142: Global Market - Company Share Analysis

Frequently Asked Questions

What is the estimated industry size of the tomato pomace powder market in 2025?

The estimated industry size in 2025 is USD 1.8 billion.

What will be the market value of the tomato pomace powder market in 2035 and its CAGR?

The market value in 2035 is USD 2.7 billion, with a CAGR of 4.3%.

Which end-use segment dominates the tomato pomace powder market?

The food & beverages segment, specifically soups & sauces, dominates the market with a 31% market share.

Which form leads the tomato pomace powder market?

Powder form leads the market with a 55% market share.

Which country is projected to have the highest CAGR in the tomato pomace powder market?

India is projected to have the highest CAGR in the market with a growth rate of 3.6% from 2025 to 2035.

Explore Similar Insights

Future Market Insights

Tomato Pomace Powder Market