
- Market Size (2026)
- USD 93.1 Mn
- Forecast (2036)
- USD 154.6 Mn
- CAGR (2026 to 2036)
- 5.2%
How big is Tragacanth Market in 2026?
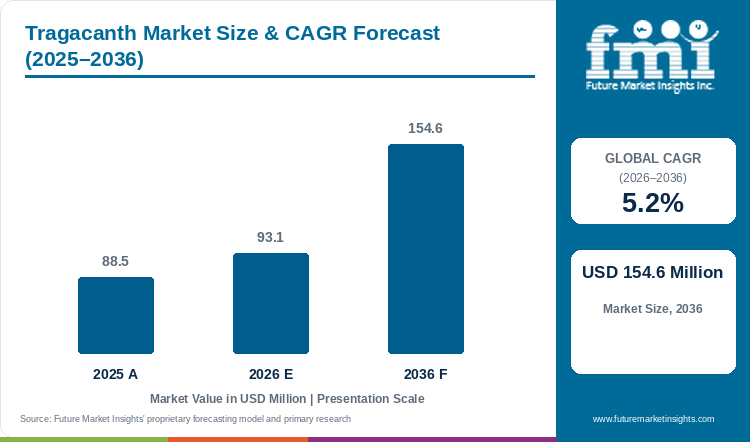
From a 2025 baseline of USD 88.5 million, global tragacanth market valuation climbs to USD 93.1 million for 2026 and is forecast to attain USD 154.6 million by the end of 2036 at a 5.2% CAGR.
Condiment and acid-dressing formulators with pharmaceutical suspension compounders face strict emulsion-stability requirements below pH 3.0 where conventional dairy proteins and modified starches hydrolyze and separate. Global tragacanth market value equaled USD 88.5 million across 2025 while reaching USD 93.1 million for 2026. Analysis by FMI reveals that ten-year projections place total market value at USD 154.6 million by 2036, reflecting a 5.2% CAGR across the 2026 to 2036 horizon and creating USD 61.5 million in incremental opportunity. White and Amber Ribbon Grades capture 53.6% of 2026 exudate form valuation, since premium hand-graded Astragalus gummifer ribbons deliver peak bassorin-to-tragacanthin gel yield after cryogenic milling. Per an August 2025 formulation study in Molecules, stabilizing egg-free canola-oil mayonnaise with 1.0% gum tragacanth and 25% aquafaba maximized emulsion viscosity and firmness with 28-day cold-storage stability at 4 degrees Celsius. That acid-resistant bifunctional rheology separates tragacanth demand from the gum arabic exudates category at an 8.0% CAGR, because acacia gum requires high 10% to 20% beverage weights whereas tragacanth builds pseudoplastic yield stress at 0.2% to 0.8% dosing. European and US hydrocolloid processors are fortifying ethical traceability and organic quality audits to convert that demand, as Alland and Robert secured its second consecutive EcoVadis Gold rating among the top 5% of rated firms in July 2025. Furthermore, Norevo Produktion GmbH renewed its DE-OKO-001 organic processing certification in March 2026 while Kerry Group reported EUR 6.76 billion in 2025 group results in February 2026. Condiment and pharmaceutical buyers lock in annual contracts on verified bassorin viscosity and microbiological purity, and importers holding multi-season highland exudate buffer stocks retain those accounts through 2036.
Key Market Trends & Insights
- By exudate form: White and Amber Ribbon Grades capture 53.6% of 2026 demand because primary ribbon tapping yields low-ash, high-viscosity bassorin gels.
- By end-use application: Acid-Stable Salad Dressings and Sauces with Sugar Paste represent 46.4% in 2026 as E413 resists acetic and citric acid hydrolysis down to pH 2.0.
- By grade: Food and Confectionery FCC Grade accounts for 57.8% in 2026 because commercial dressing and relish with fondant plants purchase the largest tonnage.
- By distribution channel: Direct B2B Food and Beverage Processor Contracts secure 57.5% in 2026 through custom Brookfield viscosity and mesh calibration.
- By certification & packaging: Non-GMO with Kosher and Halal Certified grades hold 65.3% in 2026, while 25 kg Multi-Wall Kraft Bags and Fiber Drums represent 51.4% of bulk packaging.
Regional Highlights
- Top national expansion: Turkey heads country-level growth forecasts at 5.9% annually through 2036 as an Anatolian Astragalus harvesting and grading with confectionery processing hub.
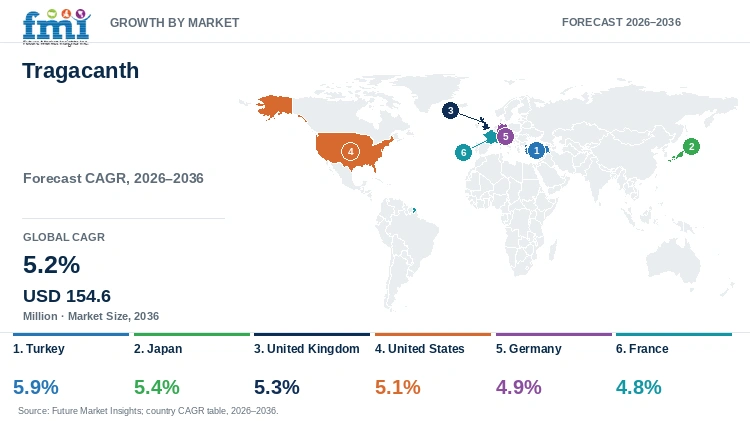
- Broader country progression: Japan follows at 5.4% annual growth before the United Kingdom at 5.3% and the US at 5.1%, while Germany registers 4.9% and France records 4.8%.
Market Size & Forecast
Table 1: Market Size and Forecast for the Tragacanth Market (USD million and CAGR percentage), 2025 to 2036
| Metric | Value |
|---|---|
| 2025 Market Size | USD 88.5 million |
| Estimated Market Size in 2026 | USD 93.1 million |
| Projected Market Size by 2036 | USD 154.6 million |
| CAGR, 2026 to 2036 | 5.2% |
| Added Market Value, 2026 to 2036 | USD 61.5 million |
Commercial dressing and condiment producers with oral suspension manufacturers require natural hydrocolloids that maintain zero phase separation across freeze-thaw shipping and acidic shelf storage. Unlike single-fraction gums, Astragalus exudate combines water-soluble tragacanthin (~30% to 40%) for surface-active droplet emulsification with water-swellable bassorin (~60% to 70%) for three-dimensional gel network suspension. Per federal food additive rule 21 CFR 184.1351 as current in October 2026, Food Chemicals Codex gum tragacanth is affirmed as GRAS at up to 0.7% in condiments and relishes plus 0.8% in gravies and sauces and 1.3% in fats and oils. Consequently, formulation chemists blend E413 with gum hydrocolloid stabilizers to prevent oil coalescence in clean-label vinaigrettes.
Treated Emulsion & Suspension Volume and Exudate Sizing
Table 2: Treated Product Volume and Exudate Tonnage Sizing for the Tragacanth Market (USD million and operational ranges), 2025 to 2036
| Metric | 2025 | 2026 | 2036 |
|---|---|---|---|
| Market size (USD million) | 88.5 | 93.1 | 154.6 |
| Treated food, pharma, cosmetic & technical output (thousand MT) | 465.0 to 520.0 | 490.0 to 548.0 | 785.0 to 880.0 |
| Commercial graded ribbon, flake & E413 powder volume (metric tons) | 2,680 to 2,980 | 2,820 to 3,130 | 4,450 to 4,960 |
| Average realized price per kilogram across grades (USD/kg) | 29.7 to 33.0 | 29.7 to 33.0 | 31.2 to 34.7 |
Operational note: Treated-product ranges apply 21 CFR 184.1351 permitted 0.2% to 0.8% food dosing and 0.5% to 2.0% pharmaceutical suspension and fondant binder inclusion rates.
Artisanal and industrial cake decorators with lozenge tableters and leather craft finishers rely on tragacanth's film-forming elasticity and rapid moisture release during drying. European and US botanical processors mill imported Anatolian and Zagros highland ribbons into standardized 100-mesh to 200-mesh powders with karaya gum and acacia hydrocolloids.
Per Capita & Industrial Emulsion Line Sizing
Table 3: Per Capita and Industrial Line Valuation Indicators for the Tragacanth Market (USD), 2025 to 2036
| Metric | 2025 | 2026 | 2036 |
|---|---|---|---|
| World population (billion) | 8.2 | 8.3 | 9.0 |
| Market value per 1,000 people (USD) | 10.8 | 11.2 | 17.2 |
| Annual valuation per contracted processing facility (USD thousand) | 16.8 to 19.2 | 17.6 to 20.2 | 27.5 to 31.5 |
| Non-GMO, Kosher & Halal certified share (%) | 63.8% to 64.5% | 65.3% | 72.0% to 75.5% |
Table 4: Industrial Channel & Certification Valuation Indicators for the Tragacanth Market (USD and percentages), 2026
| Metric | Value | Institutional Reference Basis |
|---|---|---|
| Market size, 2026 | USD 93.1 million | 2026 global market value baseline |
| Contracted food, pharma & cosmetic plants global | 4,950 plants | Sauce, confectionery, pharma & personal-care lines |
| Market value per contracted facility | USD 18,808.1 | Annualized tragacanth procurement |
| Direct B2B Processor Contracts valuation, 2026 | USD 53.5 million | 57.5% distribution channel allocation |
Vegan salad dressing and oral pediatric suspension formulas without egg yolk or synthetic polysorbates require hydrocolloids that lower interfacial tension while thickening the aqueous phase. Processors pair fine-mesh E413 powder with xanthan gum or galactomannans to achieve complementary pseudoplastic pourability.
Analyst Perspective
"Procurement directors in acid condiments and sugar-paste confectionery with pharmaceutical suspensions stay loyal to gum tragacanth because its dual bassorin-tragacanthin structure emulsifies and suspends at pH levels that break down standard hydrocolloids. Suppliers that combine multi-origin Anatolian and Iranian ribbon inventory with microbiological heat-treatment and Kosher-Halal certification win multi-year direct B2B contracts."
- Nandini Roy Choudhury, Principal Consultant, Future Market Insights.
How is the tragacanth market segmented?
The tragacanth market is segmented by exudate form and end-use application plus grade and distribution channel with certification and packaging format. In 2026, White and Amber Ribbon Grades hold 53.6% and Acid-Stable Salad Dressings and Sauces with Sugar Paste represent 46.4%. Food and Confectionery FCC Grade accounts for 57.8% and Direct B2B Contracts command 57.5%, while Non-GMO/Kosher/Halal Certified holds 65.3% and 25 kg Kraft Bags and Fiber Drums capture 51.4%.
By exudate form: White and Amber Ribbon Grades plus Sari and Flake Exudate Grades with Fine Mesh Milled Powder E413.
By end-use application: Acid-Stable Salad Dressings and Sauces with Sugar Paste plus Pharmaceutical Suspensions and Lozenge Binders withCosmetic Lotions and Textile Print Pastes.
By grade: Food and Confectionery FCC Grade plus USP/EP Pharmaceutical Grade and Technical Grade.
By distribution channel: Direct B2B Food and Beverage Processor Contracts plus Specialty Food Ingredient Distributors and Retail e-Commerce Channels.
By certification & packaging: Non-GMO with Kosher and Halal Certified versus Standard Conventional Specification, packed in 25 kg Multi-Wall Kraft Bags and Fiber Drums or 1000 L IBC Totes and Small-Batch Foil Pouches.
Why do White and Amber Ribbon Grades lead the exudate form category?
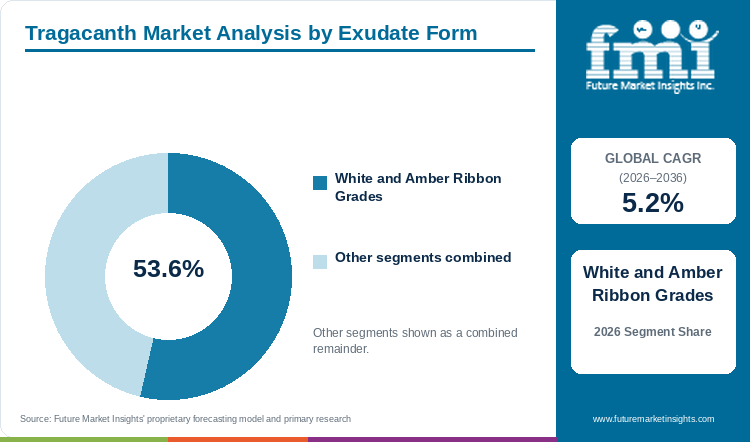
White and Amber Ribbon Grades hold an estimated 53.6% of exudate form value in 2026, anchored by superior cold-water viscosity and low bark impurity.
Table 5: Exudate Form Share for the Tragacanth Market (percentage share), 2026
| Exudate Form | Share (2026) |
|---|---|
| White and Amber Ribbon Grades | 53.6% |
| Sari, Flake, and Fine Mesh Milled Powder E413 Combined | 46.4%* |
| Total | 100.0% |
*Note: Sari and Flake Exudate Grades with Fine Mesh Milled Powder E413 constitute the other 46.4% of 2026 tragacanth form share.
Table 6: Exudate Form Leadership and Market Growth for the Tragacanth Market (segment and CAGR percentage), 2026 to 2036
| Metric | Value |
|---|---|
| Global CAGR (2026 to 2036) | 5.2% |
| Leading Segment | White and Amber Ribbon Grades |
Hand-incised Astragalus stems exude flat, translucent white and pale-amber ribbons that dry rapidly in arid mountain air, preserving high molecular weight galacturonic acid and fucose chains with minimal soil contamination. European and US botanical mills import ribbon No. 1 through No. 3 grades with guar gum splits to custom-grind high-viscosity FCC and USP lots that command a 40% to 80% price premium over darker sari flakes.
- White and Amber Ribbon Grades hold 53.6% of exudate form valuation in 2026 because high bassorin content delivers peak apparent viscosity at half the dosage of flake grades.
- The US FDA Substances Added to Food inventory updated in July 2026 lists Astragalus gum tragacanth (CAS 9000-65-1, FEMA 3079) as an authorized emulsifier and flavor adjuvant plus stabilizer and surface-finishing thickener.
What sustains Acid-Stable Salad Dressings and Sauces with Sugar Paste in end-use application?
Acid-Stable Salad Dressings and Sauces with Sugar Paste represent 46.4% of end-use application demand in 2026, driven by vinegar-resistant rheology and fondant elasticity.
Because tragacanth's galacturonic acid backbone resists acid-catalyzed cleavage at pH 2.0 to 3.5, pourable herb vinaigrettes and hot chili sauces with relish marinades maintain uniform spice-particle suspension throughout 12-month ambient shelf life. In confectionery, sugar-paste and gum-paste manufacturers blend tragacanth with carrageenan gum or gelatin to impart tensile rollability for detailed floral cake decorations.
- Acid-Stable Salad Dressings and Sauces with Sugar Paste represent 46.4% of 2026 application demand as clean-label condiment and bakery icing brands replace synthetic propylene glycol alginates.
- In November 2025, carbohydrate chemists at Fujian Agriculture and Forestry University reported in Carbohydrate Polymers that a 1 to 5 konjac glucomannan-to-tragacanth gum mass ratio produced optimal Pickering emulsion stability and extended fresh fruit shelf life by 10 days.
How does Food and Confectionery FCC Grade lead the grade category?
Food and Confectionery FCC Grade accounts for 57.8% of grade demand in 2026, supported by global E413 and Food Chemicals Codex compliance.
Food and Confectionery FCC Grade tragacanth undergoes optical sorting and dry-steam microbial reduction with standardized mesh milling to satisfy Food Chemicals Codex limits on heavy metals and acid-insoluble ash with Salmonella absence. Multinational manufacturers of sauces and condiments specify FCC Grade E413 across plant-based dressings and low-pH fruit fillings with compressed mint lozenges.
- Food and Confectionery FCC Grade secures 57.8% of grade value in 2026 because industrial condiment and icing with citrus beverage emulsions represent the primary global volume.
- Research published by Food Science and Nutrition in July 2026 showed that tragacanth gum biocomposite films reinforced with 0.5% marine algal polysaccharides achieved 20.00 mm antibacterial inhibition zones against Escherichia coli and Bacillus cereus while improving UV barrier strength.
Why do Direct B2B Food and Beverage Processor Contracts lead distribution channels?
Direct B2B Food and Beverage Processor Contracts command 57.5% of distribution channel share in 2026, anchored by batch-specific viscosity standardization.
Wild-harvested Astragalus exudates exhibit natural lot-to-lot swings in tragacanthin-to-bassorin ratios depending on altitude and tapping month with botanical subspecies across Turkey and Iran. Consequently, multi-plant condiment and pharmaceutical buyers contract directly with primary hydrocolloid processors supplying food stabilizer systems to lock in blended lots pre-tested for exact Brookfield spindle viscosity and hydration time.
- Direct B2B Food and Beverage Processor Contracts command 57.5% of channel valuation in 2026 because industrial buyers require guaranteed multi-quarter buffer stocks and custom mesh sizing.
- In June 2025, pharmaceutical technologists reporting in Pharmaceutical Development and Technology demonstrated that freeze-dried Astragalus gossypinus gum tragacanth sponges combined with nanoclay and tranexamic acid significantly accelerated whole-blood coagulation and prothrombin times without cytotoxicity.
How do Clean-Label Certifications and 25 kg Kraft Bags shape procurement specs?
Non-GMO with Kosher and Halal Certified grades capture 65.3% of certification demand in 2026, while 25 kg Multi-Wall Kraft Bags and Fiber Drums hold 51.4% of packaging volume.
Global condiment and confectionery with pharmaceutical excipient tenders require triple Non-GMO and Kosher Pareve with Halal certification plus ethical botanical origin audits so a single SKU can ship across North America and Europe with the Middle East. For dry plant handling, clean-label ingredients processors favor poly-lined 25 kg multi-wall kraft bags and fiber drums that protect hygroscopic E413 powder against caking during maritime transit.
- Non-GMO with Kosher and Halal Certified specifications represent 65.3% of 2026 demand, while 25 kg Multi-Wall Kraft Bags and Fiber Drums account for 51.4% of packaging formats.
- In August 2026, pharmaceutical scientists at the Federal University of Rio Grande do Sul reported in AAPS PharmSciTech that tragacanth gum hydrogels loaded with 185.66 nm polymeric azelaic acid nanocapsules maintained skin-compatible pH 3.56 and pseudoplastic Herschel-Bulkley flow with a 75% anti-inflammatory reduction.
What are the drivers, restraints, and opportunities in the tragacanth market?
In the tragacanth market, clean-label acid-emulsion reformulation and pharmaceutical suspension demand drive adoption whereas wild highland harvesting constraints limit raw supply and biomedical hydrogel and 3D-bioprinting applications enable high-margin growth.
- Driver: Clean-label demand for egg-free acid-stable dressings and artisanal sugar pastes with natural pharmaceutical suspension binders sustains procurement of FCC and USP tragacanth.
- Restraint: Labor-intensive manual stem incision across arid Anatolian and Zagros highland shrubs creates seasonal supply ceilings and high per-kilogram price premiums over xanthan or guar gum.
- Opportunity: Commercial expansion of USP/EP pharmaceutical hydrogel and mucoadhesive nanocapsule matrices with 3D-printed dysphagia bioink formulations enables high-margin specialty grades.
Growth Analysis and Future Potential: Qualitative Demand Catalysts
Plant-based food reformulators and specialty pharmaceutical compounders are turning to multifunctional botanical exudates that deliver simultaneous emulsification and suspension with film formation under harsh pH and ionic conditions. When vegan dressing manufacturers remove egg yolk lecithin, ordinary thickening gums fail to prevent oil-droplet coalescence without synthetic polysorbate emulsifiers. Gum tragacanth's protein-arabinogalactan fraction adsorbs onto oil droplets while its bassorin fraction builds a shear-thinning aqueous gel network, supporting specialty digital textile printing pastes and leather burnishing gums with food emulsions alike. In November 2025, biopolymer researchers in Polymers documented how tragacanth's anionic galacturonic acid and fucose architecture enables tunable viscosity and mucoadhesion across functional food and drug-delivery matrices.
Risk Assessment of the Tragacanth Market: Operational and Formulation Friction
Geographic concentration of wild Astragalus gummifer and Astragalus microcephalus stands in mountainous regions of Iran and Turkey, coupled with slow cold-water hydration kinetics, creates the main supply and processing bottleneck across the tragacanth sector. Unlike fermentation-derived xanthan gum that hydrates rapidly from standardized corn-syrup bioreactors, natural tragacanth requires 12 to 24 hours of ambient swelling or high-shear heating at 50 degrees Celsius to reach full bassorin viscosity. Furthermore, rural labor migration away from thorny highland shrub tapping tightens raw ribbon availability after dry winters. In April 2025, polymer chemists writing in Int. J. Biol. Macromol. hydrogel studies proved that tragacanth gum-collagen-polyurethane hydrogels required 40 wt% polysaccharide loading to achieve 42% crosslinking and pH-stable viscoelastic resistance.
Commercial Opportunity Analysis: Formulation Differentiation and Value-Add Formats
Hydrocolloid refiners and biomedical excipient suppliers capture premium margins by developing pre-hydrated instant-dispersible E413 powders and co-processed binary gum blends with pharmaceutical-grade hydrogel matrices. Binary formulation of low-dose tragacanth with acacia gum or konjac glucomannan and lactoferrin allows food and biomedical formulators to cut total hydrocolloid cost while enhancing shear-thinning yield stress. In February 2026, bioengineers reporting in Gels highlighted that tragacanth gum's spontaneous gelation and shear-thinning bassorin-tragacanthin fractions significantly improve extrusion printability and shape fidelity in 3D bioprinting bioinks. Similarly, April 2025 experimental work in Int. J. Biol. Macromol. drug-delivery trials confirmed that incorporating tragacanth gum into UV-crosslinked GelMA hydrogels increased swelling from 500 to 1,200 times and more than tripled compressive strength from 15 kPa to 49 kPa for sustained drug delivery.
Tragacanth Market by Country (2026 to 2036)
National demand modeling shows Turkey pacing tragacanth growth at 5.9% per year through 2036, ahead of Japan at 5.4% and UK buyers at 5.3%. Commercial progression across Anatolian botanical processing hubs and East Asian pharmaceutical suspension lines with Western clean-label condiment plants depends on certified FCC and USP ribbon supply.
Table 7: Country CAGR and Primary Growth Levers for the Tragacanth Market (CAGR percentage and operational drivers), 2026 to 2036
| Country | CAGR (2026 to 2036) | Primary Growth Lever |
|---|---|---|
| Turkey | 5.9% | Domestic Anatolian Astragalus harvesting, Halal confectionery, and export milling across 58,357 food firms |
| Japan | 5.4% | Kampo pharmaceutical suspension, traditional wagashi confectionery, and leathercraft edge burnishing |
| United Kingdom | 5.3% | Royal-icing sugar paste, cake-decorating fondant, and clean-label private-label salad dressings |
| United States | 5.1% | 21 CFR 184.1351 acid-stable condiment, pourable dressing, and USP oral suspension manufacturing |
| Germany | 4.9% | Hamburg botanical gum refining, organic bio-certified milling, and phytopharmaceutical lozenges |
| France | 4.8% | Artisanal patisserie pastillage, gourmet mustard-vinaigrette emulsions, and dermocosmetic lotions |
Source: Future Market Insights analysis
Turkey Tragacanth Market Outlook (2026 to 2036)
National tragacanth demand in Turkey is forecast to climb at a market-leading 5.9% annual pace through 2036 because the nation functions both as a primary native harvesting origin for Anatolian Astragalus species (known locally as kitre) and as a major lokum confectionery and textile-printing consumer. Unlike import-dependent Western nations, domestic processors in Istanbul and Gaziantep with Izmir source highland ribbons directly from Central and Eastern Anatolian collectors for Halal-certified food and pharmaceutical milling. March 2025 findings from the USDA Foreign Agricultural Service in Turkiye indicate that the national food and beverage manufacturing sector encompasses nearly 58,357 businesses and actively expands natural hydrocolloid and export ingredient processing. Local exporters also supply traditional Ebru paper-marbling and textile thickeners.
Key takeaway: In Turkey, indigenous Anatolian Astragalus harvesting and expanding Halal confectionery and export milling are projected to sustain a 5.9% annual growth rate.
Japan Tragacanth Market Outlook (2026 to 2036)
Demand in Japan posts a projected 5.4% annual pace from 2026 through 2036, supported by specialized demand across pharmacopeial oral suspensions and traditional wagashi sugar-craft with vegetable-tanned leather edge burnishing pastes. What distinguishes Japan from Western condiment-heavy markets is its high-margin application of fine-mesh tragacanth in Kampo herbal tablet binding and dysphagia-friendly thickening gels with quasi-drug toothpaste emulsions. Data from the June 2026 USDA Exporter Guide for Japan show that the national food market reached USD 421 billion with retail food valuation totaling USD 286 billion in 2025 across quality-focused supermarkets and drugstores. Domestic botanical importers in Tokyo and Osaka enforce strict low-ash and microbiological limits on imported white ribbon grades.
Key takeaway: In Japan, pharmaceutical lozenge and dysphagia gel formulation with traditional confectionery and leathercraft use are forecast to sustain 5.4% CAGR growth.
United Kingdom Tragacanth Market Outlook (2026 to 2036)
United Kingdom tragacanth demand is projected to grow by 5.3% annually through 2036, anchored by the nation's global leadership in commercial sugar-paste and cake-decorating fondant gums with clean-label supermarket table sauces. Domestic bakery-icing manufacturers and retail foil-pouch packers in the UK rely on E413 to transform brittle icing sugar into pliable and fast-drying modeling paste for celebration cakes. Per the October 2026 USDA Retail Foods Annual assessment for the United Kingdom, national retail grocery valuation reached USD 343 billion in 2026 with supermarket private labels capturing a record 52.2% market share. Major UK grocery private-label charters actively favor natural E413 over synthetic carboxymethylcellulose in premium vinaigrettes and relishes.
Key takeaway: In the United Kingdom, commercial sugar-paste fondant production and supermarket private-label sauce reformulation are forecast to underpin 5.3% annual expansion.
United States Tragacanth Market Outlook (2026 to 2036)
Demand for tragacanth across the United States is anticipated to rise at 5.1% annually between 2026 and 2036 across industrial pourable salad dressings and hot-pepper sauces with USP compounded oral drug suspensions. Unlike European markets governed by E-number perceptions, formulators in the United States operate under 21 CFR 184.1351 GRAS affirmation and clean-label foodservice checklists that permit vegetable gum declarations on ingredient panels. In August 2026, food scientists reporting in Food Research International demonstrated that high-internal-phase Pickering emulsions stabilized with Astragalus polysaccharide complexes at a 77.5% oil fraction achieved high storage modulus and IDDSI Level 6 dysphagia compliance. Domestic hydrocolloid blenders including Ingredients Solutions and Gum Technology supply pre-tested FCC and USP powders.
Key takeaway: In the United States, 21 CFR 184.1351 acid-sauce stabilization and USP pharmacy compounding are anticipated to anchor steady B2B contract demand.
Germany Tragacanth Market Outlook (2026 to 2036)
Germany records a projected 4.9% annual expansion rate over the 2026 to 2036 period because the Port of Hamburg operates as Europe's primary botanical exudate importing and optical-cleaning with cryogenic-milling hub. Hamburg-based hydrocolloid specialists including Norevo GmbH and Willy Benecke GmbH refine raw Middle Eastern ribbons into standardized European Pharmacopoeia and Food Chemicals Codex powders for continental food and phytopharmaceutical with natural-cosmetic manufacturers. September 2026 figures from the USDA Retail Foods Annual report on Germany show that national retail food valuation reached USD 323.8 billion while agricultural imports climbed to USD 172.4 billion amid strong demand for organic and clean-label condiments. Domestic herbal throat-lozenge and certified-natural skincare brands provide stable baseline contracts.
Key takeaway: In Germany, Hamburg botanical gum refining infrastructure and certified-natural pharmaceutical and cosmetic manufacturing are expected to maintain 4.9% annual growth.
France Tragacanth Market Outlook (2026 to 2036)
France is projected to register a 4.8% CAGR through 2036 as artisanal patisseries and Dijon mustard vinaigrette emulsifiers with dermo-cosmetic laboratories specify botanical exudates over synthetic acrylates. Culinary and confectionery institutes across France mandate gum tragacanth for pastillage architectural sugar sculptures and dragee coating, while clean-label grocery retailers restrict modified starches in chilled sauces. Per the September 2026 USDA Foreign Agricultural Service Retail Foods Annual report on France, large general food retailers accounted for 58.6% of national food retail volume in 2025 while specialized food stores and commercial artisans held 20.4%. Normandy-based hydrocolloid specialist Alland and Robert S.A. reinforces domestic technical support and sustainable botanical gum blending across European accounts.
Key takeaway: In France, artisanal patisserie pastillage traditions and clean-label vinaigrette and dermo-cosmetic emulsions are likely to sustain 4.8% CAGR progression.
Full report country CAGRs cover: North America; Latin America; Western Europe; Eastern Europe; East Asia; South Asia and Pacific; Middle East and Africa.
Who are the notable companies in the tragacanth market?
Notable suppliers active across the tragacanth market include Norevo GmbH and Kerry Group plc with Ingredients Solutions, Inc. and Alland & Robert S.A. Willy Benecke GmbH and Hawkins Watts Limited with Gum Technology Corporation also supply graded botanical exudates.
Commercial structure across the tragacanth sector divides European botanical exudate importers and refiners from US specialty hydrocolloid custom blenders and multinational functional systems houses. Norevo GmbH and Willy Benecke GmbH with Alland and Robert S.A. procure and mill raw botanical gums into FCC and E413 with Ph. Eur. specifications. Ingredients Solutions, Inc. and Gum Technology Corporation with Hawkins Watts Limited engineer customized dressing and bakery stabilizer blends, while Kerry Group plc integrates hydrocolloids into global foodservice and retail sauce systems.
- European Botanical Exudate Refiners and Millers: Norevo GmbH and Willy Benecke GmbH with Alland & Robert S.A. manage origin sourcing and optical cleaning with microbial reduction and standardized mesh milling in Germany and France.
- Specialty Hydrocolloid Custom Blenders: Ingredients Solutions, Inc. and Gum Technology Corporation formulate calibrated FCC and USP tragacanth powders and binary Coyote Brand stabilizer systems.
- Global Functional Systems and Regional Formulation Houses: Kerry Group plc and Hawkins Watts Limited integrate tragacanth and complementary hydrocolloids into turnkey dressing and confectionery with beverage texture solutions.
Competitive Benchmarking: Tragacanth Market
Table 8: Competitive Benchmarking for the Tragacanth Market (qualitative capability ratings), 2026
| Company | Origin Ribbon Sourcing & Milling | FCC & USP/EP Grade Compliance | Custom Emulsion & Blend Support | Geographic Reach |
|---|---|---|---|---|
| Norevo GmbH | High | High | High | Germany, Europe, and global Quick Gum and botanical exudate refining |
| Kerry Group plc | Medium | High | High | Global taste and nutrition centers across Europe, Americas, and Asia-Pacific |
| Ingredients Solutions, Inc. | High | High | High | United States and Canada specialty hydrocolloid custom standardization |
| Alland & Robert S.A. | High | High | High | France, Europe, and global natural plant exudate R&D and EcoVadis Gold CSR |
| Willy Benecke GmbH | High | High | Medium | Hamburg botanical gum processing hub serving European and export accounts |
| Hawkins Watts Limited | Medium | High | High | Australia, New Zealand, and Asia-Pacific texture and emulsion formulation labs |
| Gum Technology Corporation | Medium | High | High | United States Coyote Brand hydrocolloid blends for dressings, sauces, and bakery |
Scoring basis: Origin Ribbon Sourcing & Milling evaluates direct Middle Eastern Astragalus ribbon procurement and optical sorting with cryogenic mesh grinding, whereas FCC & USP/EP Grade Compliance rates pharmacopeial and Food Chemicals Codex certification. Custom Emulsion & Blend Support measures application-lab capability to co-blend tragacanth with acacia or xanthan and guar gums.
Key Developments in the Tragacanth Market
- Alland & Robert S.A. earned its second consecutive EcoVadis Gold CSR rating in the top 5% of assessed suppliers on July 28, 2025 and presented its low-carbon Beyond Acacia hydrocolloid range at Gulfood Manufacturing in October 2025.
- Norevo Produktion GmbH renewed its DE-OKO-001 organic processing and trading certification in Möhnsen, Germany on March 11, 2026 covering natural botanical food ingredients.
- Kerry Group plc reported EUR 6.76 billion in 2025 annual group results with 3.5% Food end-use market volume growth on February 17, 2026, while Hawkins Watts published its 2026 sensory and fiber hydrocolloid formulation trends in January 2026.
Key Players in the Tragacanth Market
European Botanical Exudate Refiners and Millers
- Norevo GmbH
- Willy Benecke GmbH
- Alland & Robert S.A.
North American Specialty Hydrocolloid Custom Blenders
- Ingredients Solutions, Inc.
- Gum Technology Corporation
Global Functional Systems and Regional Formulation Houses
- Kerry Group plc
- Hawkins Watts Limited
Tragacanth Market - Report Scope
Table 9: Report Scope for the Tragacanth Market (coverage fields and definitions), 2026 to 2036
| Coverage field | Report scope |
|---|---|
| Market breakdown | Exudate Form; End-Use Application; Grade; Distribution Channel; Clean-Label and Certification Status; Packaging Bulk Format; Region |
| Quantitative Units | USD Million |
| Market Definition | Includes commercial B2B and specialty valuation from natural gum tragacanth exudates harvested from Astragalus species (primarily Astragalus gummifer and Astragalus microcephalus, CAS 9000-65-1, E413, INS 413, 21 CFR 184.1351) across hand-sorted white and amber ribbons, sari and flake grades, and fine-mesh milled powders. Category Scope Note: Excludes Sterculia urens karaya gum (E416), Acacia senegal/seyal gum arabic (E414), and Cochlospermum gossypium kutira gum. |
| Regions Covered | North America; Latin America; Western Europe; Eastern Europe; East Asia; South Asia and Pacific; Middle East and Africa |
| Countries Covered | Turkey, Japan, United Kingdom, United States, Germany, France, and additional countries in the full report |
| Key Companies Covered | Norevo GmbH, Kerry Group plc, Ingredients Solutions, Inc., Alland & Robert S.A., Willy Benecke GmbH, Hawkins Watts Limited, Gum Technology Corporation |
| Forecast Period | 2026 to 2036 |
| Approach | Primary and secondary research with top-down and bottom-up market triangulation. |
Tragacanth Market - Research Methodology
Table 10: Research Methodology for the Tragacanth Market (research methods and approach), 2026 edition
| Method | Approach |
|---|---|
| Primary Research | Structured interviews with Anatolian and European botanical gum traders, Hamburg cryogenic milling directors, condiment rheology chemists, and pharmaceutical excipient QA managers to validate ribbon-to-powder yield and Brookfield viscosity tiers. |
| Secondary Research | Analysis of US FDA 21 CFR 184.1351 and EAFUS food substance records, Food Chemicals Codex and European Pharmacopoeia E413 monographs, USDA FAS Retail Foods and Food Processing Ingredients reports, and peer-reviewed hydrocolloid studies. |
| Market Sizing and Forecasting | Top-down specialty botanical exudate baselines reconciled against bottom-up graded ribbon, flake, and E413 powder tonnage (2,820 to 3,130 MT in 2026) and grade-weighted USD/kg realized prices from 2026 to 2036. |
| Country Forecasting Model | Econometric national projections weight acid-sauce and dressing output, artisanal sugar-paste and patisserie demand, pharmacopeial suspension compounding, and botanical refining capacity across six focal countries. |
| Operational Benchmark Traceability | Treated-emulsion tonnage and facility procurement indicators in Tables 2, 3, and 4 trace to 21 CFR 184.1351 maximum usage percentages, Molecules and Carbohydrate Polymers emulsion dosing assays, and USDA FAS national registries. |
| Data Triangulation and Validation | Valuation figures isolate authentic Astragalus tragacanth acrossFCC, USP/EP, and technical grades while strictly excluding look-alike Sterculia karaya, acacia, and xanthan gums. |
Tragacanth Market by Segments
Tragacanth Market segmented by Exudate Form:
- White and Amber Ribbon Grades
- Sari and Flake Exudate Grades
- Fine Mesh Milled Powder E413
Tragacanth Market segmented by End-Use Application:
- Acid-Stable Salad Dressings, Sauces, and Sugar Paste
- Pharmaceutical Suspensions and Lozenge Binders
- Cosmetic Lotions, Toothpastes, and Hair Creams
- Textile Print Pastes and Leather Edge Burnishing
Tragacanth Market segmented by Grade:
- Food and Confectionery FCC Grade
- USP/EP Pharmaceutical Grade
- Technical Grade
Tragacanth Market segmented by Distribution Channel:
- Direct B2B Food and Beverage Processor Contracts
- Specialty Food Ingredient Distributors
- Retail and e-Commerce Channels
Tragacanth Market segmented by Clean-Label and Certification Status:
- Non-GMO, Kosher, and Halal Certified
- Standard Conventional Specification
Tragacanth Market segmented by Packaging Bulk Format:
- 25 kg Multi-Wall Kraft Bags and Fiber Drums
- 1000 L IBC Totes and Bulk Tankers
- Small-Batch Foil Pouches and Pails
Tragacanth Market by Region
- North America
- United States
- Canada
- Latin America
- Brazil
- Mexico
- Argentina
- Chile
- Western Europe
- Germany
- France
- United Kingdom
- Italy
- Spain
- Benelux
- Nordics
- Eastern Europe
- Poland
- Czech Republic
- Romania
- Hungary
- East Asia
- China
- Japan
- South Korea
- South Asia and Pacific
- India
- ASEAN
- Australia and New Zealand
- Middle East and Africa
- GCC Countries
- South Africa
- Türkiye
- Israel
Research Sources and Bibliography
- [1] Shafique, B., Murtaza, M. A., Farid, M. S., Ameer, K., Hussain, M. I., Sienkiewicz, M., Lichota, A., & Lopusiewicz, L. (2025, August 27). Development and Evaluation of Egg-Free Mayonnaise Stabilized with Aquafaba and Gum Tragacanth: Functional, Sensory, and Storage Properties. Molecules, 30(17), 3511 (PubMed PMID 40942039).
- [2] Dogra, S., Yadav, D., Koul, B., & Rabbee, M. F. (2025, November 27). Plant-Based Polysaccharide Gums as Sustainable Bio-Polymers: Focus on Tragacanth Gum and Its Emerging Applications. Polymers, 17(23), 3163 (PubMed PMID 41374850).
- [3] Alland & Robert S.A. (2025, July 28). In 2025, Alland & Robert obtains the EcoVadis gold medal for the 2nd year in a row. Alland & Robert Corporate News.
- [4] Kiwa BCS Oko-Garantie GmbH. (2026, March 11). Certificate pursuant to Article 35(1) of Regulation (EU) 2018/848 on organic production: Norevo Produktion GmbH. Norevo GmbH Quality Certifications.
- [5] Kerry Group plc. (2026, February 17). Kerry Group Preliminary Statement of Results for the year ended 31 December 2025. Kerry Group plc Media Releases.
- [6] U.S. Food and Drug Administration. (2026, October 14). 21 CFR 184.1351 Gum tragacanth: Direct food substances affirmed as generally recognized as safe. Electronic Code of Federal Regulations.
- [7] U.S. Food and Drug Administration. (2026, July 28). Substances Added to Food Inventory: Tragacanth, Gum (Astragalus spp.), CAS Reg. No. 9000-65-1. U.S. Department of Health and Human Services FDA.
- [8] Mousavai, M., Khajavi, R., Kalaee, M., & Rahimi, M. K. (2025, June 12). Gum tragacanth-based hemostatic sponge for enhanced hemostasis in dental surgery. Pharmaceutical Development and Technology, 30(5), 666-690 (PubMed PMID 40476591).
- [9] Benin, T., Gomes, G. S., Ferreira, E. C. J., Palma, V. M., Alves, A. C. S., Visioli, F., Pohlmann, A. R., Guterres, S. S., & Frank, L. A. (2026, August 19). Polymeric Azelaic Acid-loaded Nanocapsules Incorporated into Tragacanth Gum: Development and Biological Evaluation in Alternative Models for the Treatment of Rosacea. AAPS PharmSciTech, 27(7), 260 (PubMed PMID 42618843).
- [10] Bahrami Freadooni, S., Nateghi, L., Mazaheri, M., Rashidi, L., & Vafaee, M. (2026, July 10). Edible Biocomposite Films From Tragacanth and Apricot Gums Reinforced With Marine Algal Polysaccharides: Development, Characterization, and Antibacterial Efficacy. Food Science & Nutrition, 14(7), e72103 (PubMed PMID 42434327).
- [11] Li, M., Wei, H., Wang, X., Wang, Y., Lei, X., Dai, O., Wen, C., & Pang, J. (2025, November 15). Performance of konjac glucomannan/tragacanth gum-stabilized eugenol particles in konjac glucomannan/chitosan films and their application in blueberry preservation. Carbohydrate Polymers, 368(Pt 1), 124117 (PubMed PMID 40912807).
- [12] Dogra, S., Koul, B., Arukha, A. P., & Rabbee, M. F. (2026, February 7). 3D Printing with Tragacanth-Gum-Based Bioinks: A New Frontier in Bioprinting Materials. Gels, 12(2), 152 (PubMed PMID 41745023).
- [13] Leon-Campos, M. I., Claudio-Rizo, J. A., Becerra-Rodriguez, J. J., Gonzalez-Diaz, M. O., Flores-Guia, T. E., Soriano-Corral, F., & Herrera-Guerrero, A. (2025, April 16). Novel tragacanth gum-collagen-polyurethane hydrogels: Super-swelling, antibacterial, and fibrillogenesis-enhancing properties for efficient wound healing. International Journal of Biological Macromolecules, 310(Pt 1), 143281 (PubMed PMID 40250651).
- [14] Golshirazi, A., Labbaf, S., & Varshosaz, J. (2025, April 26). Optimised GelMA/Tragacanth gum hydrogel loaded with vanillic acid for biomedical applications. International Journal of Biological Macromolecules, 311(Pt 3), 143535 (PubMed PMID 40294682).
- [15] USDA Foreign Agricultural Service. (2025, March 11). Turkiye: Food Processing Ingredients Annual. U.S. Department of Agriculture GAIN Report TU2025-0009.
- [16] USDA Foreign Agricultural Service. (2026, June 30). Japan: Exporter Guide Annual. U.S. Department of Agriculture GAIN Report JA2026-0037.
- [17] USDA Foreign Agricultural Service. (2026, October 1). United Kingdom: Retail Foods Annual. U.S. Department of Agriculture GAIN Report UK2026-0029.
- [18] Jia, H., Yang, J., Song, Z., Meng, X., Zhang, W., Guo, L., Zhao, Q., & Jiang, Y. (2026, August 17). Synergistic dual functionality of HIPPEs stabilized by lactoferrin-vanillic acid-astragalus polysaccharide complex: simultaneously enabling DHA delivery and 3D printing of dysphagia foods. Food Research International, 243(Pt 2), 120394 (PubMed PMID 42705754).
- [19] USDA Foreign Agricultural Service. (2026, September 25). Germany: Retail Foods Annual. U.S. Department of Agriculture GAIN Report GM2026-0016.
- [20] USDA Foreign Agricultural Service. (2026, September 30). France: Retail Foods Annual. U.S. Department of Agriculture GAIN Report FR2026-0010.
- [21] Alland & Robert S.A. (2025, October 2). Come and visit us during Gulfood Manufacturing 2025: Beyond Acacia low-carbon plant-based ingredients. Alland & Robert Corporate News.
- [22] Hawkins Watts Limited. (2026, January 19). WattsUp Trend Watch: 2026 Food and Beverage Formulation Trends. Hawkins Watts Technical Insights.
- [23] Hosseini, S., Doostan, M., Izadi Nazar, A. H., Vakili-Ghartavol, R., & Maleki, H. (2025, October 1). Biofabricated Hydrogel Composite of Tragacanth Gum and Chitosan Loaded With Copper Oxide Nanoparticles for Enhanced Cutaneous Wound Regeneration. Journal of Biomedical Materials Research Part B: Applied Biomaterials, 113(10), e35668 (PubMed PMID 41047869).
- [24] Dadashi, P., Nazemi, Z., Radmanesh, F., & Nourbakhsh, M. S. (2025, November 21). Dynamic borax-crosslinked transparent and antifreezing tragacanth gum-glycerol hydrogel for biomedical use. Biomaterials Advances, 181, 214615 (PubMed PMID 41317604).
This bibliography is provided for reader reference and is not exhaustive. The full report contains the complete reference list and detailed citations.
This Report Answers
- How large is the tragacanth market in 2026 and what is forecast for 2036?
- Which acid-emulsion and clean-label pressures support demand for tragacanth?
- Why do White and Amber Ribbon Grades lead the exudate form category?
- Why do Acid-Stable Salad Dressings and Sauces with Sugar Paste lead end-use applications?
- How do growth rates differ across Turkey and Japan versus the United Kingdom and the United States?
- Which leading companies refine raw Middle Eastern ribbons versus custom-blended stabilizer systems?
- What limits wild Astragalus exudate supply or hydration speed in the tragacanth market?
- What should condiment and pharmaceutical buyers evaluate when specifying FCC or USP tragacanth?
Table of Content
- Key Takeaways
- Market Size and CAGR
- Top Growth Driver
- Fastest Growing Segment
- Leading Region
- Key Companies
- Emerging Opportunities
- Executive Summary
- Global Market Outlook
- Demand-side Trends
- Supply-side Trends
- Technology Roadmap Analysis
- Analysis and Recommendations
- Analyst Perspective (What is happening? Why now? What should investors know?)
- Key Questions Answered
- How large is the market?
- What is the CAGR?
- What are key trends?
- Which region dominates?
- Who are the leaders?
Read More...
- Market Overview
- Market Coverage / Taxonomy
- Market Definition / Scope / Limitations
- Research Methodology
- Chapter Orientation
- Analytical Lens and Working Hypotheses
- Market Structure, Signals, and Trend Drivers
- Benchmarking and Cross-market Comparability
- Market Sizing, Forecasting, and Opportunity Mapping
- Research Design and Evidence Framework
- Desk Research Programme (Secondary Evidence)
- Expert Input and Fieldwork (Primary Evidence)
- Tooling, Models, and Reference Databases
- Data Engineering and Model Build
- Quality Assurance and Audit Trail
- Market Background
- Market Dynamics (Drivers, Restraints, Opportunity, Trends)
- Scenario Forecast (Optimistic, Likely, Conservative)
- Impact Analysis
- AI Impact
- Sustainability Impact
- Regulatory Impact
- Technology Impact
- Consumer / Buyer Analysis
- Purchase Drivers
- Adoption Barriers
- Buyer Journey
- Opportunity Map Analysis
- Product Life Cycle Analysis
- Supply Chain Analysis
- Investment Feasibility Matrix
- Value Chain Analysis
- PESTLE and Porter's Analysis
- Regulatory Landscape
- Regional Parent Market Outlook
- Production and Consumption Statistics
- Import and Export Statistics
- Global Market Analysis and Forecast, 2021 to 2036
- Historical Market Size Value (USD Million) Analysis, 2021 to 2025
- Current and Future Market Size Value (USD Million) Projections, 2026 to 2036
- Y-o-Y Growth Trend Analysis
- Absolute $ Opportunity Analysis
- Global Market Pricing Analysis, 2021 to 2036
- Global Market Analysis and Forecast, By Exudate Form, 2021 to 2036
- Introduction / Key Findings
- Historical Market Size Value (USD Million) Analysis By Exudate Form, 2021 to 2025
- Current and Future Market Size Value (USD Million) Analysis and Forecast By Exudate Form, 2026 to 2036
- White and Amber Ribbon Grades
- Sari and Flake Exudate Grades
- Fine Mesh Milled Powder E413
- Y-o-Y Growth Trend Analysis By Exudate Form, 2021 to 2025
- Absolute $ Opportunity Analysis By Exudate Form, 2026 to 2036
- Global Market Analysis and Forecast, By End-Use Application, 2021 to 2036
- Introduction / Key Findings
- Historical Market Size Value (USD Million) Analysis By End-Use Application, 2021 to 2025
- Current and Future Market Size Value (USD Million) Analysis and Forecast By End-Use Application, 2026 to 2036
- Acid-Stable Salad Dressings, Sauces, and Sugar Paste
- Pharmaceutical Suspensions and Lozenge Binders
- Cosmetic Lotions, Toothpastes, and Hair Creams
- Textile Print Pastes and Leather Edge Burnishing
- Y-o-Y Growth Trend Analysis By End-Use Application, 2021 to 2025
- Absolute $ Opportunity Analysis By End-Use Application, 2026 to 2036
- Global Market Analysis and Forecast, By Grade, 2021 to 2036
- Introduction / Key Findings
- Historical Market Size Value (USD Million) Analysis By Grade, 2021 to 2025
- Current and Future Market Size Value (USD Million) Analysis and Forecast By Grade, 2026 to 2036
- Food and Confectionery FCC Grade
- USP/EP Pharmaceutical Grade
- Technical Grade
- Y-o-Y Growth Trend Analysis By Grade, 2021 to 2025
- Absolute $ Opportunity Analysis By Grade, 2026 to 2036
- Global Market Analysis and Forecast, By Distribution Channel, 2021 to 2036
- Introduction / Key Findings
- Historical Market Size Value (USD Million) Analysis By Distribution Channel, 2021 to 2025
- Current and Future Market Size Value (USD Million) Analysis and Forecast By Distribution Channel, 2026 to 2036
- Direct B2B Food and Beverage Processor Contracts
- Specialty Food Ingredient Distributors
- Retail and e-Commerce Channels
- Y-o-Y Growth Trend Analysis By Distribution Channel, 2021 to 2025
- Absolute $ Opportunity Analysis By Distribution Channel, 2026 to 2036
- Global Market Analysis and Forecast, By Clean-Label and Certification Status, 2021 to 2036
- Introduction / Key Findings
- Historical Market Size Value (USD Million) Analysis By Clean-Label and Certification Status, 2021 to 2025
- Current and Future Market Size Value (USD Million) Analysis and Forecast By Clean-Label and Certification Status, 2026 to 2036
- Non-GMO, Kosher, and Halal Certified
- Standard Conventional Specification
- Y-o-Y Growth Trend Analysis By Clean-Label and Certification Status, 2021 to 2025
- Absolute $ Opportunity Analysis By Clean-Label and Certification Status, 2026 to 2036
- Global Market Analysis and Forecast, By Packaging Bulk Format, 2021 to 2036
- Introduction / Key Findings
- Historical Market Size Value (USD Million) Analysis By Packaging Bulk Format, 2021 to 2025
- Current and Future Market Size Value (USD Million) Analysis and Forecast By Packaging Bulk Format, 2026 to 2036
- 25 kg Multi-Wall Kraft Bags and Fiber Drums
- 1000 L IBC Totes and Bulk Tankers
- Small-Batch Foil Pouches and Pails
- Y-o-Y Growth Trend Analysis By Packaging Bulk Format, 2021 to 2025
- Absolute $ Opportunity Analysis By Packaging Bulk Format, 2026 to 2036
- Global Market Analysis and Forecast, By Region, 2021 to 2036
- Introduction
- Historical Market Size Value (USD Million) Analysis By Region, 2021 to 2025
- Current Market Size Value (USD Million) Analysis and Forecast By Region, 2026 to 2036
- North America
- Latin America
- Western Europe
- Eastern Europe
- East Asia
- South Asia and Pacific
- Middle East and Africa
- Market Attractiveness Analysis By Region
- North America Market Analysis and Forecast, By Country, 2021 to 2036
- Historical Market Size Value (USD Million) Trend Analysis By Market Taxonomy, 2021 to 2025
- Market Size Value (USD Million) Forecast By Market Taxonomy, 2026 to 2036
- By Country
- United States
- Canada
- By Exudate Form
- By End-Use Application
- By Grade
- By Distribution Channel
- By Clean-Label and Certification Status
- By Packaging Bulk Format
- By Country
- Market Attractiveness Analysis
- By Country
- By Exudate Form
- By End-Use Application
- By Grade
- By Distribution Channel
- By Clean-Label and Certification Status
- By Packaging Bulk Format
- Key Takeaways
- Latin America Market Analysis and Forecast, By Country
- Historical Market Size Value (USD Million) Trend Analysis By Market Taxonomy, 2021 to 2025
- Market Size Value (USD Million) Forecast By Market Taxonomy, 2026 to 2036
- By Country
- Brazil
- Mexico
- Argentina
- Chile
- By Exudate Form
- By End-Use Application
- By Grade
- By Distribution Channel
- By Clean-Label and Certification Status
- By Packaging Bulk Format
- By Country
- Market Attractiveness Analysis
- By Country
- By Exudate Form
- By End-Use Application
- By Grade
- By Distribution Channel
- By Clean-Label and Certification Status
- By Packaging Bulk Format
- Key Takeaways
- Western Europe Market Analysis and Forecast, By Country
- Historical Market Size Value (USD Million) Trend Analysis By Market Taxonomy, 2021 to 2025
- Market Size Value (USD Million) Forecast By Market Taxonomy, 2026 to 2036
- By Country
- Germany
- France
- United Kingdom
- Italy
- Spain
- Benelux
- Nordics
- By Exudate Form
- By End-Use Application
- By Grade
- By Distribution Channel
- By Clean-Label and Certification Status
- By Packaging Bulk Format
- By Country
- Market Attractiveness Analysis
- By Country
- By Exudate Form
- By End-Use Application
- By Grade
- By Distribution Channel
- By Clean-Label and Certification Status
- By Packaging Bulk Format
- Key Takeaways
- Eastern Europe Market Analysis and Forecast, By Country
- Historical Market Size Value (USD Million) Trend Analysis By Market Taxonomy, 2021 to 2025
- Market Size Value (USD Million) Forecast By Market Taxonomy, 2026 to 2036
- By Country
- Poland
- Czech Republic
- Romania
- Hungary
- By Exudate Form
- By End-Use Application
- By Grade
- By Distribution Channel
- By Clean-Label and Certification Status
- By Packaging Bulk Format
- By Country
- Market Attractiveness Analysis
- By Country
- By Exudate Form
- By End-Use Application
- By Grade
- By Distribution Channel
- By Clean-Label and Certification Status
- By Packaging Bulk Format
- Key Takeaways
- East Asia Market Analysis and Forecast, By Country
- Historical Market Size Value (USD Million) Trend Analysis By Market Taxonomy, 2021 to 2025
- Market Size Value (USD Million) Forecast By Market Taxonomy, 2026 to 2036
- By Country
- China
- Japan
- South Korea
- By Exudate Form
- By End-Use Application
- By Grade
- By Distribution Channel
- By Clean-Label and Certification Status
- By Packaging Bulk Format
- By Country
- Market Attractiveness Analysis
- By Country
- By Exudate Form
- By End-Use Application
- By Grade
- By Distribution Channel
- By Clean-Label and Certification Status
- By Packaging Bulk Format
- Key Takeaways
- South Asia and Pacific Market Analysis and Forecast, By Country
- Historical Market Size Value (USD Million) Trend Analysis By Market Taxonomy, 2021 to 2025
- Market Size Value (USD Million) Forecast By Market Taxonomy, 2026 to 2036
- By Country
- India
- ASEAN
- Australia and New Zealand
- By Exudate Form
- By End-Use Application
- By Grade
- By Distribution Channel
- By Clean-Label and Certification Status
- By Packaging Bulk Format
- By Country
- Market Attractiveness Analysis
- By Country
- By Exudate Form
- By End-Use Application
- By Grade
- By Distribution Channel
- By Clean-Label and Certification Status
- By Packaging Bulk Format
- Key Takeaways
- Middle East and Africa Market Analysis and Forecast, By Country
- Historical Market Size Value (USD Million) Trend Analysis By Market Taxonomy, 2021 to 2025
- Market Size Value (USD Million) Forecast By Market Taxonomy, 2026 to 2036
- By Country
- GCC Countries
- South Africa
- Türkiye
- Israel
- By Exudate Form
- By End-Use Application
- By Grade
- By Distribution Channel
- By Clean-Label and Certification Status
- By Packaging Bulk Format
- By Country
- Market Attractiveness Analysis
- By Country
- By Exudate Form
- By End-Use Application
- By Grade
- By Distribution Channel
- By Clean-Label and Certification Status
- By Packaging Bulk Format
- Key Takeaways
- Key Countries Market Analysis
- United States
- Pricing Analysis
- Market Share Analysis, 2025
- By Exudate Form
- By End-Use Application
- By Grade
- By Distribution Channel
- By Clean-Label and Certification Status
- By Packaging Bulk Format
- Canada
- Pricing Analysis
- Market Share Analysis, 2025
- By Exudate Form
- By End-Use Application
- By Grade
- By Distribution Channel
- By Clean-Label and Certification Status
- By Packaging Bulk Format
- Mexico
- Pricing Analysis
- Market Share Analysis, 2025
- By Exudate Form
- By End-Use Application
- By Grade
- By Distribution Channel
- By Clean-Label and Certification Status
- By Packaging Bulk Format
- Brazil
- Pricing Analysis
- Market Share Analysis, 2025
- By Exudate Form
- By End-Use Application
- By Grade
- By Distribution Channel
- By Clean-Label and Certification Status
- By Packaging Bulk Format
- Chile
- Pricing Analysis
- Market Share Analysis, 2025
- By Exudate Form
- By End-Use Application
- By Grade
- By Distribution Channel
- By Clean-Label and Certification Status
- By Packaging Bulk Format
- Germany
- Pricing Analysis
- Market Share Analysis, 2025
- By Exudate Form
- By End-Use Application
- By Grade
- By Distribution Channel
- By Clean-Label and Certification Status
- By Packaging Bulk Format
- United Kingdom
- Pricing Analysis
- Market Share Analysis, 2025
- By Exudate Form
- By End-Use Application
- By Grade
- By Distribution Channel
- By Clean-Label and Certification Status
- By Packaging Bulk Format
- Italy
- Pricing Analysis
- Market Share Analysis, 2025
- By Exudate Form
- By End-Use Application
- By Grade
- By Distribution Channel
- By Clean-Label and Certification Status
- By Packaging Bulk Format
- Spain
- Pricing Analysis
- Market Share Analysis, 2025
- By Exudate Form
- By End-Use Application
- By Grade
- By Distribution Channel
- By Clean-Label and Certification Status
- By Packaging Bulk Format
- France
- Pricing Analysis
- Market Share Analysis, 2025
- By Exudate Form
- By End-Use Application
- By Grade
- By Distribution Channel
- By Clean-Label and Certification Status
- By Packaging Bulk Format
- India
- Pricing Analysis
- Market Share Analysis, 2025
- By Exudate Form
- By End-Use Application
- By Grade
- By Distribution Channel
- By Clean-Label and Certification Status
- By Packaging Bulk Format
- ASEAN
- Pricing Analysis
- Market Share Analysis, 2025
- By Exudate Form
- By End-Use Application
- By Grade
- By Distribution Channel
- By Clean-Label and Certification Status
- By Packaging Bulk Format
- Australia and New Zealand
- Pricing Analysis
- Market Share Analysis, 2025
- By Exudate Form
- By End-Use Application
- By Grade
- By Distribution Channel
- By Clean-Label and Certification Status
- By Packaging Bulk Format
- China
- Pricing Analysis
- Market Share Analysis, 2025
- By Exudate Form
- By End-Use Application
- By Grade
- By Distribution Channel
- By Clean-Label and Certification Status
- By Packaging Bulk Format
- Japan
- Pricing Analysis
- Market Share Analysis, 2025
- By Exudate Form
- By End-Use Application
- By Grade
- By Distribution Channel
- By Clean-Label and Certification Status
- By Packaging Bulk Format
- South Korea
- Pricing Analysis
- Market Share Analysis, 2025
- By Exudate Form
- By End-Use Application
- By Grade
- By Distribution Channel
- By Clean-Label and Certification Status
- By Packaging Bulk Format
- Poland
- Pricing Analysis
- Market Share Analysis, 2025
- By Exudate Form
- By End-Use Application
- By Grade
- By Distribution Channel
- By Clean-Label and Certification Status
- By Packaging Bulk Format
- Hungary
- Pricing Analysis
- Market Share Analysis, 2025
- By Exudate Form
- By End-Use Application
- By Grade
- By Distribution Channel
- By Clean-Label and Certification Status
- By Packaging Bulk Format
- Türkiye
- Pricing Analysis
- Market Share Analysis, 2025
- By Exudate Form
- By End-Use Application
- By Grade
- By Distribution Channel
- By Clean-Label and Certification Status
- By Packaging Bulk Format
- South Africa
- Pricing Analysis
- Market Share Analysis, 2025
- By Exudate Form
- By End-Use Application
- By Grade
- By Distribution Channel
- By Clean-Label and Certification Status
- By Packaging Bulk Format
- Turkey
- Pricing Analysis
- Market Share Analysis, 2025
- By Exudate Form
- By End-Use Application
- By Grade
- By Distribution Channel
- By Clean-Label and Certification Status
- By Packaging Bulk Format
- United States
- Market Structure Analysis
- Competition Dashboard
- Competition Benchmarking
- Market Share Analysis of Top Players
- By Regional
- By Exudate Form
- By End-Use Application
- By Grade
- By Distribution Channel
- By Clean-Label and Certification Status
- By Packaging Bulk Format
- Emerging Startups
- Innovation Benchmarking
- Competition Analysis
- Competition Deep Dive
- Norevo GmbH
- Overview
- Product Portfolio
- Profitability by Market Segments
- Sales Footprint
- Strategy Overview
- Marketing Strategy
- Product Strategy
- Channel Strategy
- Kerry Group plc
- Ingredients Solutions, Inc.
- Alland & Robert S.A.
- Willy Benecke GmbH
- Hawkins Watts Limited
- Gum Technology Corporation
- Norevo GmbH
- Case Studies
- Success Stories
- Recent Developments
- Competition Deep Dive
- Assumptions & Acronyms Used
List of Tables
- Table 1: Global Market Value (USD Million) Forecast by Region, 2021 to 2036
- Table 2: Global Market Value (USD Million) Forecast by Exudate Form, 2021 to 2036
- Table 3: Global Market Value (USD Million) Forecast by End-Use Application, 2021 to 2036
- Table 4: Global Market Value (USD Million) Forecast by Grade, 2021 to 2036
- Table 5: Global Market Value (USD Million) Forecast by Distribution Channel, 2021 to 2036
- Table 6: Global Market Value (USD Million) Forecast by Clean-Label and Certification Status, 2021 to 2036
- Table 7: Global Market Value (USD Million) Forecast by Packaging Bulk Format, 2021 to 2036
- Table 8: North America Market Value (USD Million) Forecast by Country, 2021 to 2036
- Table 9: North America Market Value (USD Million) Forecast by Exudate Form, 2021 to 2036
- Table 10: North America Market Value (USD Million) Forecast by End-Use Application, 2021 to 2036
- Table 11: North America Market Value (USD Million) Forecast by Grade, 2021 to 2036
- Table 12: North America Market Value (USD Million) Forecast by Distribution Channel, 2021 to 2036
- Table 13: North America Market Value (USD Million) Forecast by Clean-Label and Certification Status, 2021 to 2036
- Table 14: North America Market Value (USD Million) Forecast by Packaging Bulk Format, 2021 to 2036
- Table 15: Latin America Market Value (USD Million) Forecast by Country, 2021 to 2036
- Table 16: Latin America Market Value (USD Million) Forecast by Exudate Form, 2021 to 2036
- Table 17: Latin America Market Value (USD Million) Forecast by End-Use Application, 2021 to 2036
- Table 18: Latin America Market Value (USD Million) Forecast by Grade, 2021 to 2036
- Table 19: Latin America Market Value (USD Million) Forecast by Distribution Channel, 2021 to 2036
- Table 20: Latin America Market Value (USD Million) Forecast by Clean-Label and Certification Status, 2021 to 2036
- Table 21: Latin America Market Value (USD Million) Forecast by Packaging Bulk Format, 2021 to 2036
- Table 22: Western Europe Market Value (USD Million) Forecast by Country, 2021 to 2036
- Table 23: Western Europe Market Value (USD Million) Forecast by Exudate Form, 2021 to 2036
- Table 24: Western Europe Market Value (USD Million) Forecast by End-Use Application, 2021 to 2036
- Table 25: Western Europe Market Value (USD Million) Forecast by Grade, 2021 to 2036
- Table 26: Western Europe Market Value (USD Million) Forecast by Distribution Channel, 2021 to 2036
- Table 27: Western Europe Market Value (USD Million) Forecast by Clean-Label and Certification Status, 2021 to 2036
- Table 28: Western Europe Market Value (USD Million) Forecast by Packaging Bulk Format, 2021 to 2036
- Table 29: Eastern Europe Market Value (USD Million) Forecast by Country, 2021 to 2036
- Table 30: Eastern Europe Market Value (USD Million) Forecast by Exudate Form, 2021 to 2036
- Table 31: Eastern Europe Market Value (USD Million) Forecast by End-Use Application, 2021 to 2036
- Table 32: Eastern Europe Market Value (USD Million) Forecast by Grade, 2021 to 2036
- Table 33: Eastern Europe Market Value (USD Million) Forecast by Distribution Channel, 2021 to 2036
- Table 34: Eastern Europe Market Value (USD Million) Forecast by Clean-Label and Certification Status, 2021 to 2036
- Table 35: Eastern Europe Market Value (USD Million) Forecast by Packaging Bulk Format, 2021 to 2036
- Table 36: East Asia Market Value (USD Million) Forecast by Country, 2021 to 2036
- Table 37: East Asia Market Value (USD Million) Forecast by Exudate Form, 2021 to 2036
- Table 38: East Asia Market Value (USD Million) Forecast by End-Use Application, 2021 to 2036
- Table 39: East Asia Market Value (USD Million) Forecast by Grade, 2021 to 2036
- Table 40: East Asia Market Value (USD Million) Forecast by Distribution Channel, 2021 to 2036
- Table 41: East Asia Market Value (USD Million) Forecast by Clean-Label and Certification Status, 2021 to 2036
- Table 42: East Asia Market Value (USD Million) Forecast by Packaging Bulk Format, 2021 to 2036
- Table 43: South Asia and Pacific Market Value (USD Million) Forecast by Country, 2021 to 2036
- Table 44: South Asia and Pacific Market Value (USD Million) Forecast by Exudate Form, 2021 to 2036
- Table 45: South Asia and Pacific Market Value (USD Million) Forecast by End-Use Application, 2021 to 2036
- Table 46: South Asia and Pacific Market Value (USD Million) Forecast by Grade, 2021 to 2036
- Table 47: South Asia and Pacific Market Value (USD Million) Forecast by Distribution Channel, 2021 to 2036
- Table 48: South Asia and Pacific Market Value (USD Million) Forecast by Clean-Label and Certification Status, 2021 to 2036
- Table 49: South Asia and Pacific Market Value (USD Million) Forecast by Packaging Bulk Format, 2021 to 2036
- Table 50: Middle East and Africa Market Value (USD Million) Forecast by Country, 2021 to 2036
- Table 51: Middle East and Africa Market Value (USD Million) Forecast by Exudate Form, 2021 to 2036
- Table 52: Middle East and Africa Market Value (USD Million) Forecast by End-Use Application, 2021 to 2036
- Table 53: Middle East and Africa Market Value (USD Million) Forecast by Grade, 2021 to 2036
- Table 54: Middle East and Africa Market Value (USD Million) Forecast by Distribution Channel, 2021 to 2036
- Table 55: Middle East and Africa Market Value (USD Million) Forecast by Clean-Label and Certification Status, 2021 to 2036
- Table 56: Middle East and Africa Market Value (USD Million) Forecast by Packaging Bulk Format, 2021 to 2036
List of Figures
- Figure 1: Global Market Pricing Analysis
- Figure 2: Global Market Value (USD Million) Forecast 2021-2036
- Figure 3: Global Market Value Share and BPS Analysis by Exudate Form, 2026 and 2036
- Figure 4: Global Market Y-o-Y Growth Comparison by Exudate Form, 2026-2036
- Figure 5: Global Market Attractiveness Analysis by Exudate Form
- Figure 6: Global Market Value Share and BPS Analysis by End-Use Application, 2026 and 2036
- Figure 7: Global Market Y-o-Y Growth Comparison by End-Use Application, 2026-2036
- Figure 8: Global Market Attractiveness Analysis by End-Use Application
- Figure 9: Global Market Value Share and BPS Analysis by Grade, 2026 and 2036
- Figure 10: Global Market Y-o-Y Growth Comparison by Grade, 2026-2036
- Figure 11: Global Market Attractiveness Analysis by Grade
- Figure 12: Global Market Value Share and BPS Analysis by Distribution Channel, 2026 and 2036
- Figure 13: Global Market Y-o-Y Growth Comparison by Distribution Channel, 2026-2036
- Figure 14: Global Market Attractiveness Analysis by Distribution Channel
- Figure 15: Global Market Value Share and BPS Analysis by Clean-Label and Certification Status, 2026 and 2036
- Figure 16: Global Market Y-o-Y Growth Comparison by Clean-Label and Certification Status, 2026-2036
- Figure 17: Global Market Attractiveness Analysis by Clean-Label and Certification Status
- Figure 18: Global Market Value Share and BPS Analysis by Packaging Bulk Format, 2026 and 2036
- Figure 19: Global Market Y-o-Y Growth Comparison by Packaging Bulk Format, 2026-2036
- Figure 20: Global Market Attractiveness Analysis by Packaging Bulk Format
- Figure 21: Global Market Value (USD Million) Share and BPS Analysis by Region, 2026 and 2036
- Figure 22: Global Market Y-o-Y Growth Comparison by Region, 2026-2036
- Figure 23: Global Market Attractiveness Analysis by Region
- Figure 24: North America Market Incremental Dollar Opportunity, 2026-2036
- Figure 25: Latin America Market Incremental Dollar Opportunity, 2026-2036
- Figure 26: Western Europe Market Incremental Dollar Opportunity, 2026-2036
- Figure 27: Eastern Europe Market Incremental Dollar Opportunity, 2026-2036
- Figure 28: East Asia Market Incremental Dollar Opportunity, 2026-2036
- Figure 29: South Asia and Pacific Market Incremental Dollar Opportunity, 2026-2036
- Figure 30: Middle East and Africa Market Incremental Dollar Opportunity, 2026-2036
- Figure 31: North America Market Value Share and BPS Analysis by Country, 2026 and 2036
- Figure 32: North America Market Value Share and BPS Analysis by Exudate Form, 2026 and 2036
- Figure 33: North America Market Y-o-Y Growth Comparison by Exudate Form, 2026-2036
- Figure 34: North America Market Attractiveness Analysis by Exudate Form
- Figure 35: North America Market Value Share and BPS Analysis by End-Use Application, 2026 and 2036
- Figure 36: North America Market Y-o-Y Growth Comparison by End-Use Application, 2026-2036
- Figure 37: North America Market Attractiveness Analysis by End-Use Application
- Figure 38: North America Market Value Share and BPS Analysis by Grade, 2026 and 2036
- Figure 39: North America Market Y-o-Y Growth Comparison by Grade, 2026-2036
- Figure 40: North America Market Attractiveness Analysis by Grade
- Figure 41: North America Market Value Share and BPS Analysis by Distribution Channel, 2026 and 2036
- Figure 42: North America Market Y-o-Y Growth Comparison by Distribution Channel, 2026-2036
- Figure 43: North America Market Attractiveness Analysis by Distribution Channel
- Figure 44: North America Market Value Share and BPS Analysis by Clean-Label and Certification Status, 2026 and 2036
- Figure 45: North America Market Y-o-Y Growth Comparison by Clean-Label and Certification Status, 2026-2036
- Figure 46: North America Market Attractiveness Analysis by Clean-Label and Certification Status
- Figure 47: North America Market Value Share and BPS Analysis by Packaging Bulk Format, 2026 and 2036
- Figure 48: North America Market Y-o-Y Growth Comparison by Packaging Bulk Format, 2026-2036
- Figure 49: North America Market Attractiveness Analysis by Packaging Bulk Format
- Figure 50: Latin America Market Value Share and BPS Analysis by Country, 2026 and 2036
- Figure 51: Latin America Market Value Share and BPS Analysis by Exudate Form, 2026 and 2036
- Figure 52: Latin America Market Y-o-Y Growth Comparison by Exudate Form, 2026-2036
- Figure 53: Latin America Market Attractiveness Analysis by Exudate Form
- Figure 54: Latin America Market Value Share and BPS Analysis by End-Use Application, 2026 and 2036
- Figure 55: Latin America Market Y-o-Y Growth Comparison by End-Use Application, 2026-2036
- Figure 56: Latin America Market Attractiveness Analysis by End-Use Application
- Figure 57: Latin America Market Value Share and BPS Analysis by Grade, 2026 and 2036
- Figure 58: Latin America Market Y-o-Y Growth Comparison by Grade, 2026-2036
- Figure 59: Latin America Market Attractiveness Analysis by Grade
- Figure 60: Latin America Market Value Share and BPS Analysis by Distribution Channel, 2026 and 2036
- Figure 61: Latin America Market Y-o-Y Growth Comparison by Distribution Channel, 2026-2036
- Figure 62: Latin America Market Attractiveness Analysis by Distribution Channel
- Figure 63: Latin America Market Value Share and BPS Analysis by Clean-Label and Certification Status, 2026 and 2036
- Figure 64: Latin America Market Y-o-Y Growth Comparison by Clean-Label and Certification Status, 2026-2036
- Figure 65: Latin America Market Attractiveness Analysis by Clean-Label and Certification Status
- Figure 66: Latin America Market Value Share and BPS Analysis by Packaging Bulk Format, 2026 and 2036
- Figure 67: Latin America Market Y-o-Y Growth Comparison by Packaging Bulk Format, 2026-2036
- Figure 68: Latin America Market Attractiveness Analysis by Packaging Bulk Format
- Figure 69: Western Europe Market Value Share and BPS Analysis by Country, 2026 and 2036
- Figure 70: Western Europe Market Value Share and BPS Analysis by Exudate Form, 2026 and 2036
- Figure 71: Western Europe Market Y-o-Y Growth Comparison by Exudate Form, 2026-2036
- Figure 72: Western Europe Market Attractiveness Analysis by Exudate Form
- Figure 73: Western Europe Market Value Share and BPS Analysis by End-Use Application, 2026 and 2036
- Figure 74: Western Europe Market Y-o-Y Growth Comparison by End-Use Application, 2026-2036
- Figure 75: Western Europe Market Attractiveness Analysis by End-Use Application
- Figure 76: Western Europe Market Value Share and BPS Analysis by Grade, 2026 and 2036
- Figure 77: Western Europe Market Y-o-Y Growth Comparison by Grade, 2026-2036
- Figure 78: Western Europe Market Attractiveness Analysis by Grade
- Figure 79: Western Europe Market Value Share and BPS Analysis by Distribution Channel, 2026 and 2036
- Figure 80: Western Europe Market Y-o-Y Growth Comparison by Distribution Channel, 2026-2036
- Figure 81: Western Europe Market Attractiveness Analysis by Distribution Channel
- Figure 82: Western Europe Market Value Share and BPS Analysis by Clean-Label and Certification Status, 2026 and 2036
- Figure 83: Western Europe Market Y-o-Y Growth Comparison by Clean-Label and Certification Status, 2026-2036
- Figure 84: Western Europe Market Attractiveness Analysis by Clean-Label and Certification Status
- Figure 85: Western Europe Market Value Share and BPS Analysis by Packaging Bulk Format, 2026 and 2036
- Figure 86: Western Europe Market Y-o-Y Growth Comparison by Packaging Bulk Format, 2026-2036
- Figure 87: Western Europe Market Attractiveness Analysis by Packaging Bulk Format
- Figure 88: Eastern Europe Market Value Share and BPS Analysis by Country, 2026 and 2036
- Figure 89: Eastern Europe Market Value Share and BPS Analysis by Exudate Form, 2026 and 2036
- Figure 90: Eastern Europe Market Y-o-Y Growth Comparison by Exudate Form, 2026-2036
- Figure 91: Eastern Europe Market Attractiveness Analysis by Exudate Form
- Figure 92: Eastern Europe Market Value Share and BPS Analysis by End-Use Application, 2026 and 2036
- Figure 93: Eastern Europe Market Y-o-Y Growth Comparison by End-Use Application, 2026-2036
- Figure 94: Eastern Europe Market Attractiveness Analysis by End-Use Application
- Figure 95: Eastern Europe Market Value Share and BPS Analysis by Grade, 2026 and 2036
- Figure 96: Eastern Europe Market Y-o-Y Growth Comparison by Grade, 2026-2036
- Figure 97: Eastern Europe Market Attractiveness Analysis by Grade
- Figure 98: Eastern Europe Market Value Share and BPS Analysis by Distribution Channel, 2026 and 2036
- Figure 99: Eastern Europe Market Y-o-Y Growth Comparison by Distribution Channel, 2026-2036
- Figure 100: Eastern Europe Market Attractiveness Analysis by Distribution Channel
- Figure 101: Eastern Europe Market Value Share and BPS Analysis by Clean-Label and Certification Status, 2026 and 2036
- Figure 102: Eastern Europe Market Y-o-Y Growth Comparison by Clean-Label and Certification Status, 2026-2036
- Figure 103: Eastern Europe Market Attractiveness Analysis by Clean-Label and Certification Status
- Figure 104: Eastern Europe Market Value Share and BPS Analysis by Packaging Bulk Format, 2026 and 2036
- Figure 105: Eastern Europe Market Y-o-Y Growth Comparison by Packaging Bulk Format, 2026-2036
- Figure 106: Eastern Europe Market Attractiveness Analysis by Packaging Bulk Format
- Figure 107: East Asia Market Value Share and BPS Analysis by Country, 2026 and 2036
- Figure 108: East Asia Market Value Share and BPS Analysis by Exudate Form, 2026 and 2036
- Figure 109: East Asia Market Y-o-Y Growth Comparison by Exudate Form, 2026-2036
- Figure 110: East Asia Market Attractiveness Analysis by Exudate Form
- Figure 111: East Asia Market Value Share and BPS Analysis by End-Use Application, 2026 and 2036
- Figure 112: East Asia Market Y-o-Y Growth Comparison by End-Use Application, 2026-2036
- Figure 113: East Asia Market Attractiveness Analysis by End-Use Application
- Figure 114: East Asia Market Value Share and BPS Analysis by Grade, 2026 and 2036
- Figure 115: East Asia Market Y-o-Y Growth Comparison by Grade, 2026-2036
- Figure 116: East Asia Market Attractiveness Analysis by Grade
- Figure 117: East Asia Market Value Share and BPS Analysis by Distribution Channel, 2026 and 2036
- Figure 118: East Asia Market Y-o-Y Growth Comparison by Distribution Channel, 2026-2036
- Figure 119: East Asia Market Attractiveness Analysis by Distribution Channel
- Figure 120: East Asia Market Value Share and BPS Analysis by Clean-Label and Certification Status, 2026 and 2036
- Figure 121: East Asia Market Y-o-Y Growth Comparison by Clean-Label and Certification Status, 2026-2036
- Figure 122: East Asia Market Attractiveness Analysis by Clean-Label and Certification Status
- Figure 123: East Asia Market Value Share and BPS Analysis by Packaging Bulk Format, 2026 and 2036
- Figure 124: East Asia Market Y-o-Y Growth Comparison by Packaging Bulk Format, 2026-2036
- Figure 125: East Asia Market Attractiveness Analysis by Packaging Bulk Format
- Figure 126: South Asia and Pacific Market Value Share and BPS Analysis by Country, 2026 and 2036
- Figure 127: South Asia and Pacific Market Value Share and BPS Analysis by Exudate Form, 2026 and 2036
- Figure 128: South Asia and Pacific Market Y-o-Y Growth Comparison by Exudate Form, 2026-2036
- Figure 129: South Asia and Pacific Market Attractiveness Analysis by Exudate Form
- Figure 130: South Asia and Pacific Market Value Share and BPS Analysis by End-Use Application, 2026 and 2036
- Figure 131: South Asia and Pacific Market Y-o-Y Growth Comparison by End-Use Application, 2026-2036
- Figure 132: South Asia and Pacific Market Attractiveness Analysis by End-Use Application
- Figure 133: South Asia and Pacific Market Value Share and BPS Analysis by Grade, 2026 and 2036
- Figure 134: South Asia and Pacific Market Y-o-Y Growth Comparison by Grade, 2026-2036
- Figure 135: South Asia and Pacific Market Attractiveness Analysis by Grade
- Figure 136: South Asia and Pacific Market Value Share and BPS Analysis by Distribution Channel, 2026 and 2036
- Figure 137: South Asia and Pacific Market Y-o-Y Growth Comparison by Distribution Channel, 2026-2036
- Figure 138: South Asia and Pacific Market Attractiveness Analysis by Distribution Channel
- Figure 139: South Asia and Pacific Market Value Share and BPS Analysis by Clean-Label and Certification Status, 2026 and 2036
- Figure 140: South Asia and Pacific Market Y-o-Y Growth Comparison by Clean-Label and Certification Status, 2026-2036
- Figure 141: South Asia and Pacific Market Attractiveness Analysis by Clean-Label and Certification Status
- Figure 142: South Asia and Pacific Market Value Share and BPS Analysis by Packaging Bulk Format, 2026 and 2036
- Figure 143: South Asia and Pacific Market Y-o-Y Growth Comparison by Packaging Bulk Format, 2026-2036
- Figure 144: South Asia and Pacific Market Attractiveness Analysis by Packaging Bulk Format
- Figure 145: Middle East and Africa Market Value Share and BPS Analysis by Country, 2026 and 2036
- Figure 146: Middle East and Africa Market Value Share and BPS Analysis by Exudate Form, 2026 and 2036
- Figure 147: Middle East and Africa Market Y-o-Y Growth Comparison by Exudate Form, 2026-2036
- Figure 148: Middle East and Africa Market Attractiveness Analysis by Exudate Form
- Figure 149: Middle East and Africa Market Value Share and BPS Analysis by End-Use Application, 2026 and 2036
- Figure 150: Middle East and Africa Market Y-o-Y Growth Comparison by End-Use Application, 2026-2036
- Figure 151: Middle East and Africa Market Attractiveness Analysis by End-Use Application
- Figure 152: Middle East and Africa Market Value Share and BPS Analysis by Grade, 2026 and 2036
- Figure 153: Middle East and Africa Market Y-o-Y Growth Comparison by Grade, 2026-2036
- Figure 154: Middle East and Africa Market Attractiveness Analysis by Grade
- Figure 155: Middle East and Africa Market Value Share and BPS Analysis by Distribution Channel, 2026 and 2036
- Figure 156: Middle East and Africa Market Y-o-Y Growth Comparison by Distribution Channel, 2026-2036
- Figure 157: Middle East and Africa Market Attractiveness Analysis by Distribution Channel
- Figure 158: Middle East and Africa Market Value Share and BPS Analysis by Clean-Label and Certification Status, 2026 and 2036
- Figure 159: Middle East and Africa Market Y-o-Y Growth Comparison by Clean-Label and Certification Status, 2026-2036
- Figure 160: Middle East and Africa Market Attractiveness Analysis by Clean-Label and Certification Status
- Figure 161: Middle East and Africa Market Value Share and BPS Analysis by Packaging Bulk Format, 2026 and 2036
- Figure 162: Middle East and Africa Market Y-o-Y Growth Comparison by Packaging Bulk Format, 2026-2036
- Figure 163: Middle East and Africa Market Attractiveness Analysis by Packaging Bulk Format
- Figure 164: Global Market - Tier Structure Analysis
- Figure 165: Global Market - Company Share Analysis
Frequently Asked Questions
How big is the tragacanth market in 2026, and what is forecast for 2036?
Global tragacanth industry valuation totaled USD 88.5 million for 2025 and reaches USD 93.1 million during 2026. Ten-year projections place category value at USD 154.6 million by 2036 because condiment and confectionery with pharmaceutical processors lock in acid-stable botanical hydrocolloids.
What is the CAGR for the tragacanth market from 2026 to 2036?
Global tragacanth demand advances at a 5.2% annual growth rate between 2026 and 2036, generating USD 61.5 million in incremental value across FCC and USP/EP with technical grades.
Which exudate form segment leads the tragacanth market?
White and Amber Ribbon Grades capture 53.6% of 2026 exudate form valuation because hand-sorted primary ribbons contain the highest bassorin gel fraction and lowest ash content.
Which end-use application segment leads the tragacanth market?
Acid-Stable Salad Dressings and Sauces with Sugar Paste represent 46.4% of 2026 application volume as E413 stabilizes low-pH vinegar emulsions and imparts elasticity to fondant icing.
Which country has a notable growth outlook during the assessment period?
Turkey paces country-level growth at 5.9% per year through 2036, supported by domestic Anatolian Astragalus harvesting and Halal confectionery manufacturing with export milling.
Who are the key players in the market?
Norevo GmbH and Kerry Group plc with Ingredients Solutions, Inc. and Alland & Robert S.A. lead botanical refining. Willy Benecke GmbH and Hawkins Watts Limited with Gum Technology Corporation anchor custom hydrocolloid blending.
Preview the report firsthand - request a free sample
Get SampleGet the brochure for pricing and purchase details.
Get PDF
