The demand for direct drive wind turbines in USA is valued at USD 8.2 billion in 2025 and is expected to reach USD 34.4 billion by 2035, reflecting a compound annual growth rate of 15.4%. Growth is driven by expanding wind power development, where direct-drive systems are gaining traction due to reduced mechanical complexity and lower long-term maintenance requirements. These turbines support reliable power generation across variable wind conditions, making them attractive for large-scale onshore and select offshore projects. As developers increase installation volumes and pursue longer operational lifespans, procurement strengthens across regional wind corridors. This demand reflects broad investment in large-capacity units that align with long-term energy planning across USA.
The growth curve shows a pronounced upward trajectory, beginning at USD 4.0 billion in earlier years and rising to USD 8.2 billion in 2025, before advancing to USD 34.4 billion by 2035. Annual increments widen steadily, moving from USD 9.5 billion in 2026 to USD 10.9 billion in 2027 and continuing through USD 16.8 billion in 2031 and USD 25.8 billion in 2033. This pattern signals accelerating deployment driven by project scaling, turbine fleet modernization and strengthened investment commitments. As installation efficiency improves and grid operators expand renewable capacity, direct drive turbines maintain consistent momentum. The curve illustrates a rapidly growing segment supported by broader adoption of high-efficiency turbine configurations across USA’s wind energy market.
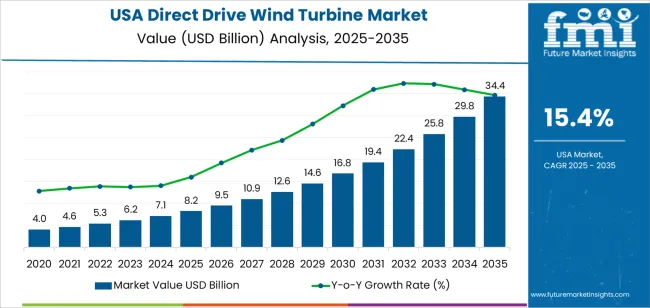
Demand in USA for direct drive wind turbines is projected to grow from USD 8.2 billion in 2025 to USD 34.4 billion by 2035, reflecting a compound annual growth rate (CAGR) of approximately 15.4%. The value increases from USD 4.0 billion in 2020, to USD 8.2 billion in 2025, and then continues upward reaching USD 9.5 billion in 2026, USD 16.8 billion in 2030, and ultimately USD 34.4 billion by 2035. Growth is driven by increasing adoption of direct drive technology in wind turbines especially for offshore and large scale onshore installations owing to lower maintenance, higher reliability, and favourable policy incentives for renewables.
Over the forecast period, the uplift of USD 26.2 billion (from USD 8.2 billion to USD 34.4 billion) is supported by both volume growth and rising per unit system value. Initially, the increase is driven by higher installation volumes as turbine OEMs shift to direct drive systems and developers pursue large wind farm projects. In the later years, value growth becomes more pronounced as turbine capacities scale up, features such as enhanced generators, larger rotors and integrated digital operations become standard—raising average content per turbine. Suppliers focusing on high spec, direct drive solutions and integration services are best positioned to capture the significant growth opportunity toward USD 34.4 billion by 2035.
| Metric | Value |
|---|---|
| Industry Value (2025) | USD 8.2 billion |
| Forecast Value (2035) | USD 34.4 billion |
| Forecast CAGR (2025–2035) | 15.4% |
The demand for direct drive wind turbines in USA has historically grown as onshore wind installations increased, and operators sought turbines with fewer components to improve reliability. Gearbox failures and maintenance downtime in traditional turbines created interest in direct drive systems, which eliminate the gearbox and reduce moving parts. Large-scale wind farms in the USA, particularly in the Midwest, relied on tried-and-tested turbine formats, and the shift toward direct drive began as part of upgrades and repowering projects to enhance uptime and reduce cost per megawatt-hour.
Going forward, future growth is being shaped by the expansion of offshore wind capacity, federal incentive programmes and deeper integration of wind power into the grid. Offshore wind sites in states like New York and Massachusetts favour direct drive turbines because maintenance is more difficult and costly at sea. USA policy incentives that support large-scale wind projects, together with the easing of rare-earth magnet costs and improvements in manufacturing scale, enhance the case for direct drive systems. Constraints remain such as higher initial capital cost compared to geared systems and supply-chain risks for permanent magnets, but the alignment of offshore targets, reliability demands and long-term lifecycle cost considerations suggests a strong growth trajectory for direct drive wind turbines in USA.
The demand for direct drive wind turbines in USA is shaped by the capacity ranges adopted for diverse installation sites and the generator technologies that determine reliability and output stability. Capacity categories include less than 1 MW, 1 MW to 3 MW and more than 3 MW, each supporting different project scales, land constraints and grid requirements. Technology options include permanent magnet synchronous generators and electrically excited synchronous generators, which vary in efficiency, maintenance expectations and component complexity. As developers prioritize dependable operation, reduced mechanical wear and predictable power performance, the combination of capacity choice and generator technology guides turbine selection across USA.

Less than 1 MW turbines account for 46% of total demand across capacity categories in USA. Their leading share reflects suitability for distributed generation projects, community installations and locations where land availability or permitting conditions limit larger units. These turbines provide manageable installation requirements, stable operation and predictable performance in areas with moderate wind resources. Developers value their flexibility in small-scale renewable programs and their compatibility with microgrids and local networks. These characteristics support broad use in rural and semi-urban regions seeking achievable and reliable wind generation capacity.
Demand for less than 1 MW turbines continues to rise as organizations expand localized energy initiatives. The small-capacity range supports staged deployment, enabling gradual expansion without large upfront investment. These turbines offer controlled mechanical stresses and simpler maintenance routines, making them practical for operators with limited technical resources. Their ability to perform consistently across varied wind conditions strengthens long-term adoption. As USA advances community-level energy projects, less than 1 MW turbines remain a key segment shaping demand.

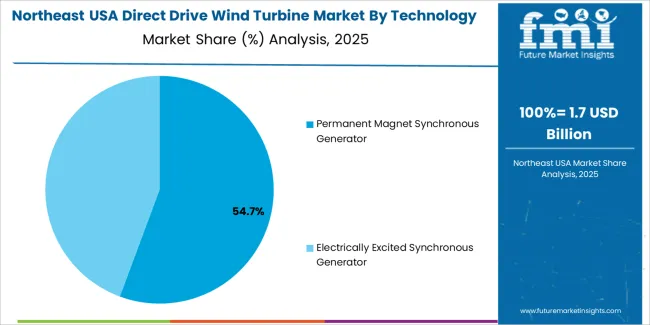
Permanent magnet synchronous generators account for 56.4% of total demand across technology categories in USA. Their leading position reflects efficiency advantages and reduced mechanical complexity that align well with direct drive systems. These generators deliver high torque at low rotational speeds, supporting stable performance under fluctuating wind conditions. Developers value the elimination of excitation systems, which reduces maintenance and improves long-term reliability. The compact structure and predictable behavior under variable loads make this technology suitable for sites prioritizing consistent electricity output.
Demand for permanent magnet synchronous generators also grows as wind projects emphasize long service life and reduced operational downtime. The technology limits wear by removing gearbox components, supporting steady performance across extended operation. Its effectiveness at varied wind speeds improves energy capture in diverse regions across USA. Operators appreciate the stable generation profile, which aligns with grid integration requirements. As the sector continues to adopt systems designed for reliability and efficiency, permanent magnet synchronous generators remain the preferred choice in USA’s direct drive wind turbine installations.
Demand for direct drive wind turbines in the USA is rising as federal and state energy policies encourage grid decarbonisation, while developers seek designs that reduce long-term maintenance in remote wind corridors. Large projects across the Midwest, Plains and coastal regions increasingly prefer gearless systems because they lower service downtime and improve output stability. At the same time, supply-chain gaps for large permanent-magnet components, grid-connection bottlenecks and inflation-related project delays influence how fast this technology scales within the US wind sector.
How Is the US Wind Deployment Pattern Shaping the Direction of Direct Drive Turbine Demand?
Growth in direct drive turbine demand is closely tied to USA land-based wind expansion across states such as Texas, Oklahoma, Kansas and Iowa where developers prioritise high availability and reduced gearbox failures. Rising investment in offshore projects along the East Coast also strengthens interest because direct drive systems suit difficult-access environments. As utilities pursue long-term power-purchase agreements and repowering of ageing wind farms increases, demand shifts toward larger, low-maintenance nacelle designs that can support higher capacity factors under varied wind regimes.
Where Are the Strongest Opportunities Emerging for Direct Drive Turbines in the USA?
Opportunities are strongest in multi-gigawatt onshore corridors, offshore lease areas and repowering projects where operators want reliable machines with predictable service needs. East Coast offshore plans, federal tax incentives and state-level clean-energy standards provide room for rapid adoption of larger direct drive units. Developers engaged in long-term grid-support roles may also see value in technology that offers stable torque at varying wind speeds. Manufacturers that localise assembly, expand component service networks and adapt designs to US logistics constraints are positioned to benefit.
What Factors Are Restricting Broader Adoption of Direct Drive Turbines in the USA?
Adoption is limited by high upfront turbine costs, long lead times for specialised generators and constraints in domestic magnet and component supply. Grid interconnection queues delay project timelines, making some developers hesitant to adopt newer turbine platforms. Transport limitations for large nacelles on US road and rail routes also affect placement options. Cost pressures from fluctuating tax incentives and inflation challenge financing of large projects. These elements slow how quickly direct drive technology becomes a central part of US wind-fleet expansion.
| Region | CAGR (%) |
|---|---|
| West USA | 17.7% |
| South USA | 15.9% |
| Northeast USA | 14.2% |
| Midwest USA | 12.3% |
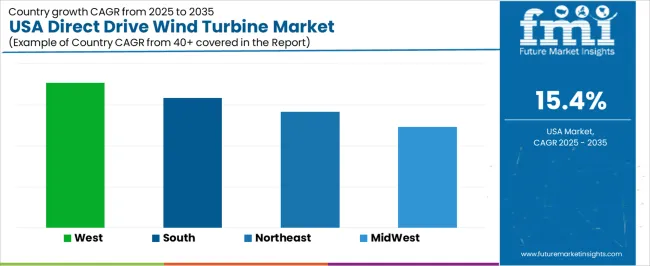
Demand for direct drive wind turbines in the USA is rising quickly across regions, with the West leading at 17.7%. Growth in this region reflects strong investment in large-scale wind projects and ongoing preference for turbine systems with fewer mechanical parts and lower maintenance needs. The South follows at 15.9%, supported by expanding wind installations across plains and coastal states. The Northeast records 14.2%, shaped by interest in offshore wind developments and steady regional commitment to renewable energy. The Midwest grows at 12.3%, where long-term wind corridors and active utility projects drive continuous uptake. These regional patterns indicate broad national movement toward direct drive technology in modern wind power expansion.
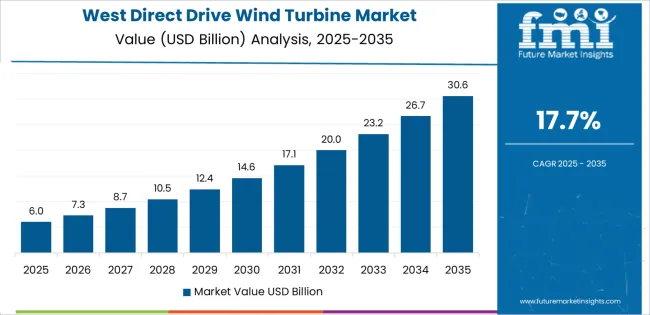
West USA is projected to grow at a CAGR of 17.7% through 2035 in demand for direct drive wind turbines. California, Oregon, and Washington are increasingly installing turbines for utility-scale and commercial renewable energy projects. Rising focus on clean energy adoption, carbon reduction goals, and grid efficiency drives adoption. Manufacturers provide high-capacity, reliable direct drive turbines suitable for onshore and offshore applications. Distributors ensure accessibility across renewable energy developers, utilities, and industrial facilities. Expansion in wind farm construction, renewable energy policy support, and technological upgrades supports steady adoption of direct drive wind turbines in West USA.
South USA is projected to grow at a CAGR of 15.9% through 2035 in demand for direct drive wind turbines. Texas, Florida, and surrounding regions are increasingly deploying turbines for utility-scale and commercial renewable energy projects. Rising focus on carbon reduction, renewable energy targets, and operational efficiency drives adoption. Manufacturers provide turbines compatible with various wind conditions and grid integration requirements. Distributors ensure accessibility across utilities, energy developers, and industrial facilities. Expansion in wind energy projects, grid modernization, and renewable energy policy support steady adoption of direct drive wind turbines across South USA.
Northeast USA is projected to grow at a CAGR of 14.2% through 2035 in demand for direct drive wind turbines. New York, Pennsylvania, and surrounding regions are gradually deploying turbines for commercial and utility-scale renewable energy projects. Rising demand for clean energy, grid efficiency, and low-carbon initiatives drives adoption. Manufacturers supply high-capacity direct drive turbines suitable for onshore and nearshore installations. Distributors ensure accessibility across utilities, renewable energy developers, and industrial facilities. Expansion in wind farm construction, renewable energy infrastructure, and energy policy incentives supports steady adoption of direct drive wind turbines across Northeast USA.
Midwest USA is projected to grow at a CAGR of 12.3% through 2035 in demand for direct drive wind turbines. Illinois, Ohio, and surrounding regions are gradually adopting turbines for utility-scale and commercial renewable energy projects. Rising focus on renewable energy production, carbon reduction, and grid reliability drives adoption. Manufacturers provide turbines compatible with diverse wind conditions and energy distribution systems. Distributors ensure accessibility across energy developers, utilities, and industrial facilities. Expansion in wind energy projects, renewable infrastructure, and grid modernization supports steady adoption of direct drive wind turbines across Midwest USA.
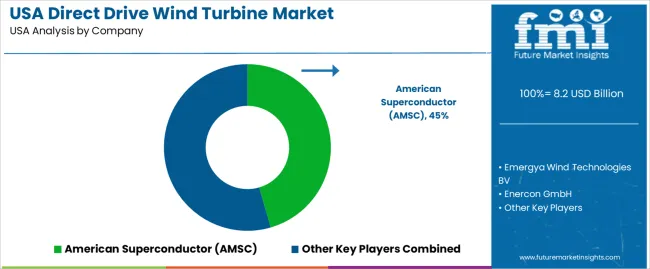
Demand for direct drive wind turbines in USA is rising as energy developers look for systems that provide high reliability, reduced maintenance and better long-term operating efficiency. Direct drive designs remove gearbox assemblies, which can lower mechanical wear and support consistent performance in variable wind conditions. Many projects across coastal, plains and mountain regions require turbines that handle wide temperature ranges and demanding service intervals. Grid operators also expect steady capacity factors as more wind assets integrate into regional transmission systems. Developers value technologies that minimise downtime and simplify service planning across multi-year operating cycles. These expectations align well with direct drive platforms that deliver strong energy output and predictable maintenance schedules for utility-scale wind projects in the United States.
Key players shaping USA’s direct drive wind turbine landscape include American Superconductor (AMSC), Enercon GmbH, GE Renewable Energy and Emergya Wind Technologies BV. AMSC contributes drivetrain and power-electronics technology used in specialised turbine configurations. GE Renewable Energy maintains a broad project base in the United States and deploys direct drive units within select models. Enercon brings long experience with gearless turbines and supplies equipment for American projects through regional partners. Emergya supports mid-scale projects through tailored turbine packages. To reflect the USA market structure, domestic engineering firms and project integrators participate by adapting foundations, nacelle components and grid interfaces for American sites. This mix of global manufacturers and USA support networks shapes how direct drive systems are selected, installed and operated across American wind developments.
| Items | Values |
|---|---|
| Quantitative Units (2025) | USD billion |
| Capacity | Less than 1 MW, 1 MW to 3 MW, More than 3 MW |
| Technology | Permanent Magnet Synchronous Generator, Electrically Excited Synchronous Generator |
| Application | Offshore, Onshore |
| Region | Northeast, West, Midwest, South |
| Countries Covered | USA |
| Key Companies Profiled | American Superconductor (AMSC), Enercon GmbH, GE Renewable Energy, Emergya Wind Technologies BV |
| Additional Attributes | Dollar by sales by capacity, technology and application; regional CAGR and growth patterns; adoption trends in offshore and onshore projects; influence of federal and state renewable energy incentives; role of turbine size, rotor diameter, and generator efficiency; impact of permanent magnet availability; operational reliability and reduced maintenance; project integration and grid compatibility; repowering and modernization of wind farms; offshore project deployment challenges; turbine lifecycle and service intervals; developer and utility procurement behavior; regional wind corridor development; local assembly and service networks. |
The demand for direct drive wind turbine in usa is estimated to be valued at USD 8.2 billion in 2025.
The market size for the direct drive wind turbine in usa is projected to reach USD 34.4 billion by 2035.
The demand for direct drive wind turbine in usa is expected to grow at a 15.4% CAGR between 2025 and 2035.
The key product types in direct drive wind turbine in usa are less than 1mw, 1mw to 3mw and more than 3mw.
In terms of technology, permanent magnet synchronous generator segment is expected to command 56.4% share in the direct drive wind turbine in usa in 2025.


Our Research Products

The "Full Research Suite" delivers actionable market intel, deep dives on markets or technologies, so clients act faster, cut risk, and unlock growth.

The Leaderboard benchmarks and ranks top vendors, classifying them as Established Leaders, Leading Challengers, or Disruptors & Challengers.

Locates where complements amplify value and substitutes erode it, forecasting net impact by horizon

We deliver granular, decision-grade intel: market sizing, 5-year forecasts, pricing, adoption, usage, revenue, and operational KPIs—plus competitor tracking, regulation, and value chains—across 60 countries broadly.

Spot the shifts before they hit your P&L. We track inflection points, adoption curves, pricing moves, and ecosystem plays to show where demand is heading, why it is changing, and what to do next across high-growth markets and disruptive tech

Real-time reads of user behavior. We track shifting priorities, perceptions of today’s and next-gen services, and provider experience, then pace how fast tech moves from trial to adoption, blending buyer, consumer, and channel inputs with social signals (#WhySwitch, #UX).

Partner with our analyst team to build a custom report designed around your business priorities. From analysing market trends to assessing competitors or crafting bespoke datasets, we tailor insights to your needs.
Supplier Intelligence
Discovery & Profiling
Capacity & Footprint
Performance & Risk
Compliance & Governance
Commercial Readiness
Who Supplies Whom
Scorecards & Shortlists
Playbooks & Docs
Category Intelligence
Definition & Scope
Demand & Use Cases
Cost Drivers
Market Structure
Supply Chain Map
Trade & Policy
Operating Norms
Deliverables
Buyer Intelligence
Account Basics
Spend & Scope
Procurement Model
Vendor Requirements
Terms & Policies
Entry Strategy
Pain Points & Triggers
Outputs
Pricing Analysis
Benchmarks
Trends
Should-Cost
Indexation
Landed Cost
Commercial Terms
Deliverables
Brand Analysis
Positioning & Value Prop
Share & Presence
Customer Evidence
Go-to-Market
Digital & Reputation
Compliance & Trust
KPIs & Gaps
Outputs
Full Research Suite comprises of:
Market outlook & trends analysis
Interviews & case studies
Strategic recommendations
Vendor profiles & capabilities analysis
5-year forecasts
8 regions and 60+ country-level data splits
Market segment data splits
12 months of continuous data updates
DELIVERED AS:
PDF EXCEL ONLINE
Direct Drive Wind Turbine Market Growth - Trends & Forecast 2025 to 2035
Demand for Direct Drive Wind Turbine in Japan Size and Share Forecast Outlook 2025 to 2035
Wind Turbine Pitch and Yaw Drive Market Size and Share Forecast Outlook 2025 to 2035
Wind Turbine Blade Market Size and Share Forecast Outlook 2025 to 2035
Wind Turbine Forging Market Size and Share Forecast Outlook 2025 to 2035
Wind Turbine Industry Analysis in Latin America Growth - Trends & Forecast 2025 to 2035
Wind Turbine Market Analysis and Insights - 2025 to 2035
Wind Turbine Automation Market Insights - Growth & Forecast through 2035
Wind Turbine Composite Material Market Size 2024-2034
Wind Turbine Blade Repair Material Market Growth – Trends & Forecast 2024-2034
Wind Turbine Shaft Market
Small Wind Turbine Market Size and Share Forecast Outlook 2025 to 2035
Marine Wind Turbine Market
Onshore Wind Turbine Bearing Market Size and Share Forecast Outlook 2025 to 2035
Offshore Wind Turbine Bearing Market Size and Share Forecast Outlook 2025 to 2035
Offshore Wind Turbine Blade Market Size and Share Forecast Outlook 2025 to 2035
Offshore Wind Turbine Market Size and Share Forecast Outlook 2025 to 2035
Demand for Microturbines in USA Size and Share Forecast Outlook 2025 to 2035
Demand for Unidirectional ESD Diode in USA Size and Share Forecast Outlook 2025 to 2035
Demand for Direct Thermal Printing Film in USA Size and Share Forecast Outlook 2025 to 2035

Thank you!
You will receive an email from our Business Development Manager. Please be sure to check your SPAM/JUNK folder too.
Chat With
MaRIA