The demand for microturbines in the USA is expected to grow from USD 32.2 million in 2025 to USD 85.6 million by 2035, reflecting a CAGR of 10.30%. Microturbines, which are small-scale, high-efficiency turbines used for power generation, are becoming increasingly popular due to their ability to provide reliable, on-demand energy solutions with minimal emissions. These systems are ideal for various applications, including distributed power generation, backup power systems, and renewable energy integration. As industries and commercial sectors seek to reduce energy costs and improve efficiency, microturbines are emerging as an attractive solution.
The rising demand for sustainable and clean energy alternatives is a key driver of the growth in the microturbine industry. Microturbines, which can operate on a variety of fuels, including natural gas and biogas, are seen as an essential component of the transition to cleaner energy sources. Advancements in microturbine technology, such as improvements in fuel efficiency, size reduction, and integration with renewable energy sources, will continue to fuel industry growth. As regulations become more stringent regarding emissions and energy consumption, microturbines are expected to play a critical role in meeting these demands.
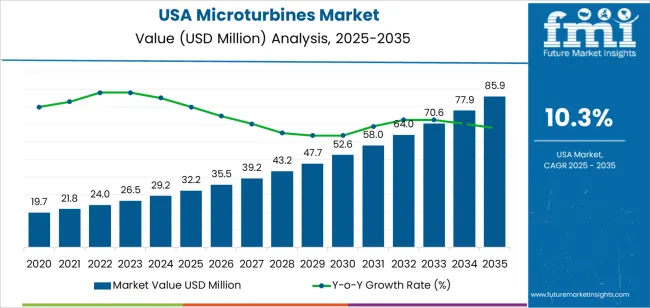
Between 2025 and 2030, the demand for microturbines in the USA will experience steady year-on-year (YoY) growth, increasing from USD 19.8 million to USD 32.2 million. This gradual rise is driven by growing industry acceptance, as industries and businesses seek more efficient, decentralized energy generation solutions. Technological advancements in microturbine efficiency, coupled with regulatory incentives for energy efficiency and sustainability, will support this steady demand. As more industries look for reliable and environmentally friendly energy alternatives, microturbines are gaining traction as a cost-effective solution for power generation.
From 2030 to 2035, the YoY growth rate will accelerate significantly, with demand rising from USD 32.2 million to USD 85.6 million. This phase will be characterized by the wider adoption of microturbines across industrial and commercial sectors. The push for cleaner and more efficient energy generation, along with the increasing integration of microturbines into renewable energy systems, will drive this sharp growth. As businesses and industries continue to prioritize sustainable energy practices, microturbines will play a critical role in reducing operational energy costs and enhancing power reliability. The increasing reliance on distributed energy solutions and the demand for energy resilience will further contribute to the rapid expansion of the microturbine industry during this period, making microturbines a key component of future energy systems.
| Metric | Value |
|---|---|
| Demand for Microturbines in USA Value (2025) | USD 32.2 million |
| Demand for Microturbines in USA Forecast Value (2035) | USD 85.6 million |
| Demand for Microturbines in USA Forecast CAGR (2025-2035) | 10.3% |
The demand for microturbines in the USA is increasing due to their ability to provide efficient, decentralized power generation. As industries and commercial sectors seek more reliable and cost-effective energy solutions, microturbines offer benefits like low emissions, reduced noise, and the ability to operate on a variety of fuels. These factors make them increasingly popular in applications such as remote energy production, backup power, and cogeneration systems.
Rising energy costs and the growing need for sustainable energy solutions are key drivers behind the adoption of microturbines. Their compact size and high efficiency make them suitable for distributed energy generation, which is becoming an integral part of the energy transition in the USA. Furthermore, advancements in microturbine technology, including improvements in fuel flexibility and operational efficiency, have made these systems more attractive to a broader range of users.
The demand is also fueled by government incentives and policies promoting clean energy and energy efficiency. These regulations are pushing industries to adopt cleaner power solutions, and microturbines are well-positioned to meet these needs. As businesses and municipalities continue to prioritize energy independence and environmental responsibility, the demand for microturbines is expected to rise steadily through 2035.
Demand for microturbines in the United States reflects decentralised power requirements across industrial, commercial, and residential applications. Power-rating preferences correspond to thermal needs, electrical-output expectations, and system-integration requirements. Application distribution highlights microturbine use for standby and continuous-support operations across facilities seeking reliability during outages or grid fluctuations. End-user patterns reflect differences in energy consumption, load stability, and backup-power strategies across industries and households.
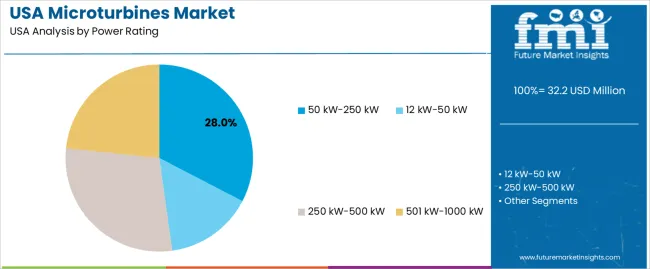
Microturbines rated 50–250 kW hold 28.2% of national demand and represent the leading power segment. These units support mid-sized industrial loads, commercial complexes, and combined heat-and-power applications requiring balanced electrical and thermal output. Systems rated 250–500 kW account for 24.8%, serving larger facilities with higher energy intensity and longer continuous-operation cycles. Units rated 501–1000 kW hold 20.0%, supporting heavy-load environments demanding extended reliability. Systems rated 12–50 kW represent 13.0%, while the base listing at 14.0% reflects the smallest-capacity adoption. Power-rating distribution aligns with facility size, thermal-recovery requirements, and demand-response strategies across USA users.
Key drivers and attributes:
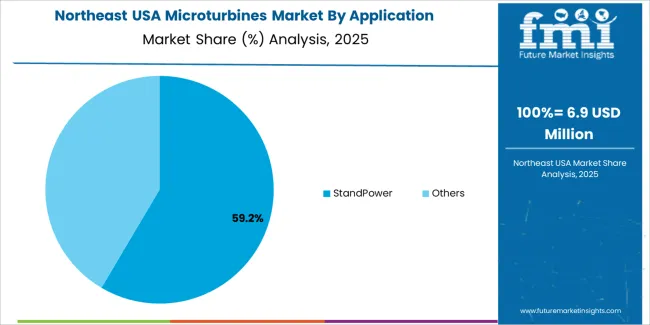
Standby-power use holds 59.2% of national demand and represents the dominant application category for microturbines. Facilities employ microturbines to maintain critical operations during outages, voltage instability, and peak-demand events. Their stable operation, compact footprint, and low-maintenance requirements support reliable backup capability. Other applications account for 42.0%, including combined heat-and-power, continuous onsite generation, and supplemental power for load balancing. Application patterns reflect reliability expectations, regulatory compliance needs, and operational-continuity priorities across diverse USA facilities integrating microturbines into distributed-generation strategies.
Key drivers and attributes:
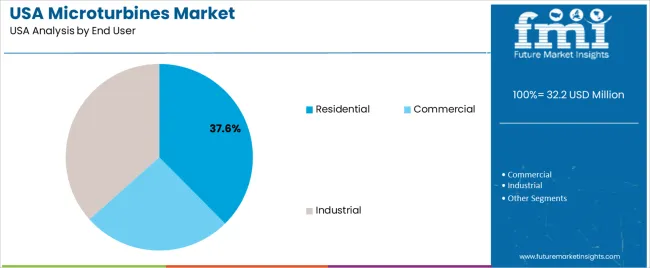
Residential users hold 37.6% of national demand and represent the leading end-user category. Households adopt microturbines for dependable backup, reduced outage risk, and integration with small-scale combined heat-and-power systems. Industrial users account for 36.6%, relying on microturbines to maintain stable operations in manufacturing, processing, and energy-intensive activities. Commercial users represent 25.8%, deploying microturbines in offices, retail facilities, and institutional buildings requiring consistent power quality. End-user distribution reflects varying load profiles, energy-efficiency priorities, and reliability expectations across USA buildings that incorporate distributed-generation resources.
Key drivers and attributes:
Key drivers include the increasing shift toward distributed generation and combined heat & power (CHP) systems in industrial and commercial settings, the need for resilient onsite power (especially in remote, oil & gas or micro‑grid deployments), and tighter emissions and efficiency regulations which favour compact gas‑ or biogas‑fired turbines. Restraints include the relatively high upfront cost of microturbine systems, lower awareness or adoption of small‑scale turbine technologies compared with conventional generation, competition from alternatives (solar PV plus storage, reciprocating engines), and integration challenges in existing infrastructure especially for retrofits.
Why is Demand for Microturbines Growing in USA?
In the USA, demand for microturbines is growing because many industries and commercial sites are seeking reliable, high‑efficiency power solutions that also recover waste heat, improving total energy economics. The drive to decarbonise and improve energy resilience is encouraging deployment of onsite generation, and microturbines offer compact size, fuel flexibility (natural gas, biogas) and low emissions. Growing segments such as data centres, distributed industrial sites and oil & gas operations need power systems that can operate off‑grid or in combination with renewables, which supports microturbine uptake.
How are Technological Innovations Driving Growth of Microturbines in USA?
Technological innovations are advancing the microturbine sector in the USA by improving efficiency, fuel flexibility and modularity. Advances include improved turbine blade and combustion designs that raise electrical efficiency, systems capable of running on biogas or landfill gas which widen application scope, modular packaged micro‑grid‑ready solutions for commercial and industrial use, and enhanced controls, monitoring and remote diagnostics that reduce maintenance and total cost of ownership. These innovations make microturbines more competitive and easier to integrate across diverse applications.
What are the Key Challenges Limiting Adoption of Microturbines in USA?
Despite increasing interest, adoption of microturbines in the USA faces several barriers. The major issue is capital cost: microturbine systems remain more expensive per kilowatt than simpler alternatives in many use‑cases, which can deter cost‑conscious buyers. Another challenge is that many facilities lack the infrastructure or fuel source to optimise combined heat & power benefits (which are a key value driver). Regulatory, permitting and interconnection processes can be complex and slow, particularly for biogas or off‑grid applications. Competition from solar plus storage and from established engine‑generator technologies may limit penetration in some segments.
Demand for microturbines in the USA is growing across all regions, with the West leading at an 11.8% CAGR. This growth is driven by the region's emphasis on renewable energy solutions and distributed generation. The South follows with a 10.6% CAGR, supported by the region's industrial and manufacturing sectors, where microturbines are increasingly adopted for energy efficiency and sustainability. The Northeast shows a 9.4% CAGR, driven by the region’s push for cleaner energy solutions and decentralized power generation in urban centers. The Midwest experiences a moderate 8.2% CAGR, with demand driven by the region’s large industrial base and the adoption of microturbines for more reliable and efficient energy in manufacturing and agricultural sectors.
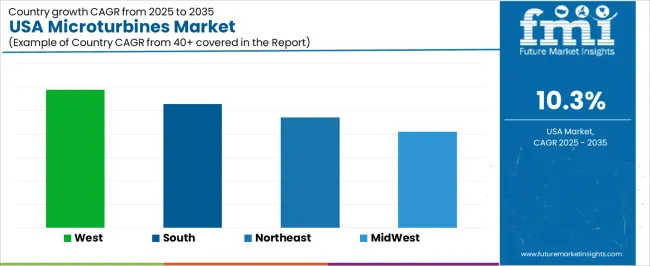
| Region | CAGR (%) |
|---|---|
| West | 11.8% |
| South | 10.6% |
| Northeast | 9.4% |
| Midwest | 8.2% |
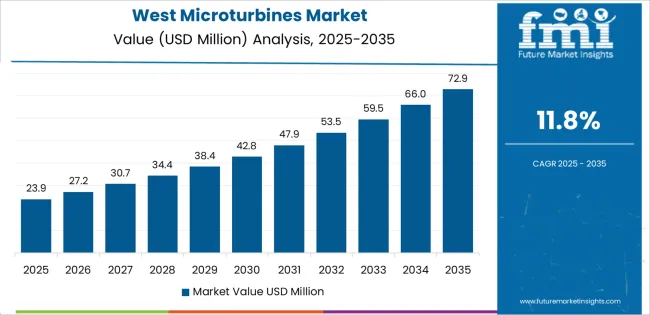
The West is experiencing the highest demand for microturbines in the USA, with an 11.8% CAGR. This growth is driven by the region’s increasing focus on renewable energy solutions and energy efficiency in various industries. The West is home to major technological hubs, including California, where innovation in clean energy technologies such as microturbines is prominent. With a strong push towards sustainability and reducing greenhouse gas emissions, industries like manufacturing, healthcare, and data centers in the West are increasingly adopting microturbines to meet their energy needs efficiently. Microturbines are seen as an ideal solution for distributed generation, offering reliable, low-emission power generation. The West’s expansive adoption of green technologies, coupled with favorable government policies and incentives for renewable energy, ensures that demand for microturbines will continue to grow at a robust pace in the region.
The South is seeing strong demand for microturbines in the USA, with a 10.6% CAGR. The region’s growing industrial and manufacturing base, combined with increasing investments in renewable energy infrastructure, is driving the adoption of microturbines. States like Texas, Florida, and Georgia, with their large energy-consuming industries, are increasingly turning to microturbines for efficient and sustainable power generation. These systems provide reliable on-site energy, which is particularly beneficial in areas with high power demand and infrastructure challenges. As industries in the South focus on improving energy efficiency and reducing their carbon footprints, microturbines are becoming an integral part of their energy solutions. The South’s favorable climate for renewable energy generation, including wind and solar power, complements the growing need for efficient backup and distributed generation systems like microturbines.

The Northeast is experiencing steady demand for microturbines in the USA, with a 9.4% CAGR. This growth is primarily driven by the region’s focus on reducing emissions and improving energy efficiency in various sectors. The Northeast is home to many high-density urban centers, including New York and Boston, where energy efficiency and reliability are crucial. Microturbines are increasingly being used in buildings, hospitals, and universities to provide reliable power and backup solutions while also lowering energy costs. As the region continues to prioritize sustainability and compliance with environmental regulations, the demand for clean energy technologies like microturbines is expected to grow. The Northeast’s focus on decentralizing energy generation and improving grid resilience is increasing the need for distributed power generation solutions such as microturbines. This trend will continue to fuel the growth of microturbine adoption in the region.
The Midwest is experiencing moderate demand for microturbines in the USA, with an 8.2% CAGR. The region’s strong industrial base, particularly in manufacturing, agriculture, and transportation, is driving the adoption of microturbines for efficient and decentralized power generation. States like Illinois, Ohio, and Michigan are home to large energy-consuming sectors that require reliable, cost-effective energy solutions. Microturbines provide industries in the Midwest with a way to reduce energy costs, lower emissions, and improve energy security. The region’s agricultural sector, which has high energy demands for irrigation and processing, is increasingly adopting microturbines for more sustainable energy solutions. As industries in the Midwest seek ways to meet environmental standards and improve operational efficiency, the demand for microturbines is expected to rise, driven by both regulatory incentives and economic benefits. The region’s steady industrial growth ensures a continued demand for these efficient energy systems.
In the USA, demand for microturbines is expanding as industries and commercial facilities increasingly adopt distributed generation and combined heat & power (CHP) systems. Microturbines generate electricity on-site while recovering waste heat, making them attractive for efficiency-focused users. Drivers of demand include the push for reliable on-site power, growth in industrial applications with heat and power needs, and interest in decentralized and resilient energy infrastructures.
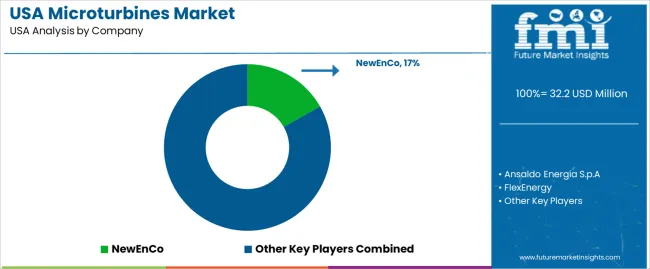
Key suppliers in the USA microturbine sector include NewEnCo with a 16.8% share, Ansaldo Energia S.p.A, FlexEnergy, NewEnCo Ltd., and Elliot Company Inc. These firms differentiate through technology innovation, such as multi-fuel capability, compact size, and high efficiency, strong service and maintenance networks, and partnerships with industrial and commercial end-users. NewEnCo’s share reflects its leadership in certain industry niches and its ability to respond to growing CHP and backup power demand.
Competitive dynamics are influenced by several factors. First, advancements in microturbine efficiency, fuel flexibility (natural gas, biogas, hydrogen), and modularity give companies a technical edge. Second, regulatory support and incentives for on-site power generation and energy recovery elevate adoption rates. Third, challenges include the high upfront cost of microturbine systems, competition from alternative technologies (such as battery storage, fuel cells, and large-scale turbines), and the need for integration into complex facility systems. Suppliers that can offer strong performance, cost-effective deployment, and robust service support will be best positioned to succeed in the USA microturbine demand ecosystem.
| Items | Values |
|---|---|
| Quantitative Units (2025) | USD million |
| Power Rating | 50 kW-250 kW, 12 kW-50 kW, 250 kW-500 kW, 501 kW-1000 kW |
| Application | StandPower, Others |
| End User | Residential, Commercial, Industrial |
| Region | West USA, South USA, Northeast USA, Midwest USA |
| Countries Covered | USA |
| Key Companies Profiled | Procter & Gamble Company, Colgate-Palmolive, Johnson & Johnson, Sunstar Suisse SA, Prestige Consumer (DenTek Oral Care Inc.) |
| Additional Attributes | Dollar sales by power rating and application; regional CAGR and adoption trends; demand trends in microturbines; growth in residential, commercial, and industrial sectors; technology adoption for energy generation; vendor offerings including power systems, services, and integration solutions; regulatory influences and industry standards |
The demand for microturbines in usa is estimated to be valued at USD 32.2 million in 2025.
The market size for the microturbines in usa is projected to reach USD 85.9 million by 2035.
The demand for microturbines in usa is expected to grow at a 10.3% CAGR between 2025 and 2035.
The key product types in microturbines in usa are 50 kw-250 kw, 12 kw-50 kw, 250 kw-500 kw and 501 kw-1000 kw.
In terms of application, standpower segment is expected to command 58.0% share in the microturbines in usa in 2025.


Our Research Products

The "Full Research Suite" delivers actionable market intel, deep dives on markets or technologies, so clients act faster, cut risk, and unlock growth.

The Leaderboard benchmarks and ranks top vendors, classifying them as Established Leaders, Leading Challengers, or Disruptors & Challengers.

Locates where complements amplify value and substitutes erode it, forecasting net impact by horizon

We deliver granular, decision-grade intel: market sizing, 5-year forecasts, pricing, adoption, usage, revenue, and operational KPIs—plus competitor tracking, regulation, and value chains—across 60 countries broadly.

Spot the shifts before they hit your P&L. We track inflection points, adoption curves, pricing moves, and ecosystem plays to show where demand is heading, why it is changing, and what to do next across high-growth markets and disruptive tech

Real-time reads of user behavior. We track shifting priorities, perceptions of today’s and next-gen services, and provider experience, then pace how fast tech moves from trial to adoption, blending buyer, consumer, and channel inputs with social signals (#WhySwitch, #UX).

Partner with our analyst team to build a custom report designed around your business priorities. From analysing market trends to assessing competitors or crafting bespoke datasets, we tailor insights to your needs.
Supplier Intelligence
Discovery & Profiling
Capacity & Footprint
Performance & Risk
Compliance & Governance
Commercial Readiness
Who Supplies Whom
Scorecards & Shortlists
Playbooks & Docs
Category Intelligence
Definition & Scope
Demand & Use Cases
Cost Drivers
Market Structure
Supply Chain Map
Trade & Policy
Operating Norms
Deliverables
Buyer Intelligence
Account Basics
Spend & Scope
Procurement Model
Vendor Requirements
Terms & Policies
Entry Strategy
Pain Points & Triggers
Outputs
Pricing Analysis
Benchmarks
Trends
Should-Cost
Indexation
Landed Cost
Commercial Terms
Deliverables
Brand Analysis
Positioning & Value Prop
Share & Presence
Customer Evidence
Go-to-Market
Digital & Reputation
Compliance & Trust
KPIs & Gaps
Outputs
Full Research Suite comprises of:
Market outlook & trends analysis
Interviews & case studies
Strategic recommendations
Vendor profiles & capabilities analysis
5-year forecasts
8 regions and 60+ country-level data splits
Market segment data splits
12 months of continuous data updates
DELIVERED AS:
PDF EXCEL ONLINE
USA Medical Coding Market Size and Share Forecast Outlook 2025 to 2035
USA Labels Market Size and Share Forecast Outlook 2025 to 2035
USA Plant-based Creamers Market Size and Share Forecast Outlook 2025 to 2035
USA Barrier Coated Paper Market Size and Share Forecast Outlook 2025 to 2035
USA Electronic Health Records (EHR) Market Size and Share Forecast Outlook 2025 to 2035
USA Animal Model Market Size and Share Forecast Outlook 2025 to 2035
USA and Canada Packer Bottle Market Size and Share Forecast Outlook 2025 to 2035
USA Stretch Hood Films Market Size and Share Forecast Outlook 2025 to 2035
USA and Canada Fence Screen Market Size and Share Forecast Outlook 2025 to 2035
USA Lubricant Contaminated HDPE Container Waste Market Size and Share Forecast Outlook 2025 to 2035
USA Commercial Walk-In Refrigeration Market Size and Share Forecast Outlook 2025 to 2035
USA & Canada Pre-painted Steel Roofing and Cladding Market Size and Share Forecast Outlook 2025 to 2035
USA Residential Cotton Candy Maker Market Size and Share Forecast Outlook 2025 to 2035
USA Faith Based Tourism Market Size and Share Forecast Outlook 2025 to 2035
United States NFC Lemon Juice Market Analysis - Size, Growth and Forecast 2025 to 2035
USA and Canada Copper Market Insights - Demand, Size & Industry Trends 2025 to 2035
USA Ground and Precipitated Calcium Carbonate Market Growth by Product Type, Application, End-Use, and Region in 2025 to 2035
United States Animal Feed Additives Market Report – Trends, Growth & Forecast 2025–2035
United States Wild Rice Market Outlook – Size, Demand & Forecast 2025–2035
United States Wood Vinegar Market Analysis – Trends, Growth & Forecast 2025–2035

Thank you!
You will receive an email from our Business Development Manager. Please be sure to check your SPAM/JUNK folder too.
Chat With
MaRIA