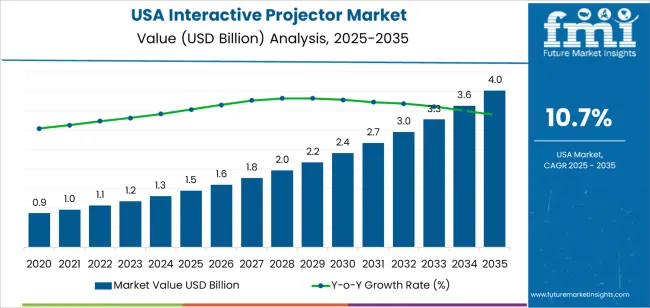
The USA interactive projector demand is valued at USD 1.5 billion in 2025 and is expected to reach USD 4.0 billion by 2035, recording a CAGR of 10.7%. Demand is supported by continued integration of digital learning tools across schools, universities, training centres, and corporate environments. Interactive projectors enable collaborative instruction, multi-user engagement, and touch-enabled visualisation, making them suitable for classrooms, meeting rooms, and hybrid-learning settings. Growth is also shaped by increased investment in education technology, expansion of digital-content platforms, and replacement cycles for legacy projection systems.
LCD systems represent the leading technology due to their stable colour output, lower heat generation, and consistent performance in varied lighting conditions. These systems support high-resolution display, interactive touch layers, and real-time annotation, making them adaptable for both instructional and presentation functions. Wider availability of compact LCD-based units and improvements in lamp-free light sources continue to influence procurement across education and commercial facilities.
Demand is strongest in the West, South, and Northeast, where education networks, corporate campuses, and training institutions drive adoption of interactive display technologies. Key suppliers include Seiko Epson Corporation, BenQ Corporation, Panasonic Corporation, Dell Technologies Inc., NEC Display Solutions Ltd., and Optoma Technology Inc. These suppliers provide interactive LCD projectors with integrated calibration tools, wireless-connectivity features, and software environments suited to classroom and meeting-room deployment.
Peak-to-trough analysis shows an early peak between 2025 and 2029 as schools, training centres, and corporate workplaces expand interactive-display capacity. Increased emphasis on hybrid learning, collaborative work environments, and large-format touch-enabled projection will support strong early procurement. Upgrades in lamp-free laser engines, gesture-recognition features, and short-throw optics will reinforce this peak phase.
A moderate trough may appear between 2030 and 2032 as institutions complete major digital-classroom and meeting-room conversions. During this period, spending will ease temporarily as organisations shift toward utilisation optimisation, software updates, and maintenance cycles rather than new installations. Budget realignments in education and corporate sectors may also contribute to softer annual demand. After 2032, the segment is expected to regain upward momentum, driven by replacement cycles, improved interactive-tracking accuracy, and deeper integration with collaboration platforms. The peak-to-trough pattern reflects a technology segment influenced by project-based deployment cycles, equipment lifespans, and standardised digital-facility planning across USA education and professional environments.
| Metric | Value |
|---|---|
| USA Interactive Projector Sales Value (2025) | USD 1.5 billion |
| USA Interactive Projector Forecast Value (2035) | USD 4.0 billion |
| USA Interactive Projector Forecast CAGR (2025 to 2035) | 10.7% |
The interactive projector industry in the USA is expanding because educational institutions, corporate training centres and government agencies are adopting technology to enhance engagement, collaboration and remote-learning capabilities. Institutions require devices that support touch, annotation, wireless connectivity and large-format display to facilitate hybrid classrooms and modern meeting rooms. Investment in upgrading traditional projectors to interactive systems is supported by continued growth in e-learning, blended training and digital workspace solutions.
Advances in ultra-short-throw projection, multi-user interaction and integrated software make these projectors more practical for diverse room sizes and user needs. Declining hardware costs and increasing support for cloud-based deployment boost accessibility for mid-sized organisations and smaller schools. Constraints include competition from interactive flat-panel displays, installation and room-integration complexity, and the ongoing need for user training and support infrastructure. Some schools and businesses may delay purchases until older equipment fully deprecates or alternative display solutions mature.
Demand for interactive projectors in the United States reflects usage across classrooms, offices, training centres, and collaborative environments where touch-enabled and annotation-capable projection systems enhance group interaction. Technology distribution is shaped by image quality, brightness needs, and cost considerations. Resolution patterns reflect clarity requirements for instructional and professional presentations, while projection-type preferences align with room size, installation flexibility, and viewing-distance constraints.
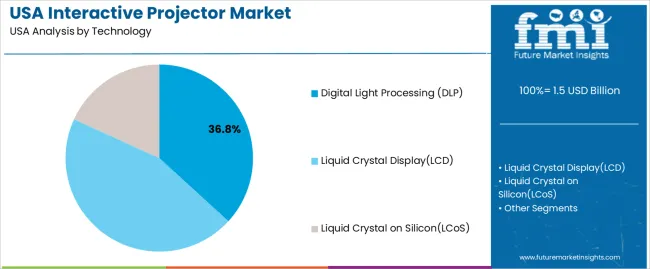
LCD-based interactive projectors hold 45.0% of USA demand and represent the leading technology category. LCD systems provide colour accuracy, uniform brightness, and consistent performance in classrooms and meeting rooms with varied ambient light conditions. Digital Light Processing (DLP) models account for 36.8%, offering reliable motion handling and compact system designs suitable for education and business use. Liquid Crystal on Silicon (LCoS) represents 18.2%, supporting high-contrast and fine-detail imaging for specialised instructional and design applications. Technology distribution reflects differences in display clarity, maintenance expectations, and cost structures across institutions that rely on stable projection for group engagement.
Key drivers and attributes:
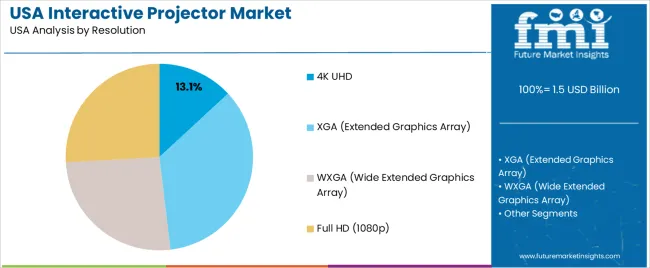
XGA projectors hold 35.0% of demand and form the leading resolution category. They support standard classroom and meeting environments where clear text, diagrams, and instructional content are prioritised over ultra-high-definition detail. WXGA represents 26.0%, offering widescreen compatibility suited for modern content formats and hybrid learning platforms. Full HD (1080p) accounts for 25.9%, reflecting increased use in settings requiring sharper visuals for video integration and detailed presentations. 4K UHD holds 13.1%, serving advanced simulation rooms, design studios, and premium corporate environments. Resolution distribution reflects trade-offs between cost, clarity needs, and device compatibility with existing content systems.
Key drivers and attributes:
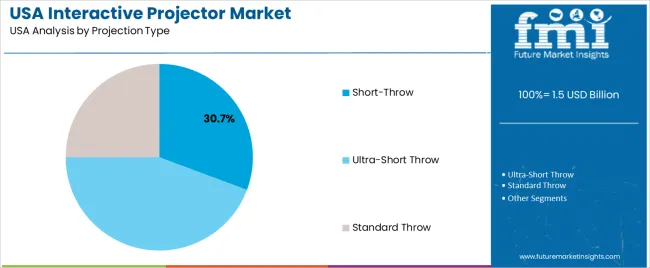
Ultra-short-throw projectors hold 44.3% of national demand and represent the leading projection type. Their ability to project large images from very short distances reduces shadows, improves legibility, and supports interactive use in classrooms and collaborative spaces. Short-throw units represent 30.7%, serving small to medium rooms where limited wall distance requires compact projection setups. Standard-throw projectors account for 25.0%, supporting larger rooms and settings where installation distance is not restricted. Projection-type distribution reflects spatial constraints, mounting preferences, and the need for minimal user obstruction during interactive operation.
Key drivers and attributes:
Growing adoption of hybrid learning, wider use of collaboration tools, and increasing investment in educational technology are driving demand.
Demand for interactive projectors in the United States is increasing as schools, universities and businesses expand digital learning and remote-collaboration environments. Classrooms use interactive projectors to enable annotation, touch interaction and shared digital content across large surfaces. Corporate teams rely on interactive projection for hybrid meetings, training sessions and group ideation. Educational-technology funding, combined with the shift toward blended learning models, strengthens demand for systems that enhance engagement and support multi-device connectivity.
High initial cost, competition from interactive flat-panel displays, and uncertainty around measurable performance benefits restrain adoption.
Interactive projectors require installation, calibration and periodic maintenance which increases upfront and operational costs. Some institutions prefer interactive flat-panel displays that offer simpler installation and more stable brightness, reducing the need for projector-based solutions. Users may also hesitate when the return on investment is difficult to quantify, especially if digital adoption levels vary across classrooms or teams. These factors slow broader deployment across smaller districts and budget-constrained organisations.
Growth of ultra-short-throw projectors, increased software integration and rising use beyond education into business and healthcare define key trends.
Manufacturers are expanding ultra-short-throw models that minimise shadows and improve interaction quality. Projectors with built-in collaboration software, cloud connectivity and touch-enabled interfaces are becoming more common, supporting hybrid work and flexible teaching setups. Adoption is expanding into corporate training centres, design studios and healthcare environments where large, interactive surfaces are required for planning, diagnostics or team collaboration. These trends reinforce steady demand across USA institutional and commercial sectors.
Demand for interactive projectors in the USA is increasing through 2035 as schools, universities, corporate offices, training facilities, and public institutions adopt interactive display systems to support collaborative learning, hybrid work, and digital content engagement. These projectors incorporate touch-responsive features, gesture-based controls, wireless connectivity, and content-sharing capabilities suited for classrooms, meeting rooms, and training centers. Growth is driven by investment in digital learning infrastructure, workplace collaboration tools, and wider availability of integrated audio-visual solutions. Regional demand varies according to education funding, enterprise IT spending, and adoption of hybrid-instruction environments. The West leads with a 12.3% CAGR, followed by the South (11.1%), the Northeast (9.9%), and the Midwest (8.6%).
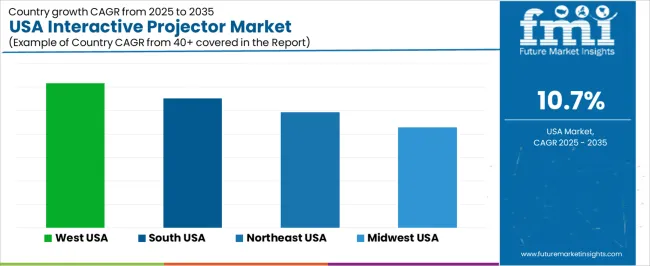
| Region | CAGR (2025 to 2035) |
|---|---|
| West | 12.3% |
| South | 11.1% |
| Northeast | 9.9% |
| Midwest | 8.6% |

The West grows at 12.3% CAGR, supported by extensive deployment in K-12 districts, universities, and corporate offices across California, Washington, and Oregon. Schools use interactive projectors to support digital curriculum delivery, classroom collaboration, and blended learning models. Universities integrate advanced projection systems into lecture halls and research studios, enabling real-time annotation and content sharing. Corporate campuses adopt these systems for meeting-room upgrades and team collaboration sessions. Training organizations use interactive projectors for simulation-based learning and skills development. Strong regional investment in educational technology and workplace digitalization ensures continuous adoption across institutions.
The South grows at 11.1% CAGR, supported by expanding digital-learning initiatives and widespread enterprise modernization across Texas, Florida, Georgia, and North Carolina. School districts adopt interactive projectors to replace older audiovisual equipment and support interactive teaching methods. Universities integrate these systems in general-education classrooms and STEM laboratories. Corporate offices deploy interactive projectors for hybrid-work collaboration, remote team engagement, and training programs. Healthcare training centers use projector-based simulation tools for clinical instruction. Stable investments in education infrastructure and corporate IT systems reinforce steady regional demand.

The Northeast grows at 9.9% CAGR, supported by strong uptake across universities, research institutions, financial firms, and public-sector organizations in New York, Massachusetts, and Pennsylvania. Higher-education institutions use interactive projectors for advanced instruction, annotation-driven teaching, and hybrid-classroom delivery. Corporate offices rely on interactive projection systems for collaborative document review, strategy sessions, and cross-location meetings. Public libraries and community centers adopt interactive platforms to support workshops and digital-learning events. K–12 districts continue upgrading legacy classroom equipment to support curriculum-aligned digital learning. Urban technology adoption and dense institutional demand provide steady growth.
The Midwest grows at 8.6% CAGR, supported by stable adoption across schools, universities, manufacturing-training centers, and regional corporate offices in Illinois, Michigan, Ohio, and Minnesota. K–12 schools use interactive projectors to enhance classroom engagement and digital lesson delivery. Universities integrate them into lecture halls, distance-learning studios, and professional-training spaces. Manufacturing and technical-training facilities use projector-based interactive tools for skill development and equipment-operation instruction. Corporate offices employ interactive projection for team collaboration and remote-meeting integration. While growth is slower than in coastal regions, widespread educational and workforce-training needs sustain ongoing adoption.

Demand for interactive projectors in the USA is shaped by a group of established display-technology suppliers supporting classrooms, corporate training spaces, and collaborative environments. Seiko Epson Corporation holds the leading position with an estimated 20.2% share, supported by controlled optical-engine performance, consistent brightness stability, and long-term adoption across USA education systems. Its position is reinforced by dependable pen- and touch-interaction capability and reliable service support.
BenQ Corporation and Panasonic Corporation follow as significant participants, offering interactive projectors designed for high-usage environments that require predictable colour accuracy and low-latency response. Their strengths include stable lamp-free light sources, durable optical assemblies, and integrations suited to hybrid teaching and meeting applications. Dell Technologies Inc. maintains a steady presence through interactive projection systems positioned for corporate collaboration rooms, emphasizing compatibility with productivity ecosystems and controlled connectivity performance.
NEC Display Solutions Ltd. contributes capability with units optimized for large classrooms and lecture spaces, supported by strong image uniformity and reliable edge-blending options. Optoma Technology Inc. provides additional depth through compact, laser-based interactive models used in smaller educational and commercial settings requiring flexible installation and consistent touch responsiveness.
Competition across this segment centers on brightness stability, interaction accuracy, low input latency, optical durability, and compatibility with wireless-presentation and collaboration platforms. Demand remains steady as schools and enterprises continue shifting toward interactive, presenter-driven visual systems that support remote participation, blended learning, and enhanced collaboration across USA educational and professional environments.
| Items | Values |
|---|---|
| Quantitative Units | USD billion |
| Technology | Digital Light Processing (DLP), Liquid Crystal Display (LCD), Liquid Crystal on Silicon (LCoS) |
| Resolution | 4K UHD, XGA (Extended Graphics Array), WXGA (Wide Extended Graphics Array), Full HD (1080p) |
| Projection Type | Short-Throw, Ultra-Short Throw, Standard Throw |
| Regions Covered | West, Midwest, South, Northeast |
| Key Companies Profiled | Seiko Epson Corporation, BenQ Corporation, Panasonic Corporation, Dell Technologies Inc., NEC Display Solutions Ltd., Optoma Technology Inc. |
| Additional Attributes | Dollar sales by technology, resolution, and projection type categories; regional adoption trends across West, Midwest, South, and Northeast; competitive landscape of interactive projector manufacturers; advancements in touch-enabled projection, classroom collaboration tools, laser light sources, and high-resolution large-area displays; integration with K–12 education, universities, corporate training rooms, and interactive commercial environments in the USA. |
The global demand for interactive projector in USA is estimated to be valued at USD 1.5 billion in 2025.
The market size for the demand for interactive projector in USA is projected to reach USD 4.0 billion by 2035.
The demand for interactive projector in USA is expected to grow at a 10.7% CAGR between 2025 and 2035.
The key product types in demand for interactive projector in USA are digital light processing (dlp), liquid crystal display(lcd) and liquid crystal on silicon(lcos).
In terms of resolution, 4k uhd segment to command 13.1% share in the demand for interactive projector in USA in 2025.


Our Research Products

The "Full Research Suite" delivers actionable market intel, deep dives on markets or technologies, so clients act faster, cut risk, and unlock growth.

The Leaderboard benchmarks and ranks top vendors, classifying them as Established Leaders, Leading Challengers, or Disruptors & Challengers.

Locates where complements amplify value and substitutes erode it, forecasting net impact by horizon

We deliver granular, decision-grade intel: market sizing, 5-year forecasts, pricing, adoption, usage, revenue, and operational KPIs—plus competitor tracking, regulation, and value chains—across 60 countries broadly.

Spot the shifts before they hit your P&L. We track inflection points, adoption curves, pricing moves, and ecosystem plays to show where demand is heading, why it is changing, and what to do next across high-growth markets and disruptive tech

Real-time reads of user behavior. We track shifting priorities, perceptions of today’s and next-gen services, and provider experience, then pace how fast tech moves from trial to adoption, blending buyer, consumer, and channel inputs with social signals (#WhySwitch, #UX).

Partner with our analyst team to build a custom report designed around your business priorities. From analysing market trends to assessing competitors or crafting bespoke datasets, we tailor insights to your needs.
Supplier Intelligence
Discovery & Profiling
Capacity & Footprint
Performance & Risk
Compliance & Governance
Commercial Readiness
Who Supplies Whom
Scorecards & Shortlists
Playbooks & Docs
Category Intelligence
Definition & Scope
Demand & Use Cases
Cost Drivers
Market Structure
Supply Chain Map
Trade & Policy
Operating Norms
Deliverables
Buyer Intelligence
Account Basics
Spend & Scope
Procurement Model
Vendor Requirements
Terms & Policies
Entry Strategy
Pain Points & Triggers
Outputs
Pricing Analysis
Benchmarks
Trends
Should-Cost
Indexation
Landed Cost
Commercial Terms
Deliverables
Brand Analysis
Positioning & Value Prop
Share & Presence
Customer Evidence
Go-to-Market
Digital & Reputation
Compliance & Trust
KPIs & Gaps
Outputs
Full Research Suite comprises of:
Market outlook & trends analysis
Interviews & case studies
Strategic recommendations
Vendor profiles & capabilities analysis
5-year forecasts
8 regions and 60+ country-level data splits
Market segment data splits
12 months of continuous data updates
DELIVERED AS:
PDF EXCEL ONLINE
Interactive Whiteboard Market Size and Share Forecast Outlook 2025 to 2035
Interactive Packaging Market Size and Share Forecast Outlook 2025 to 2035
Interactive Tables Market Size and Share Forecast Outlook 2025 to 2035
Interactive Wound Dressing Market Insights – Growth & Forecast 2024-2034
Interactive Projector Market Report - Trends & Forecast 2025 to 2035
Smart and Interactive Textiles Market Size and Share Forecast Outlook 2025 to 2035
Demand for Interactive Projector in Japan Size and Share Forecast Outlook 2025 to 2035
Portable Projector Market Size and Share Forecast Outlook 2025 to 2035
Multimedia Projectors Market Analysis – Growth & Industry Trends 2023-2033
USA Medical Coding Market Size and Share Forecast Outlook 2025 to 2035
USA Labels Market Size and Share Forecast Outlook 2025 to 2035
USA Plant-based Creamers Market Size and Share Forecast Outlook 2025 to 2035
USA Barrier Coated Paper Market Size and Share Forecast Outlook 2025 to 2035
USA Electronic Health Records (EHR) Market Size and Share Forecast Outlook 2025 to 2035
USA Animal Model Market Size and Share Forecast Outlook 2025 to 2035
USA and Canada Packer Bottle Market Size and Share Forecast Outlook 2025 to 2035
USA Stretch Hood Films Market Size and Share Forecast Outlook 2025 to 2035
USA and Canada Fence Screen Market Size and Share Forecast Outlook 2025 to 2035
USA Lubricant Contaminated HDPE Container Waste Market Size and Share Forecast Outlook 2025 to 2035
USA Commercial Walk-In Refrigeration Market Size and Share Forecast Outlook 2025 to 2035

Thank you!
You will receive an email from our Business Development Manager. Please be sure to check your SPAM/JUNK folder too.
Chat With
MaRIA