The demand for interactive projectors in Japan is expected to grow from USD 185.9 million in 2025 to approximately USD 419.5 million by 2035, reflecting a CAGR of 8.5%. The increasing adoption of interactive display technologies across education, business, and entertainment sectors will drive this growth. As digital transformation continues to impact various industries, Japan’s demand for innovative visual solutions, such as interactive projectors, will rise. The growing emphasis on collaborative learning environments, hybrid workspaces, and immersive entertainment experiences will propel the demand for these projectors. Furthermore, the adoption of smart technologies and interactive media will continue to drive the need for advanced visual display systems, positioning interactive projectors as a key solution in the Japanese industry.
The interactive projector industry in Japan will benefit from innovations in interactive display technology, including improved touch sensitivity, multi-screen support, and enhanced connectivity features. These advancements will make interactive projectors more versatile and user-friendly, driving demand in classrooms, boardrooms, and home entertainment spaces. As the industry evolves, interactive projectors will become an essential tool in creating dynamic, engaging environments for both educational and professional purposes. The increasing popularity of digital signage, which relies heavily on interactive display technology, will further fuel the growth of this sector.
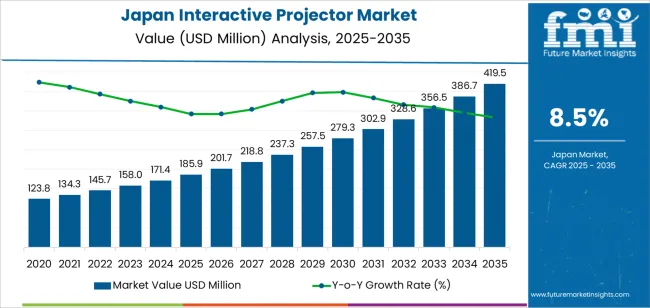
From 2025 to 2030, the industry will grow from USD 185.9 million to USD 257.5 million, adding USD 71.6 million in value. This phase is expected to account for a substantial portion of the industry's total growth, driven by the rising demand for interactive projectors in educational institutions, business presentations, and training environments. The adoption of digital learning tools and remote collaboration systems, combined with the growing need for interactive and engaging content delivery, will fuel this period of expansion. Increased investment in educational technology and the shift toward hybrid working environments will also contribute to growth.
From 2030 to 2035, the industry will grow from USD 257.5 million to USD 419.5 million, contributing an additional USD 162.0 million in value. This period will be marked by the widespread adoption of interactive projectors across various sectors, with strong demand in corporate offices, higher education institutions, and entertainment venues. The increased integration of augmented reality (AR) and virtual reality (VR) technologies into interactive projectors will further enhance their appeal. As the industry matures, growth may moderate slightly, but demand for interactive projectors will remain strong, driven by the need for innovative, collaborative, and immersive display solutions.
| Metric | Value |
|---|---|
| Demand for Interactive Projector in Japan Value (2025) | USD 185.9 million |
| Demand for Interactive Projector in Japan Forecast Value (2035) | USD 419.5 million |
| Demand for Interactive Projector in Japan Forecast CAGR (2025 to 2035) | 8.5% |
The demand for interactive projectors in Japan is climbing as educational institutions, businesses, and training centres move toward more engaging, technology‑driven environments. Classrooms and corporate meeting rooms are replacing traditional whiteboards and fixed screens with interactive projectors that allow touch, pen input, and flexible content delivery. These systems offer an improved user experience for collaboration, instruction, and training, which bolsters their adoption.
Enterprise and hybrid‑work setups are also contributing to growth. As companies in Japan shift to more dynamic working models combining remote and in‑office scenarios interactive projectors offer the adaptability needed for varied spaces. Features like ultra‑short‑throw projection, wireless connectivity, and plug‑and‑play collaboration make these systems appealing for modern meeting rooms and training hubs.
Manufacturers are innovating hardware and software designed for Japanese users and settings, enhancing features such as multi‑user annotation, cloud integration, and intuitive interfaces. These advancements reduce setup and maintenance complexity while expanding application beyond classrooms into entertainment, retail experiences, and public spaces. As technology becomes more capable and cost‑effective, the demand for interactive projectors in Japan is expected to progress steadily through 2035.
Demand for interactive projectors in Japan is segmented by technology, resolution, and projection type. By technology, demand is divided into liquid crystal display (LCD), digital light processing (DLP), and liquid crystal on silicon (LCoS), with LCD leading the demand. In terms of resolution, the industry is categorized into XGA (Extended Graphics Array), 4K UHD, WXGA (Wide Extended Graphics Array), and Full HD (1080p), with XGA holding the largest share. The industry is also segmented by projection type, including ultra-short throw, short-throw, and standard throw, with ultra-short throw projectors leading the demand. Regionally, demand is divided into Kanto, Kinki, Chubu, Kyushu & Okinawa, Tohoku, and the Rest of Japan.
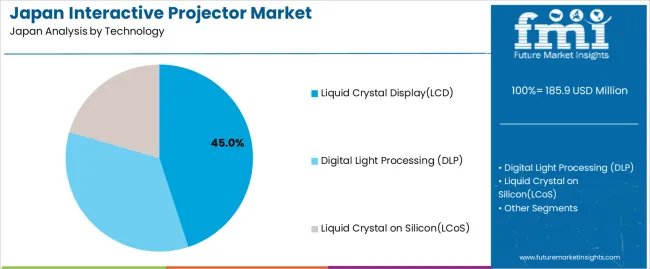
LCD technology accounts for 45% of the demand for interactive projectors in Japan. LCD projectors are popular for their ability to produce bright, clear images with excellent color accuracy and reliability. LCD projectors are widely used in classrooms, corporate settings, and entertainment applications where high-quality images are essential. The demand for LCD projectors is driven by their versatility, affordability, and ability to deliver clear and vibrant images in various lighting conditions.
The popularity of LCD technology is further fueled by its efficiency in creating high-quality, bright projections at lower energy consumption compared to other technologies like DLP and LCoS. The increasing use of interactive projectors for digital learning, presentations, and collaborative work in educational institutions and corporate environments also boosts the demand for LCD projectors. As interactive projectors continue to play a key role in education and business, LCD technology will maintain its leadership in the industry due to its proven performance and widespread acceptance.
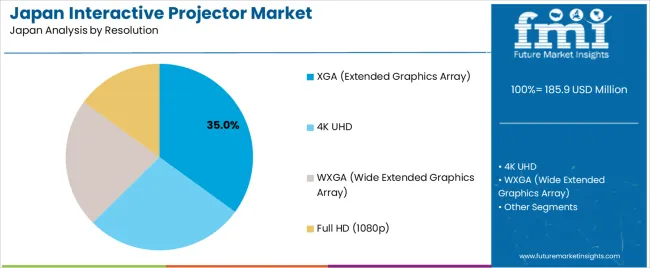
XGA (Extended Graphics Array) resolution accounts for 35.0% of the demand for interactive projectors in Japan. XGA resolution offers a good balance between image quality and cost, making it a popular choice for educational and business environments. With a resolution of 1024 x 768 pixels, XGA projectors are ideal for standard presentations, classroom lectures, and meetings where high-definition visuals are not always essential.
The demand for XGA resolution is driven by its affordability and sufficient image clarity for general projection needs. While 4K UHD and Full HD resolutions are gaining traction in more specialized applications, XGA remains a cost-effective solution for day-to-day use, particularly in environments where large-scale, ultra-high-definition projections are not necessary. The continued adoption of interactive projectors in education, government, and small businesses will keep XGA resolution as a dominant choice due to its balance of performance and value.
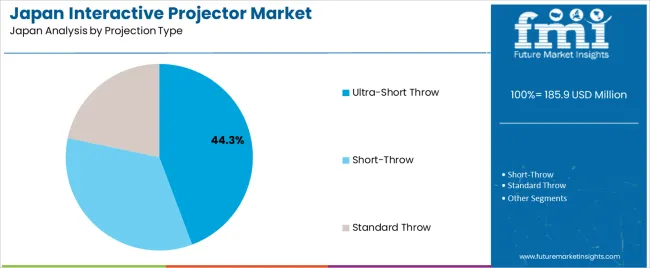
Ultra-short throw projectors account for 44.3% of the demand for interactive projectors in Japan. Ultra-short throw projectors are designed to be placed very close to the projection surface, allowing for large images to be projected in small spaces. This technology is particularly popular in classrooms, conference rooms, and small business environments where space is limited but a large display is still required.
The growing demand for ultra-short throw projectors is driven by the need for space-efficient solutions without compromising on image size or quality. These projectors can be placed just a few inches away from the wall or screen, minimizing shadows and providing an interactive experience in tight environments. The ability to create large, clear projections in small rooms makes ultra-short throw projectors ideal for environments like classrooms, meeting rooms, and collaborative spaces. As the trend for space-saving technology continues to grow, the demand for ultra-short throw projectors is expected to increase in Japan.
Key drivers include Japan’s push for digital‑classroom adoption and remote/hybrid work environments, growing interest in ultra‐short‐throw (UST) projectors for space‑constrained settings, and the need for multi‑touch and interactive surfaces in meeting rooms and training centres. Further, technological enhancements like higher resolution, laser light sources and improved interactivity make these systems more compelling. On the restraint side, the premium cost of interactive projector units compared with standard projectors or interactive flat panels may limit adoption in smaller schools or businesses.
In Japan, demand is growing because organisations want more engaging, collaborative and flexible presentation tools rather than static displays. With schools embracing digital teaching methods, classrooms require projectors that allow teachers and students to interact directly with the content. Companies are upgrading meeting rooms to support hybrid work with video‑conferencing, real‑time annotations and sharing which makes interactive projectors attractive. Ultra‑short‑throw models, which can sit close to the wall and minimize shadows, are particularly suitable for Japanese rooms that tend to be compact. Integrated laser‑light sources and longer lifetimes also reduce maintenance burden, making the shift to interactive projection more economically justifiable. As digital transformation continues across sectors, interactive projection becomes both a functional and strategic investment in Japan.
Technological innovations are expanding the appeal of interactive projectors in Japan by making them more user‑friendly, compact and robust. Advances include ultra‑short‑throw optics (allowing large images from short distances), laser light engines with longer life and lower maintenance, higher resolution (4K, HDR) for clarity, and built‑in interactive tools (multi‑touch, stylus input, annotation modes). Integrated connectivity (wireless screen‑sharing, secure network access), and simplified installation (ceiling mount kits, auto‑keystone correction) reduce barriers to adoption in schools and offices. In addition, improvements in projection onto non‑traditional surfaces (walls, glass, desks) expand use‑cases beyond conventional setups. These innovations reduce total cost of ownership and broaden use scenarios in compact Japanese spaces, driving higher uptake.
Despite favorable demand conditions, several challenges limit broader adoption of interactive projectors in Japan. A major barrier is cost: premium interactive and UST models are significantly more expensive than standard projectors, which may dissuade smaller institutions or businesses with tight budgets. Integration complexity is another challenge: proper installation, calibration, word‑locking systems and maintenance may require specialist skills. Also, the rapid evolution of large‑format LED displays and interactive flat panels means some potential buyers may skip projection altogether and adopt those alternatives instead. In very compact Japanese rooms, even ultra‑short‑throw projectors may struggle with ambient light or require careful placement, which may hinder full performance and deter some purchasers.
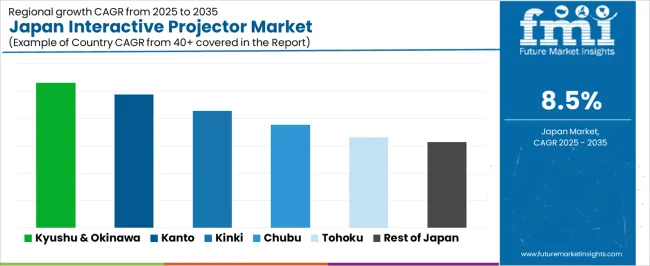
| Region | CAGR (%) |
|---|---|
| Kyushu & Okinawa | 10.6% |
| Kanto | 9.7% |
| Kinki | 8.6% |
| Chubu | 7.5% |
| Tohoku | 6.6% |
| Rest of Japan | 6.3% |
The demand for interactive projectors in Japan is growing across all regions, with Kyushu & Okinawa leading at a 10.6% CAGR. This growth is driven by increasing use in education, corporate settings, and entertainment. Kanto follows with a 9.7% CAGR, spurred by its dense urban centers and a growing focus on digital learning tools. Kinki shows an 8.6% CAGR, supported by the region’s strong demand for innovative educational and business solutions. Chubu experiences a 7.5% CAGR, driven by technology adoption in manufacturing and other sectors. Tohoku and the Rest of Japan show moderate growth at 6.6% and 6.3%, respectively, as regional awareness of interactive projectors increases.
Kyushu & Okinawa is seeing the highest demand for interactive projectors in Japan, with a 10.6% CAGR. The region is embracing technology-driven solutions, particularly in education and corporate sectors, where interactive projectors are becoming increasingly popular for enhancing presentations, lectures, and meetings. Cities like Fukuoka are at the forefront of adopting these technologies, with educational institutions and businesses seeking tools that improve collaboration and engagement.
The growing emphasis on digital learning tools and the use of projectors in smart classrooms is fueling this demand. Okinawa’s tourism industry is also adopting interactive projectors for entertainment purposes. As businesses and educational institutions continue to modernize their approach to content delivery, the demand for interactive projectors in Kyushu & Okinawa is expected to remain strong, leading the country’s adoption of this technology.
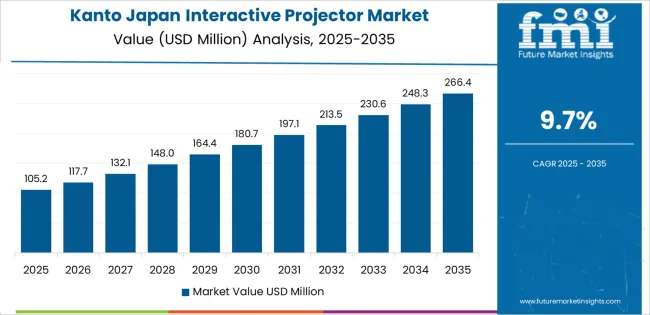
Kanto is experiencing robust demand for interactive projectors, with a 9.7% CAGR. As Japan’s largest economic region, Kanto, particularly Tokyo, is a hub for technological innovation and education. The region’s dense population, combined with its focus on digital education, is contributing to the increasing demand for interactive projectors in schools, universities, and corporate environments.
Interactive projectors are increasingly used in smart classrooms and meetings, where they enhance interactivity, collaboration, and content delivery. As the region embraces digital transformation, educational institutions and businesses are increasingly adopting these projectors to improve presentations and teaching methods. Kanto’s thriving tech industry is further driving demand, as interactive projectors are being integrated into various business sectors to improve productivity and communication. As the region continues to push the boundaries of innovation, Kanto is expected to maintain strong growth in the demand for interactive projectors.
Kinki is seeing steady demand for interactive projectors, with an 8.6% CAGR. The region’s strong industrial base, coupled with a focus on innovation in both the education and business sectors, is driving the adoption of interactive projectors. Major cities like Osaka and Kyoto are embracing these technologies to improve teaching, presentations, and collaborative work environments.
The Kinki region’s educational institutions and corporate offices are increasingly incorporating interactive projectors into their classrooms and meeting spaces to facilitate dynamic learning and collaboration. As companies seek to modernize their operations and engage employees more effectively, the use of interactive projectors is becoming more widespread. The demand for interactive projectors in public spaces and entertainment venues is also contributing to growth. As digital solutions continue to evolve in the region, the need for advanced projection technologies is expected to grow steadily.
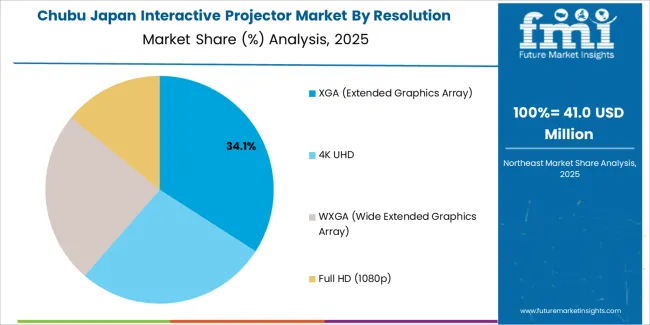
Chubu is experiencing moderate growth in demand for interactive projectors, with a 7.5% CAGR. The region, known for its strong manufacturing base, is seeing increased adoption of interactive projectors in corporate settings, particularly for presentations and collaborative work. Cities like Nagoya are home to a diverse range of industries, and businesses in the region are increasingly incorporating digital solutions like interactive projectors to boost efficiency and communication.
Chubu’s educational sector is also adopting these technologies, with schools and universities using interactive projectors to enhance teaching methods. As digital transformation continues to influence the region’s industries, the demand for interactive projectors will continue to grow. While growth is slightly slower compared to other regions like Kyushu & Okinawa, Chubu’s focus on innovation and industrial modernization ensures that the adoption of interactive projectors will steadily increase.
Tohoku is experiencing moderate growth in demand for interactive projectors, with a 6.6% CAGR. The region, which has traditionally had a smaller technology adoption rate compared to other areas, is now seeing a rise in the use of interactive projectors in education and business. Tohoku’s schools and universities are increasingly incorporating interactive technologies to engage students and enhance learning experiences.
In addition, businesses in Tohoku are adopting digital tools like interactive projectors to improve presentations and team collaborations. As the region’s economy diversifies and moves towards more advanced technological solutions, the demand for interactive projectors is expected to grow steadily. The focus on improving educational infrastructure and business productivity will continue to drive adoption of these innovative technologies in Tohoku.
The Rest of Japan is experiencing moderate growth in demand for interactive projectors, with a 6.3% CAGR. This includes rural and smaller urban areas where the adoption of technology is increasing, particularly in educational and corporate sectors. As awareness of digital learning tools grows, more schools and businesses in these regions are turning to interactive projectors to enhance content delivery and engagement.
While the adoption rate is slower compared to major metropolitan regions like Kanto and Kyushu & Okinawa, the Rest of Japan is gradually embracing these technologies. The demand is being driven by both public and private sector investments in education and business solutions. As digital transformation efforts continue in rural areas, the adoption of interactive projectors will likely increase, contributing to steady growth across the region.
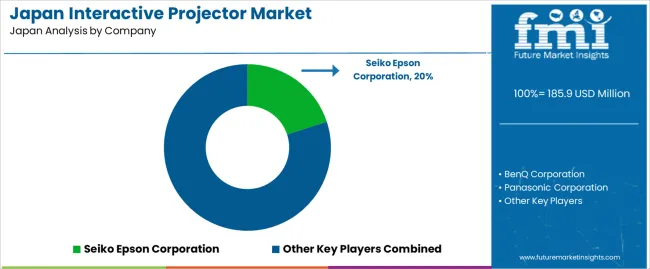
Demand for interactive projectors in Japan is growing as they are increasingly used in educational institutions and corporate training & collaboration environments. These devices combine projection with interactive functionality (such as touch or pen input), enabling more engaging teaching, dynamic presentations, and hybrid‑meeting setups. As digital transformation, hybrid work models, and smart classrooms rise, these interactive projection solutions provide enhanced interactivity and real‑time collaboration, driving adoption. However, challenges such as competition from large interactive flat‑panel displays, high initial device cost, and the complexity of installation or calibration remain.
In the Japanese landscape, Seiko Epson Corporation is estimated to command a share of approximately 20.0%, underscoring its leadership position in the interactive projector category. Other key providers include BenQ Corporation, Panasonic Corporation, Dell Technologies Inc., NEC Display Solutions Ltd., and Optoma Technology Inc. each offering a mix of ultra‑short‑throw projectors, interactive software tools, and integrated solutions tailored for Japanese classrooms and corporate spaces.
Key drivers of demand in Japan include: wide rollout of smart‐classroom initiatives, growing interest in hybrid working and real‑time collaboration, technology upgrades in commercial spaces (meeting rooms, training centres), and the strong electronics/IT ecosystem fostering advanced interactive solutions. Challenges persist, such as retrofit complexity in older classrooms/offices, cost sensitivity (especially for smaller institutions), and the rising availability of large interactive flat‑panel displays which compete for the same use‑cases. Nevertheless, as Japan continues upgrading its educational and corporate display infrastructure, demand for interactive projectors is well‑positioned to grow further.
| Items | Values |
|---|---|
| Quantitative Unit | USD million |
| Technology | Liquid Crystal Display (LCD), Digital Light Processing (DLP), Liquid Crystal on Silicon (LCoS) |
| Resolution | XGA (Extended Graphics Array), 4K UHD, WXGA (Wide Extended Graphics Array), Full HD (1080p) |
| Projection Type | Ultra-Short Throw, Short-Throw, Standard Throw |
| Regions Covered | Kyushu & Okinawa, Kanto, Kinki, Chubu, Tohoku, Rest of Japan |
| Key Players Profiled | Seiko Epson Corporation, BenQ Corporation, Panasonic Corporation, Dell Technologies Inc., NEC Display Solutions Ltd., Optoma Technology Inc. |
| Additional Attributes | Dollar sales by technology type, resolution, projection type, and regional trends focusing on education, business, and entertainment sectors. |
The demand for interactive projector in Japan is estimated to be valued at USD 185.9 million in 2025.
The market size for the interactive projector in Japan is projected to reach USD 419.5 million by 2035.
The demand for interactive projector in Japan is expected to grow at a 8.5% CAGR between 2025 and 2035.
The key product types in interactive projector in Japan are liquid crystal display(lcd), digital light processing (dlp) and liquid crystal on silicon(lcos).
In terms of resolution, xga (extended graphics array) segment is expected to command 35.0% share in the interactive projector in Japan in 2025.


Our Research Products

The "Full Research Suite" delivers actionable market intel, deep dives on markets or technologies, so clients act faster, cut risk, and unlock growth.

The Leaderboard benchmarks and ranks top vendors, classifying them as Established Leaders, Leading Challengers, or Disruptors & Challengers.

Locates where complements amplify value and substitutes erode it, forecasting net impact by horizon

We deliver granular, decision-grade intel: market sizing, 5-year forecasts, pricing, adoption, usage, revenue, and operational KPIs—plus competitor tracking, regulation, and value chains—across 60 countries broadly.

Spot the shifts before they hit your P&L. We track inflection points, adoption curves, pricing moves, and ecosystem plays to show where demand is heading, why it is changing, and what to do next across high-growth markets and disruptive tech

Real-time reads of user behavior. We track shifting priorities, perceptions of today’s and next-gen services, and provider experience, then pace how fast tech moves from trial to adoption, blending buyer, consumer, and channel inputs with social signals (#WhySwitch, #UX).

Partner with our analyst team to build a custom report designed around your business priorities. From analysing market trends to assessing competitors or crafting bespoke datasets, we tailor insights to your needs.
Supplier Intelligence
Discovery & Profiling
Capacity & Footprint
Performance & Risk
Compliance & Governance
Commercial Readiness
Who Supplies Whom
Scorecards & Shortlists
Playbooks & Docs
Category Intelligence
Definition & Scope
Demand & Use Cases
Cost Drivers
Market Structure
Supply Chain Map
Trade & Policy
Operating Norms
Deliverables
Buyer Intelligence
Account Basics
Spend & Scope
Procurement Model
Vendor Requirements
Terms & Policies
Entry Strategy
Pain Points & Triggers
Outputs
Pricing Analysis
Benchmarks
Trends
Should-Cost
Indexation
Landed Cost
Commercial Terms
Deliverables
Brand Analysis
Positioning & Value Prop
Share & Presence
Customer Evidence
Go-to-Market
Digital & Reputation
Compliance & Trust
KPIs & Gaps
Outputs
Full Research Suite comprises of:
Market outlook & trends analysis
Interviews & case studies
Strategic recommendations
Vendor profiles & capabilities analysis
5-year forecasts
8 regions and 60+ country-level data splits
Market segment data splits
12 months of continuous data updates
DELIVERED AS:
PDF EXCEL ONLINE
Demand Signal Repository Solutions Market Size and Share Forecast Outlook 2025 to 2035
Demand Side Management Market Size and Share Forecast Outlook 2025 to 2035
Demand Response Market Analysis - Size, Share, and Forecast Outlook 2025 to 2035
North America Shipping Supplies Market Trends – Innovations & Growth 2024-2034
Demand of Kozani Saffron in Greece Analysis - Size, Share & Forecast 2025 to 2035
Demand of No-acid Whey Strained Dairy Processing Concepts in European Union Size and Share Forecast Outlook 2025 to 2035
Demand for Bronte Pistachio in Italy Analysis - Size, Share & Forecast 2025 to 2035
Demand and Trend Analysis of Gaming Monitor in Western Europe Size and Share Forecast Outlook 2025 to 2035
Demand and Trend Analysis of Gaming Monitor in Korea Size and Share Forecast Outlook 2025 to 2035
Demand and Trend Analysis of Gaming Monitor in Japan Size and Share Forecast Outlook 2025 to 2035
Glycine Soja (Soybean) Seed Extract Market Size and Share Forecast Outlook 2025 to 2035
Demand and Trend Analysis of Yeast in Japan - Size, Share, and Forecast Outlook 2025 to 2035
Demand of Pistachio-based desserts & ingredients in France Analysis - Size, Share & Forecast 2025 to 2035
Western Europe Men’s Skincare Market Analysis – Forecast 2023-2033
Demand and Trends Analysis of Stevia in Japan Size and Share Forecast Outlook 2025 to 2035
Japan Women’s Intimate Care Market Trends – Growth & Forecast 2024-2034
Demand and Trend Analysis of Fabric Stain Remover in Korea Size and Share Forecast Outlook 2025 to 2035
Demand and Sales Analysis of Paper Cup in Korea Size and Share Forecast Outlook 2025 to 2035
Demand and Sales Analysis of Paper Cup in Western Europe Size and Share Forecast Outlook 2025 to 2035
Demand of MFGM-enriched Powders & RTDs in European Union Size and Share Forecast Outlook 2025 to 2035

Thank you!
You will receive an email from our Business Development Manager. Please be sure to check your SPAM/JUNK folder too.
Chat With
MaRIA