Vaginitis Treatment Drugs Market
Market Insights on Vaginitis Treatment Drugs covering sales outlook, demand forecast & up-to-date key trends
Vaginitis Treatment Drugs Market By Drug Type, Indication, Route of Administration, Schedule of Drug, Distribution Channel & Region - Forecast 2022-2030
Vaginitis Treatment Drugs Market Outlook (2022-2030)
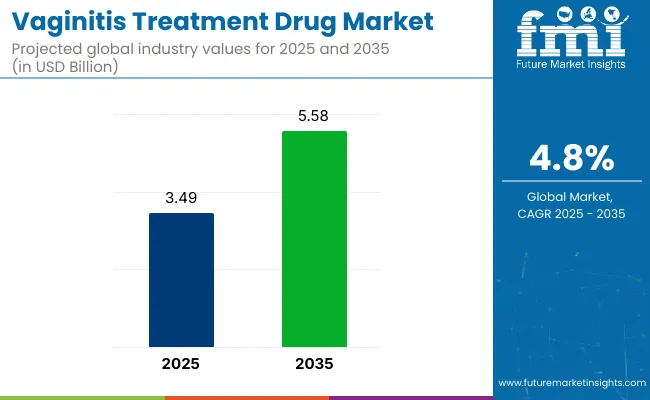
[250 Pages Report] The global vaginitis treatment drugs market is likely to be valued at around US$ 3.01 Bn in 2022. Market growth is expected to progress at 5.2% CAGR to reach US$ 4.52 Bn by the end of 2030.
Vaginitis Treatment Drugs Market Size (2022) |
US$ 3.01 Bn |
Revenue Forecast (2030) |
US$ 4.52 Bn |
Global Market Growth Rate (2022-2030) |
5.2% CAGR |
Market Share of Nitroimidazole Compounds |
43.4% |
Vaginitis treatment drug consumption currently accounts for 7% share in the global antibiotics market. Some of the important reasons driving demand for vaginitis treatment drugs are increased knowledge about women's health, development of new pharmaceuticals by significant businesses, and rising desire for improved healthcare facilities.
Let us know your requirement to get
100% FREE customization
Vaginitis Treatment Drug Demand Analysis (2015 to 2021) Vs Market Outlook (2022 to 2030)
Vaginitis is a vaginal irritation that causes discharge, itching, and pain. A change in the balance of vaginal flora or an infection is the most common cause. Vaginitis can be caused by low oestrogen levels after menopause, as well as some skin conditions.
Vaginitis can be caused by a variety of bacterial infections and circumstances, so treatment is based on the exact cause. Bacterial vaginitis, fungal vaginitis (yeast infection), and trichomoniasis are the most frequent kinds of vaginitis. Vaginitis can be treated with a variety of medications.
"Almost every nitroimidazole medicine given orally in a single dosage or over a long period leads to parasitological cure in 90% of instances. A single 2-g dose of metronidazole is sufficient, but it can cause dyspepsia and a metallic taste; compliant patients may choose a lengthier regimen with a lower daily dose and fewer side effects. Bacterial vaginosis and trichomoniasis can be treated with metronidazole at a dose of 500 mg twice weekly. Metronidazole-resistant strains should be treated with 2 to 4 g of metronidazole daily for a week or two," according to aafp.org.
The vaginitis treatment drugs market expanded at a CAGR of 4.2% from 2015 to 2021. The market is expected to grow due to an increase in R&D initiatives for precise diagnosis. Various government and non-government bodies, including the World Health Organization and the European Institute of Women's Health (EIWH), have launched public awareness campaigns about women's health.
The market is being driven by numerous firms' continuous R&D operations, as well as changing lifestyle patterns of women around the world, such as cigarette and alcohol intake.
Demand for vaginitis treatment drugs is expected to expand at a CAGR of 5.2% from 2022 to 2030, with the global market predicted to reach a valuation of US$ 4.52 Bn by 2030.
Which Market Factors are Stimulating Demand for Vaginitis Treatment Drugs?
“Increased Incidence of Infectious Vaginosis and Rising R&D Activities & Public Awareness about Women's Health”
According to University of Cape Town researchers, a vaginal health probiotic including vaginal lactobacillus strains may be a better therapy choice for vaginitis.
This probiotic may also reduce the incidence of STDs and bad pregnancy outcomes, according to the researchers. On these grounds, more expenditure on research in the vaginitis treatment drugs market is expected throughout the forecast period.
Furthermore, expanding healthcare infrastructure in developing economies, availability of pharmaceutical drugs, and robust technological advancements in the biopharmaceutical industries are all contributing to significant opportunities for vaginitis treatment drugs over the forecasted period.
Find your sweet spots for generating winning opportunities in this market.
Talk to AnalystWhat Can Negatively Influence Sales of Vaginitis Treatment Drugs?
“Asymptomatic Nature of Bacterial Vaginitis & Unawareness of Vaginitis Diagnostic Tests Stunting Demand for Vaginitis Treatment Drugs”
At least half of the female population can suffer from bacterial vaginosis (BV) with no symptoms. Even when asymptomatic, bacterial vaginosis is linked to a high prevalence of pelvic inflammatory illness and endometritis.
The asymptomatic form of vaginosis inhibits the populace from detecting the infection and taking early steps to prevent infection transmission. Antibiotic and antifungal medicine demand is predicted to be hampered by the increasing incidence of asymptomatic vaginitis.
Which Regional Markets are Lucrative for Manufacturers of Vaginitis Treatment Drugs?
“Developed Healthcare Facilities, High Incidence of Diseases, and Presence of Key Producers in North America Market”
The most profitable market for vaginitis treatment medications is North America. This region's established healthcare infrastructures, as well as the high frequency of disease and the presence of important manufacturers, are major factors contributing towards vaginitis treatment drugs market share.
As manufacturers develop novel vaginal tablets, Europe's vaginitis treatment drugs industry, which accounts for more than one-fourth of worldwide vaginitis treatment revenues, is poised to see lucrative development prospects in the future.
- For example, Gedea created pHyph, a pill that helps restore vaginal acidity in the first instance.
Brazil and South Africa, in addition to these two lucrative markets, provide considerable prospects for vaginitis treatment drug manufacturers.
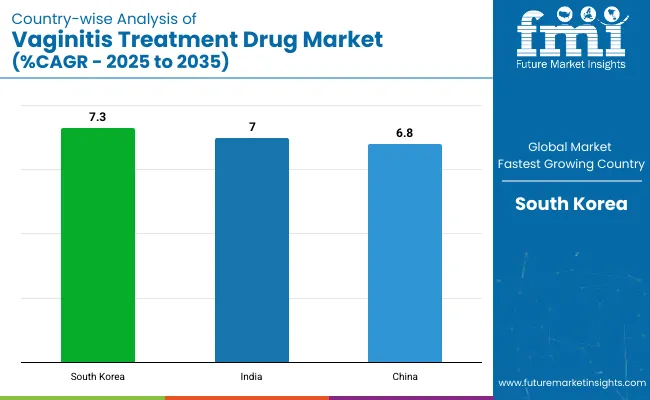
During the projection period, the Asia Pacific vaginitis treatment medication market is predicted to develop at the fastest rate. This is due to a significant number of unmet clinical requirements, improved knowledge of early diagnosis, and the availability of effective medications.

An unified Market Research Subscription Platform, built for today’s disparate research needs.
Country-wise Analysis
How is the Market for Vaginitis Treatment Drugs Faring in the U.S.?
“Rising Number of Vaginitis Cases Driving Demand for OTC Drugs”
The overgrowth of microorganisms (lactobacillus) in the vaginal area upsets the natural balance. Around 33% of women in the United States are impacted by this excess growth, which leads to "Vaginitis."
If left untreated, vaginitis can lead to miscarriages, pre-term babies, and, most importantly, a 2X to 4X higher chance of contracting HIV. Other STDs linked to vaginitis include chlamydia, gonorrhoea, and papillomavirus. Also, infertility can occur at any time.
The aforementioned facts highlight the need for vaginitis treatment. The OTC drugs are also included in the vaginitis treatment drugs market. The novel approach for treating vaginitis is "vaginal bacteria transplants." As a result, the vaginitis treatment pharmaceuticals market is likely to experience a surge in innovation over the coming years.
Which Factors are Supporting Growth of the Vaginitis Treatment Medicines Market in India?
“Rising Awareness of Vaginitis & Availability of Advanced Treatment Aiding Sales of Vaginitis Treatment Drugs”
Vaginitis is a fast-spreading problem among women all over the world, and it is a growing concern in India too.
Bacterial vaginosis is the major cause of vaginitis in women of reproductive age, according to a study published on pathology.medresearch.in, "In the gynaecological outpatient environment, it is the most prevalent condition. In India, the incidence of bacterial vaginosis in adults ranges from 17.8 percent to 63.7 percent.
The report concludes that "Bacterial vaginosis was found to be prevalent in 44.6 percent of the population. For the diagnosis of bacterial vaginosis, Amsel's criteria were equivalent to Nugent's criteria, and are simple, quick, cost-effective, and trustworthy, and it may be used for precise and quick treatment too".
As a result of greater awareness regarding early detection of vaginitis and skin cancer, as well as the availability of efficient medications, vaginitis treatment drug sales in India are on the rise.
Category-wise Analysis
Which Distribution Channel Will Be Profitable for Vaginitis Treatment Drug Suppliers?
“Online Pharma Portals Driving Drug Sales of Mail Order Pharmacies”
Hospital pharmacies, drug stores, and mail order pharmacies all contribute to the overall sales of vaginitis treatment drugs, which are dominated by retail pharmacies. The Covid-19 pandemic has resulted in a spike in drug sales by mail order pharmacies, which is projected to continue at a rapid pace in the coming years.
More patients are getting their prescription drugs through the mail and various internet outlets. The online pharmacy sector of India witness more than 50 plus startups.
Which Drugs Provide the Most Effective Results for Vaginitis Treatment?
“Nitroimidazole Compounds Widely Used Due to Effective Results”
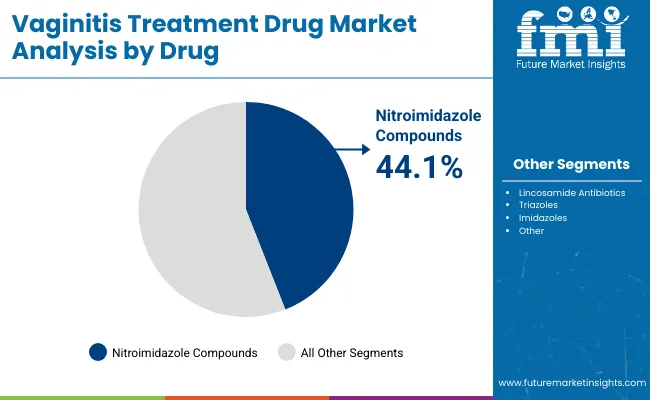
Nitroimidazole compounds account for more than half of the global market share for vaginitis treatment drugs. At present, nitroimidazole compounds are expected to account for 43.4% of the global market share. This could be due to their widespread use and availability, as well as the fact that they are the most widely approved form of vaginitis treatment.
Tinidazole and metronidazole are the most commonly recommended antibiotic compounds for vaginitis treatment. Furthermore, manufacturers have been concentrating on the introduction of novel pharmaceuticals as well as collaborations in this area. In 2022, triazoles and imidazoles are likely to hold 14% and 25.1% of the global market share respectively.
Lincosamide is an antibiotic that is used to treat infections caused by bacteria like pelvic inflammatory disease, stomach infections, abscesses, pimples, and anaerobic infectious diseases. They're typically used to treat serious infections in penicillin-allergic people. Lincosamide antibiotics are bacteriostatic drugs that limit bacterial multiplication by interacting with protein synthesis.
At high antibiotic doses, they may also have a bactericidal (killing) effect against pathogens. Currently, lincosamide antibiotics are predicted to account for 17.5% of the global market share.
Competitive Landscape
The vaginitis treatment drugs market is still largely consolidated. At the worldwide level, there is an influx of unique pharmaceuticals on the market. Competition is intense, with an additional 25+ vaginitis therapy drug players, medication development, clinical trials, and e-commerce.
Because vaginitis has a high recurrence rate, makers of vaginitis treatment drugs are concentrating on the development of non-antibiotic medications for long-term treatment.
Single-dose medications and over-the-counter drugs are being introduced by key companies, allowing for cost-effective treatment. Furthermore, manufacturers are concentrating on forming drug research alliances to expand the pool of more effective pharmaceutical prospects.
- Lupin Pharmaceuticals announced a partnership with PlushCare to make bacterial vaginosis (BV) treatment easier via the PlushCare virtual platform.
- TCM (Traditional Chinese Medicine) is being administered for treating vaginitis for the last several years. Research is being conducted for the development of more efficient antibiotics as resistance to TCM is springing up.
- Patients can use PlushCare to schedule a virtual visit with a doctor, discuss their symptoms, and receive a prescription for lab testing.
- In Poland, Bayer's Canesten moved from being an Rx to an OTC therapy for vaginal yeast infection. Clotrimazole, miconazole, and tioconazole are among the other medications that have gone over-the-counter.
- Pfizer Inc. and Basilea Pharmaceutica Ltd. agreed to collaborate on the development and marketing of cresemba® (isavuconazole) in China and the Asia Pacific region.
Vaginitis Treatment Drugs Industry Report Scope
Attribute |
Details |
Forecast Period |
2022-2030 |
Historical Data Available for |
2015-2021 |
Market Analysis |
US$ Bn for Value |
Key Regions Covered |
|
Key Countries Covered |
|
Key Market Segments Covered |
|
Key Companies Profiled |
|
Pricing |
Available upon Request |
Key Segments of Vaginitis Treatment Drugs Industry Survey
Vaginitis Treatment Drugs Market by Drug:
- Nitroimidazole Compounds
- Lincosamide Antibiotics
- Triazoles
- Imidazoles
Vaginitis Treatment Drugs Market by Indication:
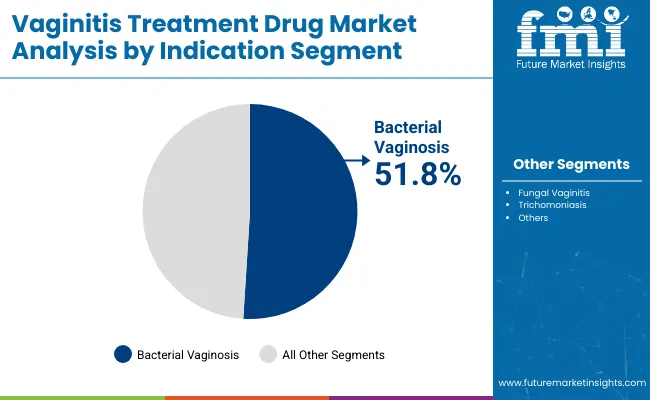
- Bacterial Vaginitis
- Fungal Vaginitis (Yeast Infection)
- Trichomoniasis
Vaginitis Treatment Drugs Market by Route of Administration:
- Oral Vaginitis Treatment Drugs
- Cutaneous Vaginitis Treatment Drugs
- Vaginal Vaginitis Treatment Drugs
Vaginitis Treatment Drugs Market by Schedule of Drug:
- Prescription Vaginitis Treatment Drugs (Rx)
- Over-the-counter Vaginitis Treatment Drugs (OTC)
Vaginitis Treatment Drugs Market by Distribution Channel:
- Hospital Pharmacies
- Retail Pharmacies
- Drug Stores
- Mail Order Pharmacies
Vaginitis Treatment Drugs Market by Region:
- North America Vaginitis Treatment Drugs Market
- Latin America Vaginitis Treatment Drugs Market
- Europe Vaginitis Treatment Drugs Market
- East Asia Vaginitis Treatment Drugs Market
- South Asia & Pacific Vaginitis Treatment Drugs Market
- Middle East & Africa (MEA) Vaginitis Treatment Drugs Market
Frequently Asked Questions
The global vaginitis treatment drugs market is expected to enjoy a valuation of US$ 3.01 Bn in 2022 and is anticipated to progress at a healthy CAGR of 5.2% to reach a valuation of US$ 4.52 Bn by 2030.
The global market for vaginitis treatment drugs progressed at a CAGR of 4.2% from 2015 to 2021.
Key manufacturers of vaginitis treatment drugs are Pfizer Inc., Mylan NV, Novartis AS, and Bayer AG.
Nitroimidazole compounds are likely to hold 43.4% of the global market share in 2022.
Increased knowledge of women's health, introduction of new medications by major pharmaceutical companies, and rising need for advanced healthcare facilities are all boosting market expansion.
1. Executive Summary
1.1. Global Market Outlook
1.2. Demand Side Trends
1.3. Supply Side Trends
1.4. Analysis and Recommendations
2. Market Overview
2.1. Market Coverage / Taxonomy
2.2. Market Definition / Scope / Limitations
3. Key Market Trends
3.1. Key Trends Impacting the Market
3.2. Innovation / Development Trends
4. Market Context
4.1. Regulatory Scenario
4.2. Pipeline Analysis
4.3. Reimbursement Scenario by Region
4.4. Disease Epidemiology by Region
5. Market Background
5.1. Macro-Economic Factors
5.2. Forecast Factors - Relevance & Impact
5.3. Market Dynamics
5.3.1. Drivers
5.3.2. Restraints
5.3.3. Opportunity Analysis
5.4. Value Chain Analysis
5.5. COVID19 Crisis Analysis
5.5.1. Current COVID19 Statistics and Probable Future Impact
5.5.2. Current GDP Projection and Probable Impact
5.5.3. Current Economic Projection as compared to 2008 Economic analysis
5.5.4. COVID19 and Impact Analysis
5.5.4.1. Revenue By Product
5.5.4.2. Revenue By Country
5.5.5. 2022 Market Scenario
5.5.6. Quarter by Quarter Forecast
5.5.7. Projected recovery Quarter
5.5.8. Recovery Scenario – Short term, Midterm and Long Term Impact
6. Global Vaginitis Treatment Drugs Market Demand (in Value or Size in US$ Mn) Analysis 2015-2021 and Forecast, 2022–2030
6.1. Historical Market Value (US$ Mn) Analysis, 2015-2021
6.2. Current and Future Market Value (US$ Mn) Projections, 2022–2030
6.2.1. Y-o-Y Growth Trend Analysis
6.2.2. Absolute $ Opportunity Analysis
7. Global Vaginitis Treatment Drugs Market Analysis 2015-2021 and Forecast 2022–2030, by Drug Type
7.1. Introduction / Key Findings
7.2. Historical Market Size (US$ Mn) Analysis By Drug Type, 2015-2021
7.3. Current and Future Market Size (US$ Mn) Analysis and Forecast By Drug Type, 2022–2030
7.3.1. Nitroimidazole Compound
7.3.2. Lincosamide Antibiotics
7.3.3. Triazoles
7.3.4. Imidazoles
8. Global Vaginitis Treatment Drugs Market Analysis 2015-2021 and Forecast 2022–2030, by Indication
8.1. Introduction / Key Findings
8.2. Historical Market Size (US$ Mn) Analysis By Indication, 2015-2021
8.3. Current and Future Market Size (US$ Mn) Analysis and Forecast Indication, 2022 – 2030
8.3.1. Bacterial Vaginitis
8.3.2. Fungal Vaginitis (Yeast infection)
8.3.3. Trichomoniasis
9. Global Vaginitis Treatment Drugs Market Analysis 2015-2021 and Forecast 2022–2030, by Route of Administration
9.1. Introduction / Key Findings
9.2. Historical Market Size (US$ Mn) Analysis By Route of Administration, 2015-2021
9.3. Current and Future Market Size (US$ Mn) Analysis and Forecast Route of Administration, 2022 – 2030
9.3.1. Oral
9.3.2. Cutaneous
9.3.3. Vaginal
10. Global Vaginitis Treatment Drugs Market Analysis 2015-2021 and Forecast 2022–2030, by Schedule of Drug
10.1. Introduction / Key Findings
10.2. Historical Market Size (US$ Mn) Analysis By Schedule of Drug, 2015-2021
10.3. Current and Future Market Size (US$ Mn) Analysis and Forecast By Schedule of Drug, 2022 – 2030
10.3.1. Prescription Drugs (Rx)
10.3.2. Over the counter Drugs (OTC)
11. Global Vaginitis Treatment Drugs Market Analysis 2015-2021 and Forecast 2022–2030, by Distribution Channel
11.1. Introduction / Key Findings
11.2. Historical Market Size (US$ Mn) Analysis By Distribution Channel, 2015-2021
11.3. Current and Future Market Size (US$ Mn) Analysis and Forecast By Distribution Channel, 2022 – 2030
11.3.1. Hospital Pharmacies
11.3.2. Retail Pharmacies
11.3.3. Drug Stores
11.3.4. Mail Order Pharmacy
12. Global Vaginitis Treatment Drugs Market Analysis 2015-2021 and Forecast 2022–2030, by Region
12.1. Introduction
12.2. Historical Market Size (US$ Mn) Analysis By Region, 2015-2021
12.3. Current Market Size (US$ Mn) Analysis and Forecast By Region, 2022–2030
12.3.1. North America
12.3.2. Latin America
12.3.3. Europe
12.3.4. East Asia
12.3.5. South Asia
12.3.6. Middle East & Africa
12.4. Market Attractiveness Analysis By Region
13. North America Vaginitis Treatment Drugs Market Analysis 2015-2021 and Forecast 2022–2030
13.1. Introduction
13.2. Historical Market Size (US$ Mn) Trend Analysis By Market Taxonomy, 2015-2021
13.3. Market Size (US$ Mn) Forecast By Market Taxonomy, 2022–2030
13.3.1. By Drug Type
13.3.2. By Indication
13.3.3. By Route of Administration
13.3.4. By Schedule of Drug
13.3.5. By Distribution Channel
13.3.6. By Country
13.3.6.1. U.S.
13.3.6.2. Canada
13.4. Market Attractiveness Analysis
13.4.1. By Drug Type
13.4.2. By Indication
13.4.3. By Route of Administration
13.4.4. By Schedule of Drug
13.4.5. By Distribution Channel
13.4.6. By Country
13.5. Market Trends
14. Latin America Vaginitis Treatment Drugs Market Analysis 2015-2021 and Forecast 2022–2030
14.1. Introduction
14.2. Historical Market Size (US$ Mn) Trend Analysis By Market Taxonomy, 2015-2021
14.3. Market Size (US$ Mn) Forecast By Market Taxonomy, 2022–2030
14.3.1. By Drug Type
14.3.2. By Indication
14.3.3. By Route of Administration
14.3.4. By Schedule of Drug
14.3.5. By Distribution Channel
14.3.6. By Country
14.3.6.1. Brazil
14.3.6.2. Mexico
14.3.6.3. Argentina
14.3.6.4. Rest of Latin America
14.4. Market Attractiveness Analysis
14.4.1. By Drug Type
14.4.2. By Indication
14.4.3. By Route of Administration
14.4.4. By Schedule of Drug
14.4.5. By Distribution Channel
14.4.6. By Country
14.5. Market Trends
15. Europe Vaginitis Treatment Drugs Market Analysis 2015-2021 and Forecast 2022–2030
15.1. Introduction
15.2. Historical Market Size (US$ Mn) Trend Analysis By Market Taxonomy, 2015-2021
15.3. Market Size (US$ Mn) Forecast By Market Taxonomy, 2022–2030
15.3.1. By Drug Type
15.3.2. By Indication
15.3.3. By Route of Administration
15.3.4. By Schedule of Drug
15.3.5. By Distribution Channel
15.3.6. By Country
15.3.6.1. Germany
15.3.6.2. Italy
15.3.6.3. France
15.3.6.4. U.K.
15.3.6.5. Spain
15.3.6.6. Russia
15.3.6.7. Rest of Europe
15.4. Market Attractiveness Analysis
15.4.1. By Drug Type
15.4.2. By Indication
15.4.3. By Route of Administration
15.4.4. By Schedule of Drug
15.4.5. By Distribution Channel
15.4.6. By Country
15.5. Market Trends
16. South Asia Vaginitis Treatment Drugs Market Analysis 2015-2021 and Forecast 2022–2030
16.1. Introduction
16.2. Historical Market Size (US$ Mn) Trend Analysis By Market Taxonomy, 2015-2021
16.3. Market Size (US$ Mn) Forecast By Market Taxonomy, 2022–2030
16.3.1. By Drug Type
16.3.2. By Indication
16.3.3. By Route of Administration
16.3.4. By Schedule of Drug
16.3.5. By Distribution Channel
16.3.6. By Country
16.3.6.1. India
16.3.6.2. Thailand
16.3.6.3. Indonesia
16.3.6.4. Malaysia
16.3.6.5. Rest of South Asia
16.4. Market Attractiveness Analysis
16.4.1. By Drug Type
16.4.2. By Indication
16.4.3. By Route of Administration
16.4.4. By Schedule of Drug
16.4.5. By Distribution Channel
16.4.6. By Country
16.5. Market Trends
17. East Asia Vaginitis Treatment Drugs Market Analysis 2015-2021 and Forecast 2022–2030
17.1. Introduction
17.2. Historical Market Size (US$ Mn) Trend Analysis By Market Taxonomy, 2015-2021
17.3. Market Size (US$ Mn) Forecast By Market Taxonomy, 2022–2030
17.3.1. By Drug Type
17.3.2. By Indication
17.3.3. By Route of Administration
17.3.4. By Schedule of Drug
17.3.5. By Distribution Channel
17.3.6. By Country
17.3.6.1. China
17.3.6.2. Japan
17.3.6.3. South Korea
17.4. Market Attractiveness Analysis
17.4.1. By Drug Type
17.4.2. By Indication
17.4.3. By Route of Administration
17.4.4. By Schedule of Drug
17.4.5. By Distribution Channel
17.4.6. By Country
17.5. Market Trends
18. Oceania Vaginitis Treatment Drugs Market Analysis 2015-2021 and Forecast 2022–2030
18.1. Introduction
18.2. Historical Market Size (US$ Mn) Trend Analysis By Market Taxonomy, 2015-2021
18.3. Market Size (US$ Mn) Forecast By Market Taxonomy, 2022–2030
18.3.1. By Drug Type
18.3.2. By Indication
18.3.3. By Route of Administration
18.3.4. By Schedule of Drug
18.3.5. By Distribution Channel
18.3.6. By Country
18.3.6.1. Australia
18.3.6.2. New Zealand
18.4. Market Attractiveness Analysis
18.4.1. By Drug Type
18.4.2. By Indication
18.4.3. By Route of Administration
18.4.4. By Schedule of Drug
18.4.5. By Distribution Channel
18.4.6. By Country
18.5. Market Trends
19. Middle East and Africa Vaginitis Treatment Drugs Market Analysis 2015-2021 and Forecast 2022–2030
19.1. Introduction
19.2. Historical Market Size (US$ Mn) Trend Analysis By Market Taxonomy, 2015-2021
19.3. Market Size (US$ Mn) Forecast By Market Taxonomy, 2022–2030
19.3.1. By Drug Type
19.3.2. By Indication
19.3.3. By Route of Administration
19.3.4. By Schedule of Drug
19.3.5. By Distribution Channel
19.3.6. By Country
19.3.6.1. GCC Countries
19.3.6.2. Turkey
19.3.6.3. Northern Africa
19.3.6.4. South Africa
19.3.6.5. Rest of Middle East and Africa
19.4. Market Attractiveness Analysis
19.4.1. By Drug Type
19.4.2. By Indication
19.4.3. By Route of Administration
19.4.4. By Schedule of Drug
19.4.5. By Distribution Channel
19.4.6. By Country
19.5. Market Trends
20. Key and Emerging Countries Vaginitis Treatment Drugs Market Analysis
20.1. Introduction
20.1.1. Market Value Proportion Analysis, By Key Countries
20.1.2. Global Vs. Country Growth Comparison
20.2. U.S. Vaginitis Treatment Drugs Market Analysis
20.2.1. By Drug Type
20.2.2. By Indication
20.2.3. By Route of Administration
20.2.4. By Schedule of Drug
20.2.5. By Distribution Channel
20.3. Canada Vaginitis Treatment Drugs Market Analysis
20.3.1. By Drug Type
20.3.2. By Indication
20.3.3. By Route of Administration
20.3.4. By Schedule of Drug
20.3.5. By Distribution Channel
20.4. Mexico Vaginitis Treatment Drugs Market Analysis
20.4.1. By Drug Type
20.4.2. By Indication
20.4.3. By Route of Administration
20.4.4. By Schedule of Drug
20.4.5. By Distribution Channel
20.5. Brazil Vaginitis Treatment Drugs Market Analysis
20.5.1. By Drug Type
20.5.2. By Indication
20.5.3. By Route of Administration
20.5.4. By Schedule of Drug
20.5.5. By Distribution Channel
20.6. Germany Vaginitis Treatment Drugs Market Analysis
20.6.1. By Drug Type
20.6.2. By Indication
20.6.3. By Route of Administration
20.6.4. By Schedule of Drug
20.6.5. By Distribution Channel
20.7. Italy Vaginitis Treatment Drugs Market Analysis
20.7.1. By Drug Type
20.7.2. By Indication
20.7.3. By Route of Administration
20.7.4. By Schedule of Drug
20.7.5. By Distribution Channel
20.8. France Vaginitis Treatment Drugs Market Analysis
20.8.1. By Drug Type
20.8.2. By Indication
20.8.3. By Route of Administration
20.8.4. By Schedule of Drug
20.8.5. By Distribution Channel
20.9. U.K. Vaginitis Treatment Drugs Market Analysis
20.9.1. By Drug Type
20.9.2. By Indication
20.9.3. By Route of Administration
20.9.4. By Schedule of Drug
20.9.5. By Distribution Channel
20.10. Spain Vaginitis Treatment Drugs Market Analysis
20.10.1. By Drug Type
20.10.2. By Indication
20.10.3. By Route of Administration
20.10.4. By Schedule of Drug
20.10.5. By Distribution Channel
20.11. Russia Vaginitis Treatment Drugs Market Analysis
20.11.1. By Drug Type
20.11.2. By Indication
20.11.3. By Route of Administration
20.11.4. By Schedule of Drug
20.11.5. By Distribution Channel
20.12. China Vaginitis Treatment Drugs Market Analysis
20.12.1. By Drug Type
20.12.2. By Indication
20.12.3. By Route of Administration
20.12.4. By Schedule of Drug
20.12.5. By Distribution Channel
20.13. Japan Vaginitis Treatment Drugs Market Analysis
20.13.1. By Drug Type
20.13.2. By Indication
20.13.3. By Route of Administration
20.13.4. By Schedule of Drug
20.13.5. By Distribution Channel
20.14. South Korea Vaginitis Treatment Drugs Market Analysis
20.14.1. By Drug Type
20.14.2. By Indication
20.14.3. By Route of Administration
20.14.4. By Schedule of Drug
20.14.5. By Distribution Channel
20.15. India Vaginitis Treatment Drugs Market Analysis
20.15.1. By Drug Type
20.15.2. By Indication
20.15.3. By Route of Administration
20.15.4. By Schedule of Drug
20.15.5. By Distribution Channel
20.16. Australia Vaginitis Treatment Drugs Market Analysis
20.16.1. By Drug Type
20.16.2. By Indication
20.16.3. By Route of Administration
20.16.4. By Schedule of Drug
20.16.5. By Distribution Channel
20.17. New Zealand Vaginitis Treatment Drugs Market Analysis
20.17.1. By Drug Type
20.17.2. By Indication
20.17.3. By Route of Administration
20.17.4. By Schedule of Drug
20.17.5. By Distribution Channel
20.18. GCC Countries Vaginitis Treatment Drugs Market Analysis
20.18.1. By Drug Type
20.18.2. By Indication
20.18.3. By Route of Administration
20.18.4. By Schedule of Drug
20.18.5. By Distribution Channel
20.19. Turkey Vaginitis Treatment Drugs Market Analysis
20.19.1. By Drug Type
20.19.2. By Indication
20.19.3. By Route of Administration
20.19.4. By Schedule of Drug
20.19.5. By Distribution Channel
20.20. South Africa Vaginitis Treatment Drugs Market Analysis
20.20.1. By Drug Type
20.20.2. By Indication
20.20.3. By Route of Administration
20.20.4. By Schedule of Drug
20.20.5. By Distribution Channel
21. Market Structure Analysis
21.1. Market Analysis by Tier of Companies
21.2. Market Concentration
22. Competition Analysis
22.1. Competition Dashboard
22.2. Competition Deep Dive
22.2.1. Abbott Laboratories
22.2.2. Baxter International Inc.
22.2.3. B. Braun Melsungen AG
22.2.4. Allergan AG
22.2.5. Johnson & Johnson
22.2.6. Prestige Consumer Healthcare, Inc.
22.2.7. Sanofi SA
22.2.8. Merck & Co Inc.
22.2.9. Aurobindo Pharma Limited
22.2.10. Mylan NV
22.2.11. Sun Pharmaceutical Industries Limited
22.2.12. Pfizer Inc.
22.2.13. Teva Pharmaceutical Industries Ltd
22.2.14. Bayer AG
22.2.15. Dr. Reddy's Laboratories Ltd
22.2.16. Novartis International AG
22.2.17. Cipla Ltd.
22.2.18. Bausch & Lomb Incorporated
22.2.19. Galderma S.A.
22.2.20. Bristol Myers Squibb Company
22.2.21. Perrigo Company plc.
22.2.22. Lupin Pharmaceuticals, Inc.
22.2.23. Glenmark Pharmaceuticals Inc.
22.2.24. Eurofins Scientific SE
22.2.25. Apotex Inc.
23. Assumptions and Acronyms Used
24. Research Methodology
Let us know your requirement to get
100% FREE customization
Table 01: Global Vaginitis Treatment Drugs Market Analysis 2015-2021 and Forecast 2022–2030 , By Drug Type
Table 02: Global Vaginitis Treatment Drugs Market Analysis 2015-2021 and Forecast 2022–2030 , By Indication
Table 03: Global Vaginitis Treatment Drugs Market Analysis 2015-2021 and Forecast 2022–2030 , By Route of Administration
Table 04: Global Vaginitis Treatment Drugs Market Analysis 2015-2021 and Forecast 2022–2030 , By Schedule of Drug
Table 05: Global Vaginitis Treatment Drugs Market Analysis 2015-2021 and Forecast 2022–2030 , By Distribution Channel
Table 06: Global Vaginitis Treatment Drugs Market Analysis 2015-2021 and Forecast 2022–2030, By Region
Table 07: North America Vaginitis Treatment Drugs Market Value (US$ Mn) Analysis 2015–2021 and Forecast 2022–2030 , By Country
Table 08: North America Vaginitis Treatment Drugs Market Value (US$ Mn) Analysis 2015-2021 and Forecast 2022–2030 , By Drug Type
Table 09: North America Vaginitis Treatment Drugs Market Value (US$ Mn) Analysis 2015-2021 and Forecast 2022–2030 , By Indication
Table 10: North America Vaginitis Treatment Drugs Market Value (US$ Mn) Analysis 2015-2021 and Forecast 2022–2030 , By Route of Administration
Table 11: North America Vaginitis Treatment Drugs Market Value (US$ Mn) Analysis 2015-2021 and Forecast 2022–2030 , By Schedule of Drug
Table 12: North America Vaginitis Treatment Drugs Market Value (US$ Mn) Analysis 2015-2021 and Forecast 2022–2030 , By Distribution Channel
Table 13: Latin America Vaginitis Treatment Drugs Market Value (US$ Mn) Analysis 2015–2021 and Forecast 2022–2030 , By Country
Table 14: Latin America Vaginitis Treatment Drugs Market Value (US$ Mn) Analysis 2015-2021 and Forecast 2022–2030 , By Drug Type
Table 15: Latin America Vaginitis Treatment Drugs Market Value (US$ Mn) Analysis 2015-2021 and Forecast 2022–2030 , By Indication
Table 16: Latin America Vaginitis Treatment Drugs Market Value (US$ Mn) Analysis 2015-2021 and Forecast 2022–2030 , By Route of Administration
Table 17: Latin America Vaginitis Treatment Drugs Market Value (US$ Mn) Analysis 2015-2021 and Forecast 2022–2030 , By Schedule of Drug
Table 18: Latin America Vaginitis Treatment Drugs Market Value (US$ Mn) Analysis 2015-2021 and Forecast 2022–2030 , By Distribution Channel
Table 19: Europe Vaginitis Treatment Drugs Market Value (US$ Mn) Analysis 2015–2021 and Forecast 2022–2030 , By Country
Table 20: Europe Vaginitis Treatment Drugs Market Value (US$ Mn) Analysis 2015-2021 and Forecast 2022–2030 , By Drug Type
Table 21: Europe Vaginitis Treatment Drugs Market Value (US$ Mn) Analysis 2015-2021 and Forecast 2022–2030 , By Indication
Table 22: Europe Vaginitis Treatment Drugs Market Value (US$ Mn) Analysis 2015-2021 and Forecast 2022–2030 , By Route of Administration
Table 23: Europe Vaginitis Treatment Drugs Market Value (US$ Mn) Analysis 2015-2021 and Forecast 2022–2030 , By Schedule of Drug
Table 24: Europe Vaginitis Treatment Drugs Market Value (US$ Mn) Analysis 2015-2021 and Forecast 2022–2030 , By Distribution Channel
Table 25: South Asia Vaginitis Treatment Drugs Market Value (US$ Mn) Analysis 2015–2021 and Forecast 2022–2030 , By Country
Table 26: South Asia Vaginitis Treatment Drugs Market Value (US$ Mn) Analysis 2015-2021 and Forecast 2022–2030 , By Drug Type
Table 27: South Asia Vaginitis Treatment Drugs Market Value (US$ Mn) Analysis 2015-2021 and Forecast 2022–2030 , By Indication
Table 28: South Asia Vaginitis Treatment Drugs Market Value (US$ Mn) Analysis 2015-2021 and Forecast 2022–2030 , By Route of Administration
Table 29: South Asia Vaginitis Treatment Drugs Market Value (US$ Mn) Analysis 2015-2021 and Forecast 2022–2030 , By Schedule of Drug
Table 30: South Asia Vaginitis Treatment Drugs Market Value (US$ Mn) Analysis 2015-2021 and Forecast 2022–2030 , By Distribution Channel
Table 31: East Asia Vaginitis Treatment Drugs Market Value (US$ Mn) Analysis 2015–2021 and Forecast 2022–2030 , By Country
Table 32: East Asia Vaginitis Treatment Drugs Market Value (US$ Mn) Analysis 2015-2021 and Forecast 2022–2030 , By Drug Type
Table 33: East Asia Vaginitis Treatment Drugs Market Value (US$ Mn) Analysis 2015-2021 and Forecast 2022–2030 , By Indication
Table 34: East Asia Vaginitis Treatment Drugs Market Value (US$ Mn) Analysis 2015-2021 and Forecast 2022–2030 , By Route of Administration
Table 35: East Asia Vaginitis Treatment Drugs Market Value (US$ Mn) Analysis 2015-2021 and Forecast 2022–2030 , By Schedule of Drug
Table 36: East Asia Vaginitis Treatment Drugs Market Value (US$ Mn) Analysis 2015-2021 and Forecast 2022–2030 , By Distribution Channel
Table 37: Oceania Vaginitis Treatment Drugs Market Value (US$ Mn) Analysis 2015–2021 and Forecast 2022–2030 , By Country
Table 38: Oceania Vaginitis Treatment Drugs Market Value (US$ Mn) Analysis 2015-2021 and Forecast 2022–2030 , By Drug Type
Table 39: Oceania Vaginitis Treatment Drugs Market Value (US$ Mn) Analysis 2015-2021 and Forecast 2022–2030 , By Indication
Table 40: Oceania Vaginitis Treatment Drugs Market Value (US$ Mn) Analysis 2015-2021 and Forecast 2022–2030 , By Route of Administration
Table 41: Oceania Vaginitis Treatment Drugs Market Value (US$ Mn) Analysis 2015-2021 and Forecast 2022–2030 , By Schedule of Drug
Table 42: Oceania Vaginitis Treatment Drugs Market Value (US$ Mn) Analysis 2015-2021 and Forecast 2022–2030 , By Distribution Channel
Table 43: Middle East & Africa Vaginitis Treatment Drugs Market Value (US$ Mn) Analysis 2015–2021 and Forecast 2022–2030 , By Country
Table 44: Middle East & Africa Vaginitis Treatment Drugs Market Value (US$ Mn) Analysis 2015-2021 and Forecast 2022–2030 , By Drug Type
Table 45: Middle East & Africa Vaginitis Treatment Drugs Market Value (US$ Mn) Analysis 2015-2021 and Forecast 2022–2030 , By Indication
Table 46: Middle East & Africa Vaginitis Treatment Drugs Market Value (US$ Mn) Analysis 2015-2021 and Forecast 2022–2030 , By Route of Administration
Table 47: Middle East & Africa Vaginitis Treatment Drugs Market Value (US$ Mn) Analysis 2015-2021 and Forecast 2022–2030 , By Schedule of Drug
Table 48: Middle East & Africa Vaginitis Treatment Drugs Market Value (US$ Mn) Analysis 2015-2021 and Forecast 2022–2030 , By Distribution Channel
Find your sweet spots for generating winning opportunities in this market.
Talk to AnalystFigure 01: Global Vaginitis Treatment Drugs Market Value Analysis, 2015–2021
Figure 02: Global Vaginitis Treatment Drugs Market Forecast & Y-o-Y Growth, 2022–2030
Figure 03: Global Vaginitis Treatment Drugs Market Absolute $ Opportunity (US$ Mn) Analysis, 2021–2030
Figure 04: Global Vaginitis Treatment Drugs Market Y-o-Y Growth (%) Analysis, 2021–2030
Figure 05: Global Vaginitis Treatment Drugs Market Value Share (%) Analysis 2022 & 2030, By Drug Type
Figure 06: Global Vaginitis Treatment Drugs Market Y-o-Y Growth (%) Analysis 2021-2030, By Drug Type
Figure 07: Global Vaginitis Treatment Drugs Market Attractiveness Analysis 2022–2030 , By Drug Type
Figure 08: Global Vaginitis Treatment Drugs Market Value Share (%) Analysis 2022 & 2030, By Indication
Figure 09: Global Vaginitis Treatment Drugs Market Y-o-Y Growth (%) Analysis 2021-2030, By Indication
Figure 10: Global Vaginitis Treatment Drugs Market Attractiveness Analysis 2022–2030 , By Indication
Figure 11: Global Vaginitis Treatment Drugs Market Value Share (%) Analysis 2022 & 2030, By Route of Administration
Figure 12: Global Vaginitis Treatment Drugs Market Y-o-Y Growth (%) Analysis 2021-2030, By Route of Administration
Figure 13: Global Vaginitis Treatment Drugs Market Attractiveness Analysis 2022–2030 , By Route of Administration
Figure 14: Global Vaginitis Treatment Drugs Market Value Share (%) Analysis 2022 & 2030, By Schedule of Drug
Figure 15: Global Vaginitis Treatment Drugs Market Y-o-Y Growth (%) Analysis 2021-2030, By Schedule of Drug
Figure 16: Global Vaginitis Treatment Drugs Market Attractiveness Analysis 2022–2030 , By Schedule of Drug
Figure 17: Global Vaginitis Treatment Drugs Market Value Share (%) Analysis 2022 & 2030, By Distribution Channel
Figure 18: Global Vaginitis Treatment Drugs Market Y-o-Y Growth (%) Analysis 2021-2030, By Distribution Channel
Figure 19: Global Vaginitis Treatment Drugs Market Attractiveness Analysis 2022–2030 , By Distribution Channel
Figure 20: Global Vaginitis Treatment Drugs Market Value Share (%) Analysis 2022 & 2030, By Region
Figure 21: Global Vaginitis Treatment Drugs Market Y-o-Y Growth (%) Analysis 2021-2030, By Region
Figure 22: Global Vaginitis Treatment Drugs Market Attractiveness Analysis 2022–2030 , By Region
Figure 23: North America Vaginitis Treatment Drugs Market Value Analysis, 2015–2021
Figure 24: North America Vaginitis Treatment Drugs Market Forecast & Y-o-Y growth, 2022–2030
Figure 25: North America Vaginitis Treatment Drugs Market Attractiveness Analysis, By Drug Type
Figure 26: North America Vaginitis Treatment Drugs Market Attractiveness Analysis, By Indication
Figure 27: North America Vaginitis Treatment Drugs Market Attractiveness Analysis, By Route of Administration
Figure 28: North America Vaginitis Treatment Drugs Market Attractiveness Analysis, By Schedule of Drug
Figure 29: North America Vaginitis Treatment Drugs Market Attractiveness Analysis, By Distribution Channel
Figure 30: North America Vaginitis Treatment Drugs Market Attractiveness Analysis, By Country
Figure 31: Latin America Vaginitis Treatment Drugs Market Value Analysis, 2015–2021
Figure 32: Latin America Vaginitis Treatment Drugs Market Forecast & Y-o-Y growth, 2022–2030
Figure 33: Latin America Vaginitis Treatment Drugs Market Attractiveness Analysis, By Drug Type
Figure 34: Latin America Vaginitis Treatment Drugs Market Attractiveness Analysis, By Indication
Figure 35: Latin America Vaginitis Treatment Drugs Market Attractiveness Analysis, By Route of Administration
Figure 36: Latin America Vaginitis Treatment Drugs Market Attractiveness Analysis, By Schedule of Drug
Figure 37: Latin America Vaginitis Treatment Drugs Market Attractiveness Analysis, By Distribution Channel
Figure 38: Latin America Vaginitis Treatment Drugs Market Attractiveness Analysis, By Country
Figure 39: Europe Vaginitis Treatment Drugs Market Value Analysis, 2015–2021
Figure 40: Europe Vaginitis Treatment Drugs Market Forecast & Y-o-Y growth, 2022–2030
Figure 41: Europe Vaginitis Treatment Drugs Market Attractiveness Analysis, By Drug Type
Figure 42: Europe Vaginitis Treatment Drugs Market Attractiveness Analysis, By Indication
Figure 43: Europe Vaginitis Treatment Drugs Market Attractiveness Analysis, By Route of Administration
Figure 44: Europe Vaginitis Treatment Drugs Market Attractiveness Analysis, By Schedule of Drug
Figure 45: Europe Vaginitis Treatment Drugs Market Attractiveness Analysis, By Distribution Channel
Figure 46: Europe Vaginitis Treatment Drugs Market Attractiveness Analysis, By Country
Figure 47: South Asia Vaginitis Treatment Drugs Market Value Analysis, 2015–2021
Figure 48: South Asia Vaginitis Treatment Drugs Market Forecast & Y-o-Y growth, 2022–2030
Figure 49: South Asia Vaginitis Treatment Drugs Market Attractiveness Analysis, By Drug Type
Figure 50: South Asia Vaginitis Treatment Drugs Market Attractiveness Analysis, By Indication
Figure 51: South Asia Vaginitis Treatment Drugs Market Attractiveness Analysis, By Route of Administration
Figure 52: South Asia Vaginitis Treatment Drugs Market Attractiveness Analysis, By Schedule of Drug
Figure 53: South Asia Vaginitis Treatment Drugs Market Attractiveness Analysis, By Distribution Channel
Figure 54: South Asia Vaginitis Treatment Drugs Market Attractiveness Analysis, By Country
Figure 55: East Asia Vaginitis Treatment Drugs Market Value Analysis, 2015–2021
Figure 56: East Asia Vaginitis Treatment Drugs Market Forecast & Y-o-Y growth, 2022–2030
Figure 57: East Asia Vaginitis Treatment Drugs Market Attractiveness Analysis, By Drug Type
Figure 58: East Asia Vaginitis Treatment Drugs Market Attractiveness Analysis, By Indication
Figure 59: East Asia Vaginitis Treatment Drugs Market Attractiveness Analysis, By Route of Administration
Figure 60: East Asia Vaginitis Treatment Drugs Market Attractiveness Analysis, By Schedule of Drug
Figure 61: East Asia Vaginitis Treatment Drugs Market Attractiveness Analysis, By Distribution Channel
Figure 62: East Asia Vaginitis Treatment Drugs Market Attractiveness Analysis, By Country
Figure 63: Oceania Vaginitis Treatment Drugs Market Value Analysis, 2015–2021
Figure 64: Oceania Vaginitis Treatment Drugs Market Forecast & Y-o-Y growth, 2022–2030
Figure 65: Oceania Vaginitis Treatment Drugs Market Attractiveness Analysis, By Drug Type
Figure 66: Oceania Vaginitis Treatment Drugs Market Attractiveness Analysis, By Indication
Figure 67: Oceania Vaginitis Treatment Drugs Market Attractiveness Analysis, By Route of Administration
Figure 68: Oceania Vaginitis Treatment Drugs Market Attractiveness Analysis, By Schedule of Drug
Figure 69: Oceania Vaginitis Treatment Drugs Market Attractiveness Analysis, By Distribution Channel
Figure 70: Oceania Vaginitis Treatment Drugs Market Attractiveness Analysis, By Country
Figure 71: Middle East & Africa Vaginitis Treatment Drugs Market Value Analysis, 2015–2021
Figure 72: Middle East & Africa Vaginitis Treatment Drugs Market Forecast & Y-o-Y growth, 2022–2030
Figure 73: Middle East & Africa Vaginitis Treatment Drugs Market Attractiveness Analysis, By Drug Type
Figure 74: Middle East & Africa Vaginitis Treatment Drugs Market Attractiveness Analysis, By Indication
Figure 75: Middle East & Africa Vaginitis Treatment Drugs Market Attractiveness Analysis, By Route of Administration
Figure 76: Middle East & Africa Vaginitis Treatment Drugs Market Attractiveness Analysis, By Schedule of Drug
Figure 77: Middle East & Africa Vaginitis Treatment Drugs Market Attractiveness Analysis, By Distribution Channel
Figure 78: Middle East & Africa Vaginitis Treatment Drugs Market Attractiveness Analysis, By Country
Figure 79: U.S. Vaginitis Treatment Drugs Market Share Analysis (%), By Drug Type, 2021A
Figure 80: U.S. Vaginitis Treatment Drugs Market Share Analysis (%), By Indication, 2021A
Figure 81: U.S. Vaginitis Treatment Drugs Market Share Analysis (%), By Distribution Channels, 2021A
Figure 82: U.S. Vaginitis Treatment Drugs Market Share Analysis (%), By Route of Administration, 2021A
Figure 83: U.S. Vaginitis Treatment Drugs Market Share Analysis (%), By Schedule of Drug, 2021A
Figure 84: Canada Vaginitis Treatment Drugs Market Share Analysis (%), By Drug Type, 2021A
Figure 85: Canada Vaginitis Treatment Drugs Market Share Analysis (%), By Indication, 2021A
Figure 86: Canada Vaginitis Treatment Drugs Market Share Analysis (%), By Distribution Channels, 2021A
Figure 87: Canada Vaginitis Treatment Drugs Market Share Analysis (%), By Route of Administration, 2021A
Figure 88: Canada Vaginitis Treatment Drugs Market Share Analysis (%), By Schedule of Drug, 2021A
Figure 89: Mexico Vaginitis Treatment Drugs Market Share Analysis (%), By Drug Type, 2021A
Figure 90: Mexico Vaginitis Treatment Drugs Market Share Analysis (%), By Indication, 2021A
Figure 91: Mexico Vaginitis Treatment Drugs Market Share Analysis (%), By Distribution Channels, 2021A
Figure 92: Mexico Vaginitis Treatment Drugs Market Share Analysis (%), By Route of Administration, 2021A
Figure 93: Mexico Vaginitis Treatment Drugs Market Share Analysis (%), By Schedule of Drug, 2021A
Figure 94: Brazil Vaginitis Treatment Drugs Market Share Analysis (%), By Drug Type, 2021A
Figure 95: Brazil Vaginitis Treatment Drugs Market Share Analysis (%), By Indication, 2021A
Figure 96: Brazil Vaginitis Treatment Drugs Market Share Analysis (%), By Distribution Channels, 2021A
Figure 97: Brazil Vaginitis Treatment Drugs Market Share Analysis (%), By Route of Administration, 2021A
Figure 98: Brazil Vaginitis Treatment Drugs Market Share Analysis (%), By Schedule of Drug, 2021A
Figure 99: U.K. Vaginitis Treatment Drugs Market Share Analysis (%), By Drug Type, 2021A
Figure 100: U.K. Vaginitis Treatment Drugs Market Share Analysis (%), By Indication, 2021A
Figure 101: U.K. Vaginitis Treatment Drugs Market Share Analysis (%), By Distribution Channels, 2021A
Figure 102: U.K. Vaginitis Treatment Drugs Market Share Analysis (%), By Route of Administration, 2021A
Figure 103: U.K. Vaginitis Treatment Drugs Market Share Analysis (%), By Schedule of Drug, 2021A
Figure 104: Germany Vaginitis Treatment Drugs Market Share Analysis (%), By Drug Type, 2021A
Figure 105: Germany Vaginitis Treatment Drugs Market Share Analysis (%), By Indication, 2021A
Figure 106: Germany Vaginitis Treatment Drugs Market Share Analysis (%), By Distribution Channels, 2021A
Figure 107: Germany Vaginitis Treatment Drugs Market Share Analysis (%), By Route of Administration, 2021A
Figure 108: Germany Vaginitis Treatment Drugs Market Share Analysis (%), By Schedule of Drug, 2021A
Figure 109: France Vaginitis Treatment Drugs Market Share Analysis (%), By Drug Type, 2021A
Figure 110: France Vaginitis Treatment Drugs Market Share Analysis (%), By Indication, 2021A
Figure 111: France Vaginitis Treatment Drugs Market Share Analysis (%), By Distribution Channels, 2021A
Figure 112: France Vaginitis Treatment Drugs Market Share Analysis (%), By Route of Administration, 2021A
Figure 113: France Vaginitis Treatment Drugs Market Share Analysis (%), By Schedule of Drug, 2021A
Figure 114: Italy Vaginitis Treatment Drugs Market Share Analysis (%), By Drug Type, 2021A
Figure 115: Italy Vaginitis Treatment Drugs Market Share Analysis (%), By Indication, 2021A
Figure 116: Italy Vaginitis Treatment Drugs Market Share Analysis (%), By Distribution Channels, 2021A
Figure 117: Italy Vaginitis Treatment Drugs Market Share Analysis (%), By Route of Administration, 2021A
Figure 118: Italy Vaginitis Treatment Drugs Market Share Analysis (%), By Schedule of Drug, 2021A
Figure 119: Spain Vaginitis Treatment Drugs Market Share Analysis (%), By Drug Type, 2021A
Figure 120: Spain Vaginitis Treatment Drugs Market Share Analysis (%), By Indication, 2021A
Figure 121: Spain Vaginitis Treatment Drugs Market Share Analysis (%), By Distribution Channels, 2021A
Figure 122: Spain Vaginitis Treatment Drugs Market Share Analysis (%), By Route of Administration, 2021A
Figure 123: Spain Vaginitis Treatment Drugs Market Share Analysis (%), By Schedule of Drug, 2021A
Figure 124: Russia Vaginitis Treatment Drugs Market Share Analysis (%), By Drug Type, 2021A
Figure 125: Russia Vaginitis Treatment Drugs Market Share Analysis (%), By Indication, 2021A
Figure 126: Russia Vaginitis Treatment Drugs Market Share Analysis (%), By Distribution Channels, 2021A
Figure 127: Russia Vaginitis Treatment Drugs Market Share Analysis (%), By Route of Administration, 2021A
Figure 128: Russia Vaginitis Treatment Drugs Market Share Analysis (%), By Schedule of Drug, 2021A
Figure 129: China Vaginitis Treatment Drugs Market Share Analysis (%), By Drug Type, 2021A
Figure 130: China Vaginitis Treatment Drugs Market Share Analysis (%), By Indication, 2021A
Figure 131: China Vaginitis Treatment Drugs Market Share Analysis (%), By Distribution Channels, 2021A
Figure 132: China Vaginitis Treatment Drugs Market Share Analysis (%), By Route of Administration, 2021A
Figure 133: China Vaginitis Treatment Drugs Market Share Analysis (%), By Schedule of Drug, 2021A
Figure 134: Japan Vaginitis Treatment Drugs Market Share Analysis (%), By Drug Type, 2021A
Figure 135: Japan Vaginitis Treatment Drugs Market Share Analysis (%), By Indication, 2021A
Figure 136: Japan Vaginitis Treatment Drugs Market Share Analysis (%), By Distribution Channels, 2021A
Figure 137: Japan Vaginitis Treatment Drugs Market Share Analysis (%), By Route of Administration, 2021A
Figure 138: Japan Vaginitis Treatment Drugs Market Share Analysis (%), By Schedule of Drug, 2021A
Figure 139: South Korea Vaginitis Treatment Drugs Market Share Analysis (%), By Drug Type, 2021A
Figure 140: South Korea Vaginitis Treatment Drugs Market Share Analysis (%), By Indication, 2021A
Figure 141: South Korea Vaginitis Treatment Drugs Market Share Analysis (%), By Distribution Channels, 2021A
Figure 142: South Korea Vaginitis Treatment Drugs Market Share Analysis (%), By Route of Administration, 2021A
Figure 143: South Korea Vaginitis Treatment Drugs Market Share Analysis (%), By Schedule of Drug, 2021A
Figure 144: India Vaginitis Treatment Drugs Market Share Analysis (%), By Drug Type, 2021A
Figure 145: India Vaginitis Treatment Drugs Market Share Analysis (%), By Indication, 2021A
Figure 146: India Vaginitis Treatment Drugs Market Share Analysis (%), By Distribution Channels, 2021A
Figure 147: India Vaginitis Treatment Drugs Market Share Analysis (%), By Route of Administration, 2021A
Figure 148: India Vaginitis Treatment Drugs Market Share Analysis (%), By Schedule of Drug, 2021A
Figure 149: Australia Vaginitis Treatment Drugs Market Share Analysis (%), By Drug Type, 2021A
Figure 150: Australia Vaginitis Treatment Drugs Market Share Analysis (%), By Indication, 2021A
Figure 151: Australia Vaginitis Treatment Drugs Market Share Analysis (%), By Distribution Channels, 2021A
Figure 152: Australia Vaginitis Treatment Drugs Market Share Analysis (%), By Route of Administration, 2021A
Figure 153: Australia Vaginitis Treatment Drugs Market Share Analysis (%), By Schedule of Drug, 2021A
Figure 154: New Zealand Vaginitis Treatment Drugs Market Share Analysis (%), By Drug Type, 2021A
Figure 155: New Zealand Vaginitis Treatment Drugs Market Share Analysis (%), By Indication, 2021A
Figure 156: New Zealand Vaginitis Treatment Drugs Market Share Analysis (%), By Distribution Channels, 2021A
Figure 157: New Zealand Vaginitis Treatment Drugs Market Share Analysis (%), By Route of Administration, 2021A
Figure 158: New Zealand Vaginitis Treatment Drugs Market Share Analysis (%), By Schedule of Drug, 2021A
Figure 159: GCC Countries Vaginitis Treatment Drugs Market Share Analysis (%), By Drug Type, 2021A
Figure 160: GCC Countries Vaginitis Treatment Drugs Market Share Analysis (%), By Indication, 2021A
Figure 161: GCC Countries Vaginitis Treatment Drugs Market Share Analysis (%), By Distribution Channels, 2021A
Figure 162: GCC Countries Vaginitis Treatment Drugs Market Share Analysis (%), By Route of Administration, 2021A
Figure 163: GCC Countries Vaginitis Treatment Drugs Market Share Analysis (%), By Schedule of Drug, 2021A
Figure 164: Turkey Vaginitis Treatment Drugs Market Share Analysis (%), By Drug Type, 2021A
Figure 165: Turkey Vaginitis Treatment Drugs Market Share Analysis (%), By Indication, 2021A
Figure 166: Turkey Vaginitis Treatment Drugs Market Share Analysis (%), By Distribution Channels, 2021A
Figure 167: Turkey Vaginitis Treatment Drugs Market Share Analysis (%), By Route of Administration, 2021A
Figure 168: Turkey Vaginitis Treatment Drugs Market Share Analysis (%), By Schedule of Drug, 2021A
Figure 169: South Africa Vaginitis Treatment Drugs Market Share Analysis (%), By Drug Type, 2021A
Figure 170: South Africa Vaginitis Treatment Drugs Market Share Analysis (%), By Indication, 2021A
Figure 171: South Africa Vaginitis Treatment Drugs Market Share Analysis (%), By Distribution Channels, 2021A
Figure 172: South Africa Vaginitis Treatment Drugs Market Share Analysis (%), By Route of Administration, 2021A
Figure 173: South Africa Vaginitis Treatment Drugs Market Share Analysis (%), By Schedule of Drug, 2021A
Need specific information?
Request CustomizationExplore Healthcare Insights
View Reports