The vehicle-mounted payment terminal market is projected to expand from USD 0.9 billion in 2025 to USD 2.1 billion by 2035, recording a total growth of 132.4% and advancing at a CAGR of 8.8%. This growth underscores the accelerating transition toward cashless transit ecosystems, fueled by large-scale investments in contactless fare collection infrastructure and smart mobility payment solutions. Public transportation networks worldwide are integrating terminals that consolidate multiple payment modes, contactless cards, QR codes, mobile wallets, and account-based ticketing, into unified hardware architectures that streamline passenger experiences and enable real-time revenue reconciliation. The early adoption phase will be led by urban transportation systems, accounting for 64.2% of total installations, while shuttle and corporate mobility applications expand gradually through enterprise fleet modernization and workforce mobility management programs.
By connectivity, 4G + Bluetooth terminals will maintain dominance with 46.8% share through 2035, given their reliability, cost efficiency, and proven compatibility with existing network infrastructure. However, 5G + UWB systems will record stronger growth post-2028, enabling ultra-low latency processing, spatial fare mapping, and enhanced analytics for smart city mobility platforms. Regionally, China leads global expansion at a CAGR of 11.9%, supported by widespread QR payment ecosystems and government-led digital payment mandates. India (11.0%) follows closely, with rapid Unified Payments Interface integration across metro and state-run bus systems. Germany (10.1%) demonstrates leadership in advanced fare logic and data protection, while Brazil (9.2%), the United States (8.4%), and the United Kingdom (7.5%) sustain demand through transit upgrades and contactless system rollouts.
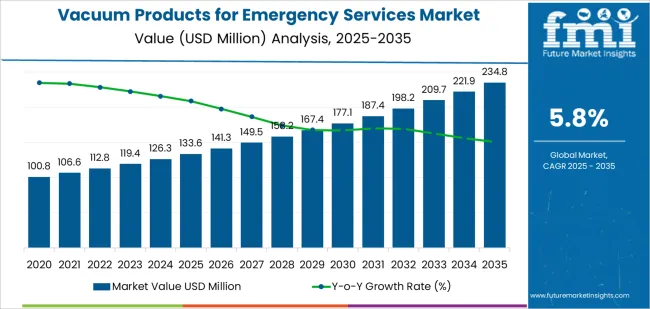
The proliferation of smartphone-enabled payment applications and near-field communication technology is enabling rapid adoption of tap-and-go payment systems that reduce boarding times and improve service reliability. Regulatory initiatives promoting cashless transactions and financial inclusion are creating sustained demand for terminals that support diverse payment instruments while maintaining security standards and data protection protocols. The market is characterized by convergence of payment processing, connectivity infrastructure, and data analytics capabilities, with terminal manufacturers developing ruggedized solutions that withstand harsh operating environments while providing real-time transaction processing, offline payment support, and integration with backend fare management systems for comprehensive revenue tracking and operational insights.
| Metric | Value |
|---|---|
| Market Value (2025) | USD 0.9 billion |
| Market Forecast Value (2035) | USD 2.1 billion |
| Forecast CAGR (2025-2035) | 8.8% |
| PAYMENT DIGITALIZATION TRENDS | TECHNOLOGY INFRASTRUCTURE EVOLUTION | OPERATIONAL & REGULATORY DRIVERS |
|---|---|---|
| Cashless Transaction Growth Continuous expansion of digital payment adoption across consumer segments reducing reliance on cash transactions and creating demand for electronic fare collection infrastructure in public transit. Contactless Payment Proliferation Rapid growth of contactless card issuance and mobile wallet adoption driving passenger expectations for tap-and-go payment experiences at transit boarding points. Passenger Convenience Emphasis Growing focus on reducing boarding times and improving service reliability through automated fare collection eliminating manual cash handling and change-giving delays. |
4G/5G Network Expansion Deployment of high-speed mobile networks enabling real-time transaction processing, remote terminal management, and instant payment verification across vehicle fleets. NFC Technology Maturation Widespread implementation of near-field communication standards in payment cards and mobile devices facilitating seamless contactless payment experiences. Cloud Infrastructure Adoption Development of cloud-based fare management platforms enabling centralized terminal monitoring, transaction reconciliation, and data analytics across distributed vehicle operations. |
Financial Inclusion Initiatives Government programs promoting digital payment adoption and banking access driving terminal deployments that support multiple payment instruments and prepaid accounts. Cash Handling Cost Reduction Transit operators seeking to eliminate expenses associated with cash collection, counting, security, and banking through automated electronic fare collection systems. Revenue Protection Standards Requirements for accurate fare collection, transaction auditing, and revenue reconciliation driving adoption of certified terminals with tamper-proof designs and secure data handling. |
| Category | Segments Covered |
|---|---|
| By Connectivity Type | 4G+Bluetooth, 5G+UWB, Others |
| By Application | Urban Transportation, Shuttle Bus Attendance |
| By Region | China, India, Germany, Brazil, United States, United Kingdom, Japan |
| Segment | 2025 to 2035 Outlook |
|---|---|
| 4G+Bluetooth | Leader in 2025 with 46.8% market share, expected to maintain strong position through 2035. Established 4G cellular infrastructure provides reliable real-time connectivity for transaction processing and backend system communication across urban and suburban routes. Bluetooth integration enables local communication with driver devices, passenger mobile applications, and vehicle systems for comprehensive fare collection orchestration. Proven technology combination with mature vendor ecosystems and competitive component costs supporting widespread adoption. Momentum: steady growth driven by ongoing transit fleet modernization and terminal refresh cycles. Watchouts: gradual migration pressure toward 5G as network coverage expands and advanced features require higher bandwidth. |
| 5G+UWB | Emerging segment gaining traction in premium deployments and next-generation transit systems. 5G connectivity delivers ultra-low latency and higher bandwidth supporting advanced applications including real-time video surveillance integration, passenger counting correlation, and enhanced data analytics. Ultra-wideband technology provides precise spatial positioning enabling zone-based fare calculation and improved fraud detection through passenger location verification. Higher infrastructure costs and limited 5G coverage currently restricting adoption to flagship routes and pilot programs. Momentum: strong growth anticipated post-2028 as 5G networks mature and cost premiums decline. Watchouts: infrastructure investment requirements and battery consumption considerations in vehicle deployments. |
| Others | Encompasses legacy 3G systems, Wi-Fi based solutions, and proprietary communication protocols. Serving existing terminal installations and specialized applications where cellular connectivity is not required or cost-effective. Offline payment capability with periodic synchronization supporting operations in areas with limited network coverage. Market share declining as operators standardize on cellular-based architectures with real-time processing capabilities. Momentum: flat to declining as technology refresh cycles favor modern connectivity standards. Watchouts: sunset of 3G networks forcing accelerated replacements and limited vendor support for non-standard protocols. |
| Segment | 2025 to 2035 Outlook |
|---|---|
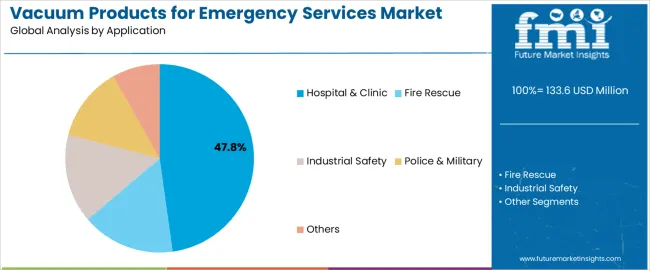
| Urban Transportation | Dominant segment with 64.2% market share in 2025, encompassing municipal bus systems, metro feeder services, and rapid transit networks in metropolitan areas. Comprehensive terminal requirements including support for multiple fare structures, transfer validations, prepaid accounts, and integration with city-wide transportation cards. High-volume deployments across thousands of vehicles creating economies of scale and standardized procurement specifications. Emphasis on reliability, passenger throughput, and revenue protection driving feature requirements. Momentum: steady growth aligned with urban population expansion and transit ridership increases as cities invest in public transportation capacity. Watchouts: municipal budget constraints affecting replacement cycles and pressure for backward compatibility with existing fare card infrastructures. |
| Shuttle Bus Attendance | Specialized segment serving corporate campuses, university transportation, airport transfers, and private shuttle operations. Focus on attendance tracking, route validation, and access control rather than monetary transactions. Terminals often integrated with employee identification systems, student cards, or booking platforms for eligibility verification. Smaller deployment scales but higher customization requirements and integration with enterprise systems including human resources, facility management, and transportation logistics platforms. Momentum: growing steadily with corporate shuttle optimization initiatives and university campus expansion programs emphasizing contactless access. Watchouts: diverse technical requirements across customers complicating standardization and mobile application alternatives potentially reducing dedicated terminal needs. |
| DRIVERS | RESTRAINTS | KEY TRENDS |
|---|---|---|
| Digital Payment Infrastructure Growth Expansion of contactless payment card issuance, mobile wallet adoption, and digital banking services creating foundation for electronic fare collection systems. Operational Efficiency Demands Transit operators seeking to reduce cash handling costs, eliminate fare evasion, and improve boarding speed through automated payment processing and real-time revenue tracking. Passenger Experience Expectations Rising passenger demands for payment flexibility, reduced boarding times, and seamless multi-modal journey experiences driving terminal feature requirements. |
Capital Investment Requirements High upfront costs for terminal procurement, installation, and backend system integration affecting deployment pace, particularly for smaller transit operators with limited budgets. Legacy System Integration Challenges integrating modern terminals with existing fare collection infrastructure, transportation cards, and operational systems requiring customization and extended implementation periods. Connectivity Infrastructure Gaps Limited cellular network coverage on certain routes and in rural areas affecting real-time transaction processing and requiring offline payment capability with synchronization complexity. |
Open Payment System Adoption Implementation of terminals accepting standard bank cards and mobile wallets directly without proprietary transit cards, simplifying passenger experience and reducing card infrastructure costs. Account-Based Ticketing Evolution Shift from card-centric to account-based fare collection where payment credentials link to backend customer accounts enabling best-fare calculation and automated capping. Biometric Payment Integration Emerging trials of biometric authentication including facial recognition and fingerprint scanning for fare payment eliminating need for cards or mobile devices. Sustainability Monitoring Development of terminals with low power consumption, recyclable materials, and integration with vehicle energy management systems supporting environmental sustainability goals. |
| Region | Market Value 2025 (USD Million) | Market Value 2035 (USD Million) | CAGR (2025-2035) |
|---|---|---|---|
| China | 336.7 | 659.8 | 11.9% |
| India | 29.9 | 45.0 | 11.0% |
| Germany | 606.4 | 1,190.7 | 10.1% |
| Brazil | 717.8 | 1,409.5 | 9.2% |
| United States | 781.0 | 1,533.5 | 8.4% |
| United Kingdom | 849.7 | 1,668.4 | 7.5% |
| Japan | 1,005.9 | 1,975.0 | 6.6% |
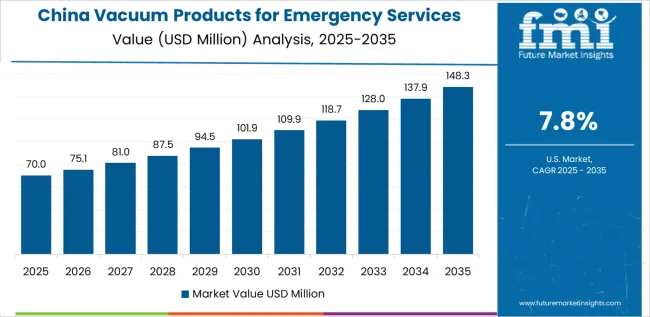
Revenue from vehicle-mounted payment terminals in China is projected to grow at a CAGR of 11.9% by 2035, driven by extensive smart city initiatives and comprehensive digital payment infrastructure creating substantial opportunities for terminal providers across urban transit systems, intercity bus services, and specialized transportation applications. The country's leadership in mobile payment adoption and QR code technology is creating demand for terminals that seamlessly integrate with platforms including Alipay, WeChat Pay, and UnionPay while supporting traditional transportation cards. Major metropolitan transit authorities including Beijing, Shanghai, and Shenzhen are implementing next-generation fare collection systems where terminals serve as critical touchpoints for unified payment experiences across buses, subways, and bike-sharing networks.
Government initiatives promoting cashless transactions and financial digitalization are accelerating terminal deployments, with regulatory requirements mandating real-time transaction reporting and integration with national payment infrastructure. The focus on new energy vehicles and electric bus adoption is driving demand for terminals with low power consumption, reliable performance in varying temperatures, and integration with vehicle telematics systems. Domestic manufacturers benefit from local supply chains, competitive pricing structures, and customization capabilities for Chinese payment ecosystems and regulatory requirements including dual-mode offline/online transaction processing.
Revenue from vehicle-mounted payment terminals in India is expanding at a CAGR of 11.0% to reach USD 45.0 million by 2035, supported by government digitalization initiatives and transit modernization programs creating sustained demand for electronic fare collection solutions across metropolitan bus systems and state transportation corporations. The country’s rapid mobile payment adoption following demonetization and UPI infrastructure development is driving passenger expectations for digital payment options in public transportation.
State and municipal authorities are implementing automatic fare collection systems to reduce cash handling, improve revenue accountability, and enhance passenger convenience. The National Common Mobility Card initiative is creating opportunities for terminals that support interoperable payment across multiple transit operators and cities using unified payment credentials. Price sensitivity remains a key market characteristic, with operators favoring cost-effective terminal solutions that balance essential functionality with affordability for large-scale deployments. Domestic vendors are gaining traction by offering terminals tailored to Indian market requirements including support for low-denomination transactions, operation in extreme temperatures and dust conditions, and compatibility with locally developed payment platforms alongside international card schemes.
Demand for vehicle-mounted payment terminals in Germany is projected to grow at a CAGR of 10.1% by 2035, supported by the country's advanced public transportation infrastructure and stringent technical standards requiring sophisticated terminal solutions for seamless fare collection across integrated transportation networks. German transit operators are implementing terminals that support multi-operator ticketing, zone-based fare calculation, and real-time integration with journey planning systems providing passengers with optimal routing and pricing options.
The market is characterized by emphasis on data security, privacy compliance, and system reliability with operators requiring terminals certified to German and European payment industry standards. Payment Card Industry Data Security Standard compliance and General Data Protection Regulation adherence are non-negotiable requirements influencing vendor selection and terminal architecture. The transition to account-based ticketing and check-in/check-out fare collection models is driving demand for terminals with enhanced processing capabilities, secure customer data handling, and integration with backend systems for complex fare calculation and customer relationship management. Research and development programs are facilitating adoption of emerging technologies including biometric payment validation and blockchain-based fare settlement for cross-border transportation services.
Revenue from vehicle-mounted payment terminals in Brazil is growing at a CAGR of 9.2% by 2035, driven by urban transportation modernization programs and electronic fare collection mandates across major metropolitan regions including São Paulo, Rio de Janeiro, and Brasília. The country's established smart card transportation systems and growing mobile payment adoption are creating demand for terminals that support both contactless cards and QR code-based payments. Municipal and state authorities are upgrading aging fare collection infrastructure with modern terminals offering improved reliability, reduced maintenance costs, and enhanced revenue protection through tamper-proof designs and encrypted transaction processing.
The focus on operational efficiency is driving interest in terminals with offline transaction capability, allowing continued fare collection during network outages with subsequent synchronization when connectivity resumes. Operators are investing in terminals that support integration with transit priority systems, passenger information displays, and fleet management platforms for holistic operational visibility. Challenges include infrastructure limitations in secondary cities affecting real-time connectivity reliability and the need for terminals to withstand harsh operating conditions including high temperatures, humidity, and vehicle vibration.
Demand for vehicle-mounted payment terminals in Germany is projected to grow at a CAGR of 10.1% by 2035, supported by the country's advanced public transportation infrastructure and stringent technical standards requiring sophisticated terminal solutions for seamless fare collection across integrated transportation networks. German transit operators are implementing terminals that support multi-operator ticketing, zone-based fare calculation, and real-time integration with journey planning systems providing passengers with optimal routing and pricing options.
The market is characterized by emphasis on data security, privacy compliance, and system reliability with operators requiring terminals certified to German and European payment industry standards. Payment Card Industry Data Security Standard compliance and General Data Protection Regulation adherence are non-negotiable requirements influencing vendor selection and terminal architecture. The transition to account-based ticketing and check-in/check-out fare collection models is driving demand for terminals with enhanced processing capabilities, secure customer data handling, and integration with backend systems for complex fare calculation and customer relationship management. Research and development programs are facilitating adoption of emerging technologies including biometric payment validation and blockchain-based fare settlement for cross-border transportation services.
The vehicle-mounted payment terminal market in Europe is projected to grow from USD 822.4 million in 2025 to USD 1,847.3 million by 2035, registering a CAGR of 8.4% over the forecast period. Germany is expected to maintain its leadership position with a 31.2% market share in 2025, projected to expand to 32.8% by 2035, supported by its comprehensive public transportation networks and advanced fare collection systems across major metropolitan regions including Berlin, Hamburg, Munich, and Rhine-Ruhr. France follows with a 24.7% share in 2025, anticipated to reach 25.4% by 2035, driven by transit modernization programs in Paris, Lyon, Marseille, and regional transportation networks.
The United Kingdom holds a 21.3% share in 2025, expected to stabilize at 20.9% by 2035, with continued investments in contactless payment systems across London Transport and regional bus operators. Italy commands a 13.6% share, while Spain accounts for 8.9% in 2025. The Rest of Europe region is projected to maintain approximately 0.3% collectively through 2035, with Nordic countries, Netherlands, and Eastern European transit systems implementing modern payment terminal infrastructure as part of broader fare collection digitalization initiatives.
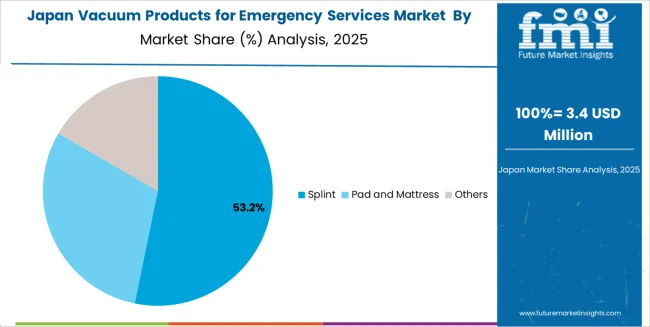
Japanese vehicle-mounted payment terminal operations reflect the country's emphasis on precision engineering and operational reliability. Major transit operators including Tokyo Metropolitan Bureau of Transportation, JR East, and regional bus companies maintain exacting terminal specifications requiring extensive testing protocols, comprehensive quality certifications, and proven durability under demanding operational conditions. Terminal qualification processes typically span 12-18 months including laboratory testing, field trials, and documentation reviews that create high barriers for international vendors but ensure exceptional system reliability.
The Japanese market demonstrates unique requirements for integration with proprietary transportation card systems including Suica, Pasmo, and ICOCA, requiring terminals to support FeliCa contactless technology standards alongside international payment schemes. Platform providers must demonstrate compatibility with complex fare structures including distance-based pricing, transfer discounts, and integration with retail payment applications where transportation cards function as general-purpose electronic money.
Regulatory oversight through the Ministry of Land, Infrastructure, Transport and Tourism emphasizes comprehensive security management with requirements for tamper detection, secure key management, and encrypted transaction processing exceeding international baseline standards. The focus on passenger convenience drives demand for terminals with rapid transaction processing, intuitive interfaces supporting elderly users, and multilingual capability for international visitors navigating Japan's transportation networks. Transit operators maintain long-term vendor relationships with emphasis on continuous improvement, proactive maintenance support, and technology roadmaps demonstrating evolution paths while maintaining backward compatibility with existing infrastructure investments.
South Korean vehicle-mounted payment terminal operations reflect the country's advanced technology adoption and government-led smart transportation initiatives. Major metropolitan transit systems in Seoul, Busan, and Incheon have implemented sophisticated fare collection infrastructure where terminals integrate seamlessly with T-money and Cashbee transportation card systems while supporting mobile payment applications and international contactless cards. Transit authorities maintain comprehensive technical specifications emphasizing real-time data integration, remote terminal management capabilities, and analytics-driven operational optimization.
The Korean market demonstrates particular strength in implementing cutting-edge payment technologies with early adoption of QR code payments, biometric authentication pilots, and blockchain-based fare settlement experiments. Regulatory frameworks through the Ministry of Land, Infrastructure and Transport emphasize interoperability standards requiring terminals to support multiple payment platforms and transportation operators through unified hardware architectures.
This creates advantages for vendors with experience developing flexible software platforms and managing complex certification processes across multiple payment schemes and transportation authorities. Transit operators increasingly pursue integrated procurement strategies seeking comprehensive solutions spanning terminal hardware, payment processing services, data analytics platforms, and ongoing technical support. The market environment emphasizes innovation with transit authorities actively collaborating with technology vendors on pilot programs testing emerging payment methods, demand-responsive fare structures, and integration with mobility-as-a-service platforms that combine public transit, bike sharing, and ride-hailing services into unified payment experiences.
The vehicle-mounted payment terminal market demonstrates consolidation around established payment technology providers and specialized transit solution vendors. Profit concentration occurs in comprehensive solution delivery combining terminal hardware, payment processing services, fare management software, and ongoing technical support into integrated offerings. Value migration favors vendors with proven deployment experience, payment industry certifications, and capabilities for customization to meet diverse regulatory requirements and fare structure complexity. Several competitive archetypes define market dynamics: established payment terminal manufacturers extending from retail into transit applications leveraging existing hardware platforms and payment network relationships; pure-play transit technology specialists focusing on transportation-specific requirements including ruggedized designs, fare calculation engines, and transit operator integration; regional vendors with localized expertise navigating domestic payment ecosystems and government procurement processes; and communication technology providers entering adjacent markets by bundling terminals with connectivity services.
Switching costs remain substantial with terminal replacements requiring vehicle installation, driver training, backend system reconfiguration, and payment scheme recertification that stabilize incumbent positions. However, technology evolution including open payment adoption and cloud-based architectures creates opportunities for agile vendors offering modern platforms with lower total cost of ownership and enhanced passenger experience capabilities. Market consolidation continues through acquisitions of specialized terminal vendors by larger payment technology companies and transit technology conglomerates seeking to expand product portfolios and geographic coverage. Procurement increasingly emphasizes total cost considerations including maintenance expenses, payment processing fees, and system upgrade paths rather than focusing solely on initial hardware costs, favoring vendors demonstrating operational efficiency gains and future-proof architectures supporting emerging payment methods and fare policies.
| Items | Values |
|---|---|
| Quantitative Units | USD 0.9 billion |
| Connectivity Type | 4G+Bluetooth, 5G+UWB, Others |
| Application | Urban Transportation, Shuttle Bus Attendance |
| Regions Covered | China, India, Germany, Brazil, United States, United Kingdom, Japan |
| Countries Covered | China, India, Germany, Brazil, United States, United Kingdom, Japan |
| Key Companies Profiled | Xiamen Lenz Communication, Magnetic North, Vcomcn, Guangdong Telpo, Shenzhen Emperor Technology, Beijing Watchdata, Hangzhou GOLONG Technology, Shenzhen Genvict Technologies, Cashway Fintech, USI Global, Xiamen Lanhe Electronics |
| Additional Attributes | Dollar sales by connectivity type and application, regional demand across key markets, competitive landscape, payment technology adoption patterns, fare collection system integration, and digital payment infrastructure development driving operational efficiency, revenue protection, and passenger experience enhancement |
By Connectivity Type
The global vehicle-mounted payment terminal market is estimated to be valued at USD 0.9 million in 2025.
The market size for the vehicle-mounted payment terminal market is projected to reach USD 2.1 million by 2035.
The vehicle-mounted payment terminal market is expected to grow at a 8.8% CAGR between 2025 and 2035.
The key product types in vehicle-mounted payment terminal market are 4g+bluetooth, 5g+uwb and others.
In terms of application, urban transportation segment to command 64.2% share in the vehicle-mounted payment terminal market in 2025.


Full Research Suite comprises of:
Market outlook & trends analysis
Interviews & case studies
Strategic recommendations
Vendor profiles & capabilities analysis
5-year forecasts
8 regions and 60+ country-level data splits
Market segment data splits
12 months of continuous data updates
DELIVERED AS:
PDF EXCEL ONLINE
Payment Analytics Software Market Size and Share Forecast Outlook 2025 to 2035
Payment Bank Solutions Market Size and Share Forecast Outlook 2025 to 2035
Payment Processing Solutions Market Size and Share Forecast Outlook 2025 to 2035
ePayment System Market Analysis by Component, Deployment, Enterprise Size, Industry, and Region through 2025 to 2035
B2B Payments Platform Market
Mobile Payment Transaction Market Analysis – Growth, Applications & Outlook 2025 to 2035
Crypto Payment Gateways Market Insights - Trends & Growth 2025 to 2035
Mobile Payment Data Protection Market Trends – Growth & Demand 2024-2034
Mobile Payment Security Market Insights – Growth & Demand 2024-2034
Secure & Seamless Digital Payments – AI-Powered Payment Gateways
Mobile Payment Technologies Market
Instant Payments Market Size and Share Forecast Outlook 2025 to 2035
The global QR code payment market Analysis – Size, Share, and Forecast Outlook 2025 to 2035
Outdoor Payment Terminal Market Size and Share Forecast Outlook 2025 to 2035
Biometric Payment Cards Market Size and Share Forecast Outlook 2025 to 2035
3D Secure Payment Authentication Market Insights by Components, Application, and Region - 2025 to 2035
Electronic Payment System For Transportation Market Size and Share Forecast Outlook 2025 to 2035
Smart Home Payments Market Size and Share Forecast Outlook 2025 to 2035
In Vehicles Payment Market Size and Share Forecast Outlook 2025 to 2035
Contactless Payment Market

Thank you!
You will receive an email from our Business Development Manager. Please be sure to check your SPAM/JUNK folder too.
Chat With
MaRIA