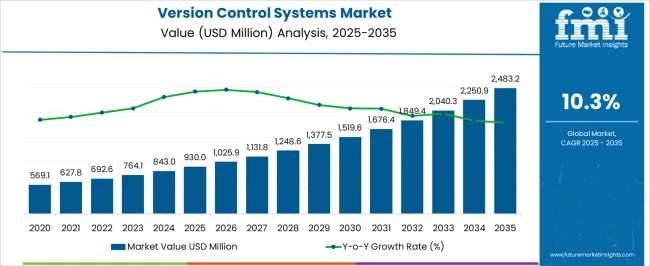
The Version Control Systems Market is estimated to be valued at USD 930.0 million in 2025 and is projected to reach USD 2483.2 million by 2035, registering a compound annual growth rate (CAGR) of 10.3% over the forecast period.
| Metric | Value |
|---|---|
| Version Control Systems Market Estimated Value in (2025 E) | USD 930.0 million |
| Version Control Systems Market Forecast Value in (2035 F) | USD 2483.2 million |
| Forecast CAGR (2025 to 2035) | 10.3% |
The version control systems market is expanding steadily as enterprises place stronger emphasis on collaborative development, secure code management, and streamlined workflows across distributed teams. The demand for these systems has accelerated with the rise of agile methodologies, DevOps adoption, and open source development practices.
Growing reliance on cloud based infrastructure and remote work models has further highlighted the need for real time code synchronization, integration, and scalability. Advancements in automation, CI CD pipelines, and integration with project management tools are enhancing operational efficiency and productivity.
Regulatory compliance and data security requirements are also contributing to wider deployment across industries. The outlook for this market remains positive as enterprises of all sizes continue to seek robust, scalable, and flexible solutions that can support faster release cycles and distributed development environments.
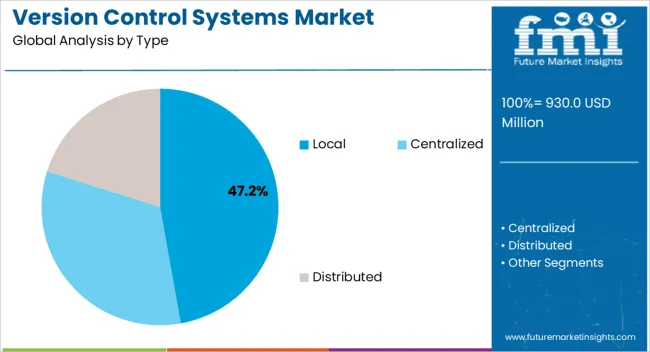
The local type segment is projected to account for 47.20% of the total revenue by 2025 within the type category, positioning it as a key contributor. This share is attributed to the control, security, and customization benefits offered by locally hosted systems, which are valued in industries with strict compliance mandates.
Local systems enable organizations to manage repositories without reliance on external networks, ensuring higher data confidentiality. They have also been preferred by teams requiring low latency and strong offline accessibility.
Despite the shift toward cloud solutions, the continued reliance on secure and customizable environments sustains the prominence of the local segment in the market.
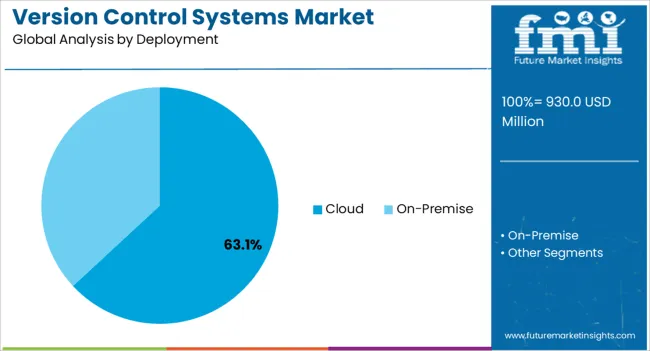
The cloud deployment segment is expected to contribute 63.10% of the market revenue by 2025, making it the leading deployment model. Growth has been driven by the increasing need for scalability, seamless collaboration, and cost effectiveness.
Cloud based platforms provide real time accessibility for globally distributed teams, ensuring that code updates, versioning, and project management are efficiently executed. Their subscription based models reduce infrastructure investment while enabling rapid scalability as project needs evolve.
Enhanced integrations with CI CD pipelines and project tracking tools have further strengthened their adoption. Consequently, the cloud segment has emerged as the dominant deployment approach, reflecting its alignment with modern development practices and remote work environments.
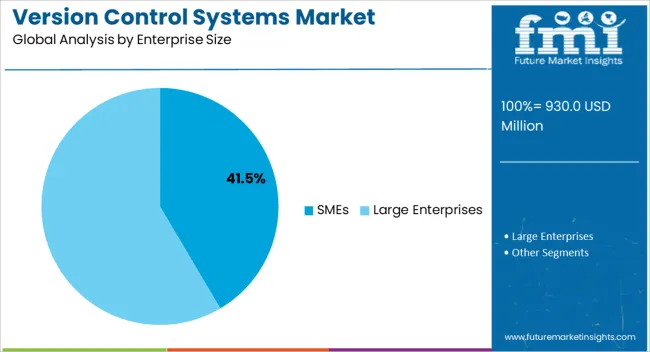
The SMEs segment is projected to hold 41.50% of total revenue by 2025 within the enterprise size category, highlighting its significant role in market expansion. Small and medium enterprises are adopting version control systems to streamline workflows, improve productivity, and manage collaborative development at lower costs.
Cloud based solutions have particularly enabled SMEs to access advanced features without heavy capital expenditure. The increasing adoption of agile methodologies, coupled with the need for faster delivery cycles, has amplified reliance on these systems.
Furthermore, SMEs have benefited from automation and integration capabilities, which reduce errors and enhance project efficiency. This has positioned SMEs as a dynamic growth segment within the version control systems market.
The global version control market size is estimated to be valued at USD 930 million in 2025. The demand for version control systems is expected to rise at a CAGR of 10.7% during the forecast period 2025 to 2035.
Version control systems functioning as standalone applications are now being integrated with various software offerings. This integration enables developers to use the enhanced features of a version control system and keep track of every change, as the file is in consideration.
Technological advancements have led to a transition towards automation and digitization to reduce associated human tasks and errors. The ease of operation and user-friendliness also reflect the high demand for the same. The high demand for automated software management and tracking tools is expected to drive the growth of the market on a global scale. The global version control systems market is anticipated to witness growth in revenue to USD 2483.2 billion by 2035.
Software development has emerged as the underlying enabler of digital transformation. The mounting demand for automation and digitization in the software development process, coupled with the increasing adoption of smartphones and tablets, is projected to drive the adoption of version control systems.
The increasing adoption of smartphones and tablets, and advancing technologies have resulted in increased spending on application development and deployment. Version control systems, being an integral component of the software development process will reflect a positive growth trajectory.
Companies operating in the version control systems market are delivering software solutions proactively, and are providing consultation services to help end-users maneuver through the ever-changing requirements.
With the deployment of the version control systems market, the companies operating in the market are helping software teams to collaborate and maintain the complete history of code changes. This allows developers to keep track of the modifications being made to the software modules.
Companies have been working with software development teams to cater to their customization demands aimed at meeting their frequently-changing industry-specific requirements.
According to the Future Market Insights analysis, the overall version control systems market spending in the United States alone is likely to increase at a rate of 10.1% between 2025 to 2035, with a market value of USD 930 million in 2025. According to the report, the United States was predicted to account for a market share of 24.7% in 2025.
The United States will emerge as the largest market for version control systems in North America, due to the strong presence of service providers like IBM, Microsoft, and Broadcom. This is attributed to the increase in demand for customized version control systems across different industry verticals.
Growing penetration of smartphones and the internet in the country also drive market growth. Growing demand for mobile apps and the rising necessity to manage diverse versions of these apps are anticipated to offer major growth opportunities to emerging and established players in the Version Control Systems market.
The version control systems market in Germany is anticipated to be valued at around USD 2483.2 million by 2035. In recent years, many SMEs in European countries including the United Kingdom, France, and Germany have adopted version control software solutions and services owing to the popularity of cloud-based solutions.
The market in Europe for software development services is on the rise. The shortage of skilled software developers is pushing European companies towards outsourcing their processes.
A huge gap between the number of available software developers and the number of software development jobs has been plaguing the region. In 2014, the EU Commission had foreseen a shortage of 900,000 IT professionals for 2024. However, in 2020, the EU Commission altered this estimate to a shortage of 500,000. Thereby, European countries happen to be a high-potential market for version control systems.
Moreover, the abundant benefits offered by version control systems, including interoperability, portability, and auditing, are expected to boost market growth. Furthermore, growing development teams in the region and increasing demand for collaborations for projects to accelerate the product delivery processes are likely to support growth. The version control market in Germany is anticipated to expand at a CAGR of 8.7% over the forecast period.
According to the FMI analysis, the market for version control systems in China is likely to grow at a CAGR of 10.5% between 2025 to 2035, with a market value of around USD 44.4 million in 2025.
China, Japan, and South Korea are creating potential growth opportunities for version control systems owing to the rising emphasis of software developers on minimizing the complexities involved in the process of software development.
In the wake of this pandemic, there has been an increase in demand for digitization to run businesses across the globe. Growing demand for automation is anticipated to fuel demand. Companies across China are focused on implementing digital technologies in order to resume business operations through 2025 and beyond.
The market in India is anticipated to reach USD 61.2 million by 2035. The demand for centralized and distributed version control systems has increased rapidly across various industry verticals in major economies of the South Asia and Pacific region including India and Australia, which has created key potential growth opportunities for the market.
Moreover, in India, there has been a steady growth in the adoption of version control systems in the fields of IT & telecom and BFSI. Open-source distributed version control systems are increasingly gaining popularity in the country, owing to their ease of application and free-of-cost features.
Open-source distributed version control systems permit developers to alter and develop the source code as per their requirements with no cost and are predominantly gaining popularity among individual software developers.
The demand for distributed version control systems is projected to show major growth as developers seek cost-efficient operations. Furthermore, rapid growth in the retail and healthcare sector is expected to drive the market. The version control market in India is anticipated to expand at a CAGR of 14.9% over the forecast period.
The market is segmented into local version control systems, centralized version control systems, and distributed version control systems. The Centralized Version Control System segment was expected to dominate the market with a share of 63.6% of the global market in 2025.
The growth can be attributed to the rising demand for cost-effective tools for development along with the increasing demand to minimize complexities in software development. There has been an increase in traction for distributed version control systems and the segment is expected to grow at the highest CAGR of 12.7%.
In terms of deployment, the market is segmented into cloud and on-premise variants. The cloud segment is expected to register the highest CAGR of 10.4% during the forecast period, while also creating an incremental opportunity of USD 930 million between 2025 to 2035.
Software development companies are primarily focused on the deployment of cloud-based version control systems as they allow companies to reduce overall operating costs. Additionally, the cloud-based deployment also offers additional services that are integrated with the source control system, helping developers to streamline their development process.
For example, cloud-based service providers provide issue tracking integrated with the source control systems, which allows developers to identify and track issues that primarily initiate during the development process.
In terms of enterprise size, the market is segmented into small and medium enterprises (SMEs) and large enterprises. The large enterprises segment is expected to hold the largest share of the market accounting for USD 930 million in 2025, while growing at a considerable CAGR of 9.9% between 2025 to 2035.
The growth of the segment can be primarily attributed to the growing need for better-quality solutions and an efficient development process in large enterprises. Furthermore, high investments in research and development activities also contribute to business productivity.
In terms of end-use industries, the market is segmented as BFSI, healthcare, IT & telecom, retail, education, and others. With the growing popularity of digitization and automation across all industries, there has been a rise in demand for version control software solutions.
The BFSI industry segment is dominating the global version control systems and it is estimated to account for 19% of the total market value share by the end of 2025. The growing demand for machine learning and artificial intelligence is expected to bolster the deployment of numerous applications and software in the BFSI and retail industry verticals. Version control systems play a crucial role in BFSI organizations.
These organizations rely on mobile and software applications in order to execute financial activities and customer queries. The high dependency on software shall require banks to upgrade various software applications.
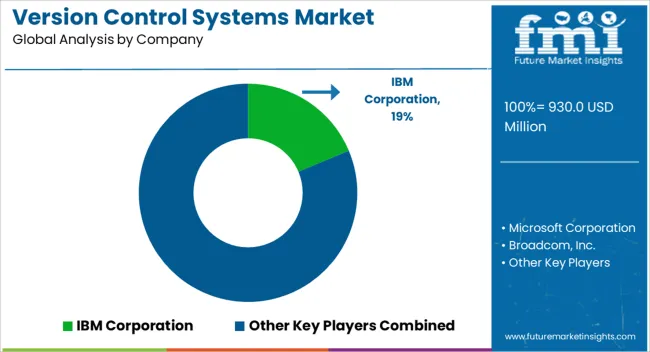
According to the Future Market Insights analysis, IBM, Microsoft, Broadcom, Micro Focus, Apache Software Foundation, Canonical, Git, Perforce Software, Mercurial, and Dynamsoft, are identified as key players in the version control systems landscape.
Companies manufacturing version control systems are aiming for product innovation and strategic partnerships with other software vendors to enhance their portfolios while addressing the demand of an expanding customer pool. The introduction of new products and strategic partnerships are key with the top players in the version control systems landscape.
| Report Attribute | Details |
|---|---|
| Growth Rate | CAGR of 10.3% from 2025 to 2035 |
| Market Value in 2025 | USD 930.0 million |
| Market Value in 2035 | USD 2483.2 million |
| Base Year for Estimation | 2025 |
| Historical Data | 2020 to 2025 |
| Forecast Period | 2025 to 2035 |
| Quantitative Units | Revenue in USD billion and CAGR from 2025 to 2035 |
| Report Coverage | Revenue Forecast, Company Ranking, Competitive Landscape, Growth Factors, Trends, and Pricing Analysis |
| Regions Covered | North America; Latin America; Europe; East Asia; South Asia; Oceania; Middle East & Africa |
| Key Countries Covered | United States, Canada, Brazil, Mexico, Germany, United Kingdom, France, Spain, Italy, India, Malaysia, Singapore, Thailand, China, Japan, South Korea, Australia, New Zealand, GCC Countries, South Africa, Israel |
| Key Segments Covered | Type, Deployment, Enterprise Size, Industry, Region |
| Key Companies Profiled | IBM Corporation; Microsoft Corporation; Broadcom, Inc.; Micro Focus; Apache Software Foundation; Canonical; GitHub; Perforce Software; Mercurial; BitMover Inc.; Codice Software; Dynamsoft |
| Customization & Pricing | Available upon Request |
The global version control systems market is estimated to be valued at USD 930.0 million in 2025.
The market size for the version control systems market is projected to reach USD 2,483.2 million by 2035.
The version control systems market is expected to grow at a 10.3% CAGR between 2025 and 2035.
The key product types in version control systems market are local, centralized and distributed.
In terms of deployment, cloud segment to command 63.1% share in the version control systems market in 2025.


Full Research Suite comprises of:
Market outlook & trends analysis
Interviews & case studies
Strategic recommendations
Vendor profiles & capabilities analysis
5-year forecasts
8 regions and 60+ country-level data splits
Market segment data splits
12 months of continuous data updates
DELIVERED AS:
PDF EXCEL ONLINE
Conversion Rate Optimization Software Market Size and Share Forecast Outlook 2025 to 2035
Data Conversion Services Market Size and Share Forecast Outlook 2025 to 2035
Vehicle Conversion Market Size and Share Forecast Outlook 2025 to 2035
Phosphate Conversion Coatings Market 2025 to 2035
Automotive Conversion Kit Market Growth - Trends & Forecast 2025 to 2035
Digital Power Conversion Market Report - Trends & Forecast 2025 to 2035
DNA Methylation Conversion Kit Market Size and Share Forecast Outlook 2025 to 2035
Control Room Solution Market Size and Share Forecast Outlook 2025 to 2035
Control Knobs for Panel Potentiometer Market Size and Share Forecast Outlook 2025 to 2035
Controlled-Release Drug Delivery Technology Market Size and Share Forecast Outlook 2025 to 2035
Controlled Environment Agriculture (CEA) Market Size and Share Forecast Outlook 2025 to 2035
Control Cable Market Size and Share Forecast Outlook 2025 to 2035
Control Towers Market Size and Share Forecast Outlook 2025 to 2035
Controlled & Slow Release Fertilizers Market 2025-2035
Controlled Intelligent Packaging Market
Biocontrol Solutions Market Size and Share Forecast Outlook 2025 to 2035
Biocontrol Agents Market Size and Share Forecast Outlook 2025 to 2035
Oil Control Shampoo Market Size and Share Forecast Outlook 2025 to 2035
LED Control Unit Market Size and Share Forecast Outlook 2025 to 2035
Sun Control Films Market Size and Share Forecast Outlook 2025 to 2035

Thank you!
You will receive an email from our Business Development Manager. Please be sure to check your SPAM/JUNK folder too.
Chat With
MaRIA