Reports

- Global Locations -

Headquarters

Future Market Insights, Inc.

Christiana Corporate, 200
Continental Drive, Suite 401,
Newark, Delaware - 19713,
United States

T: +1-845-579-5705

Americas

Future Market Insights, Inc.

616 Corporate Way, Suite 2-9018,
Valley Cottage, NY 10989, United States

T: +1-347-918-3531

MEA

Future Market Insights

1602-6 Jumeirah Bay X2 Tower, Plot No: JLT-PH2-X2A,
Jumeirah Lakes Towers, Dubai,
United Arab Emirates

Europe

Future Market Insights

3rd Floor, 207 Regent Street,
W1B 3HH London
United Kingdom

T: + 44 (0) 20 8123 9659
D: +44 (0) 20 3287 4268

Asia Pacific

Future Market Insights

Office No. 401-A, 4th Floor,
VANTAGE 9, S.No. 36/1/1,
Baner, Pune 411045, India

Weight Loss and Obesity Management Market

Weight Loss and Obesity Management Market Outlook (2022-2028)

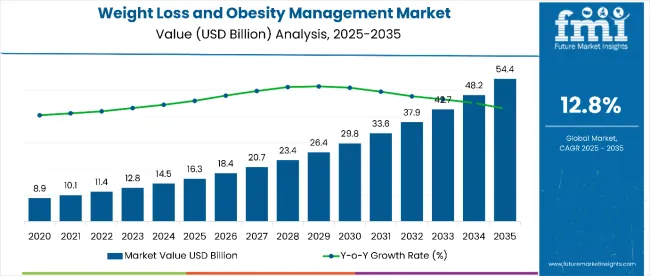
[276 Pages Report] The global weight loss and obesity management market will account for a net worth of US$ 3.68 Billion in 2022, and is predicted to rise at a CAGR of 5.2% over the forecast period to attain a valuation of US$ 4.99 Billion by 2028.

Attributes Details
Weight Loss and Obesity Management Market Size (2022) US$ 3.68 Billion
Sales Forecast (2028) US$ 4.99 Billion
Global Market Growth Rate (2022 to 2028) 5.2% CAGR
Share of Top 5 Market Players 50%

Weight loss and obesity management accounted for 40.9% share of the global obesity treatment market revenue in 2021.

Don't pay for what you don't need

Customize your report by selecting specific countries or regions and save 30%!

How The Market Progressed Till June 2022?

Particulars Details
H1, 2021 5.17%
H1, 2022 Projected 5.18%
H1, 2022 Outlook 4.78%
BPS Change - H1, 2022 (O) - H1, 2022 (P) (-) 40 ↓
BPS Change - H1, 2022 (O) - H1, 2021 (-) 39 ↓

H1-2022 outlook period in comparison to H1-2022 projected period showed a negative growth in terms of Basis Point Share by 40 BPS. In H1-2022 when compared with H1-2021, the market growth rate of weight loss and obesity management is expected to fall by 39 basis point share (BPS), as per FMI analysis.

The decline in the BPS values is associated with several product and device recalls due to the adverse effects associated with their use. Moreover, limitations in drug therapies for obesity and weight loss such as frequent obesity relapse, has further contributed to the decline in the BPS values.

However, recent approvals from the FDA for semaglutide injections for weight loss and obesity management will propose a positive outlook towards market growth during the forecasted years.

The market is subject to device regulations, product recalls, licencing requirements, and patient safety guidelines, as per the industry and macroeconomic factors. Key developments in the market include the incorporation of endoluminal techniques to treat obesity. This method is as effective as surgical interventions for the management of weight loss and obesity.

Revenue Analysis Of Weight Loss And Obesity Management From 2013 To 2021 Vs Future Market Outlook For 2022 To 2028

“Increasing Prevalence of Obesity & Associated Lifestyle Diseases Driving Market Growth”

From 2013 to 2021, the global weight loss and obesity management market experienced a CAGR of around 4.8%.

The weight loss and obesity management products market covers various product forms such as devices and drugs that are used for managing or reducing weight in obese and overweight patients. Rising global burden of obesity and overweight is driving the need for preventive care.

Obese people are more likely to develop chronic conditions like diabetes, hypertension, and orthopedic problems. As a result, increased awareness of weight-loss procedures is propelling the market forward. Moreover, people are becoming more health-conscious and embracing meal replacements and exercise regimens in order to keep fit and healthy. This is one of the major reasons driving the weight management market growth.

Weight Loss and Obesity Management Market

Other factors driving market expansion include rising disposable incomes and consumer spending power, as well as the emergence of gym culture and an increase in the use of dietary supplements.

The global weight loss and obesity management systems market is anticipated to expand at a 5.2% CAGR from 2022 to 2028.

What Key Factors Are Bolstering Demand For Weight Loss And Obesity Management Products?

“Emergence of New Technologies & Therapies Assisting Market Growth”

  • New Product Launches for Weight Loss and Obesity Management Continue to Extend Drug Pipeline

Various big pharmaceutical companies are developing novel anti-obesity drugs for weight loss and obesity management. Obesity is now the most investigated indication by the number of clinical trials. The obesity drugs pipeline consists of 94 trials across all stages of clinical development.

  • Government Initiatives Support Efforts to Tackle Obesity

Government organizations serve numerous vital functions in a national public health crisis, including the childhood obesity epidemic. It provides leadership by responding to prevalent obesity as an urgent public health priority and coordinating the public and private sector response.

Despite government policy responses and greater individual responsibility, global obesity levels look set to keep rising. Government regulations and taxes might increase awareness of weight management and put pressure on food and beverage companies to reduce the calorific value of their products.

Sabyasachi Ghosh
Sabyasachi Ghosh

Principal Consultant

Talk to Analyst

Find your sweet spots for generating winning opportunities in this market.

What Challenges Do Weight Loss And Obesity Management Device Suppliers Face?

“Side Effects of Drugs & Other Risks Associated with Weight Loss Surgeries to Obstruct Demand for Surgical Equipment”

It has been proven that bariatric surgery is more effective in terms of cost and treatment than other pharmaceutical interventions for weight loss and obesity management. However, this proven effectiveness is typically associated with certain risks that cannot be understated. Some of the major risks associated are excessive bleeding, infections, blood clots, low blood sugar, and malnutrition.

High cost involved in the R&D of obesity drugs is a great challenge for the growth of the market. Side effects of drugs and risks associated with surgeries may hamper the growth of the global weight loss management market during the forecast period.

Which Region Is Becoming An Attractive Market For Weight Loss And Obesity Management Device Manufacturers?

“Rising Initiatives for Healthy Lifestyles Driving Market Growth in North America”

North America is expected to account 43% share of the weight loss and obesity management market in 2022. Major factors boosting the market growth in the region include the rising prevalence of obesity and chronic diseases, favorable government initiatives about nutrition and healthy lifestyles, a growing number of fitness centers, and a rise in disposable income.

Growing awareness about obesity management in the population and the presence of major drug manufacturers are driving the market growth in North America.

Get the data you need at a Fraction of the cost

Personalize your report by choosing insights you need
and save 40%!

Country-Wise Analysis

Why is Demand for Weight Loss and Obesity Management Products Constantly Increasing in the U.S.?

“Rapid Adoption of Weight Loss Management Services to Augment Market Growth”

Rising investments & collaborations in weight loss and obesity management business, rising disposable incomes coupled with changing lifestyles due to rapid urbanization, and commercial availability of liposuction devices are the factors driving market expansion in the U.S.

Increasing incidences of hypertension & diabetes and high adoption of weight loss management services are expected to drive the market growth in the U.S. over the coming years.

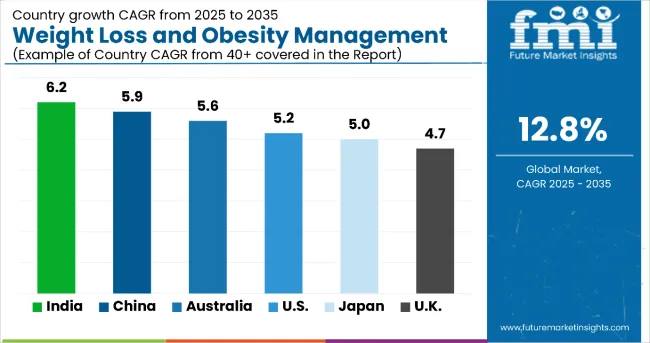
How is India Contributing to Weight Loss and Obesity Management Market Growth?

“Growing Medical Tourism Driving Market Expansion in India”

Obesity management is an evolving area of focus, which has been witnessing an upsurge in demand, due to the increasing medical tourism in India.

Rising medical tourism for weight loss and obesity management in India provides immense opportunities for the weight loss and obesity management market players to launch products that would further contribute to driving the growth of the global weight loss and obesity management market.

Category-Wise Insights

Which Product Type is Gaining Immense Popularity in Weight Loss and Obesity Management?

“Increasing Number of Bariatric Surgeries Driving Demand for Bariatric Stapling Devices”

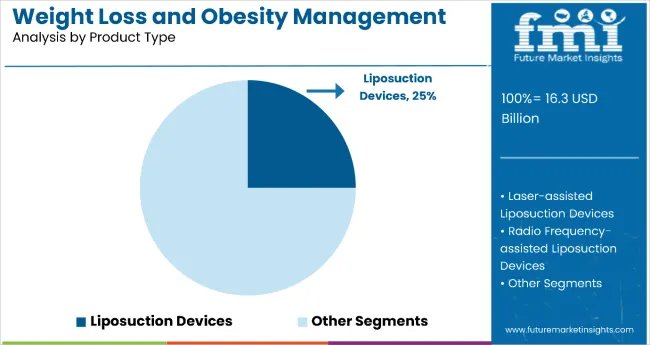
After eating, exercise, and other medically advised weight loss programs failed, bariatric procedures/weight loss surgeries were once thought to be the last option for weight loss. Bariatric stapling devices type USD share will increase significantly in the global weight loss and obesity management market.

Many bariatric stapling devices are being used for bariatric surgeries, which help in controlling hunger by electrically stimulating the nerves that control our hunger signals. Bariatric operations have become less painful for patients as a result of recent innovations.

As a result, the medical profession is increasingly accepting these surgeries as a viable and long-lasting alternative to traditional weight-loss methods. Hence bariatric stapling devices are in more demand.

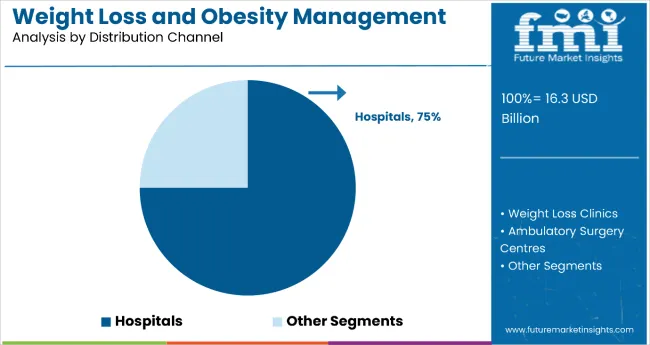
Which Distribution Channel Leads Revenue Generation of Weight Loss and Obesity Management?

“Online Sales Most Preferred Because of Easy Availability of Products”

By distribution channel, the online sales channel USD is expected to gain the largest share over the coming years. The rate of internet penetration has risen dramatically during the last several years around the world. According to reports, over 54% of the world's population has internet connections.

As a result, the weight reduction and weight management business have seen an increase in the use of digital services. Obesity has become a major concern worldwide as meal replacements and exercise are inadequate for weight loss and obesity management.

Sometimes targeted treatments must be combined with additional pharmacologic therapy drugs. The easy availability of drugs, high-quality food, and dietary supplements are driving the demand for online sales channels.

COVID-19 Impact On Industry

The COVID-19 pandemic has had a severe impact on the market. Weight loss and obesity management products suffered a drop in sales during the pandemic, according to the medical device industry. Because of the growing COVID-19 infection, hospitals have postponed or rescheduled non-essential surgical and non-invasive procedures.

Demand for fitness equipment has surged as individuals have become more health-conscious. Technological platforms and solutions are being implemented to handle rising consumer demand, change consumer behavior, and improve supply chains and raw material sourcing. The market is stabilizing and appears to have the most potential for growth over the coming years.

Competitive Landscape

Key weight loss and obesity management equipment manufacturers are taking a few to hold a competitive edge in the market. Companies are focusing on launching advanced surgical equipment and training equipment, which is propelling the global weight loss and obesity treatment market forward.

For instance,

  • In May 2021, according to conclusions of a Phase IIIa research published, Novo Nordisk's weight-loss medicine semaglutide can increase physical function and well-being in obese persons.

Weight Loss And Obesity Management Industry Report Scope

Attributes Details
Forecast Period 2022 to 2028
Historical Data Available for 2013 to 2021
Market Analysis Value in US$ Million
Key Regions Covered
  • North America
  • Latin America
  • Europe
  • East Asia
  • South Asia & Pacific
  • Middle East & Africa (MEA)
Key Countries Covered
  • USA
  • Canada
  • Mexico
  • Brazil
  • Mexico
  • Argentina
  • Germany
  • Italy
  • France
  • UK
  • Nordic
  • Spain
  • Japan
  • China
  • India
  • Malaysia
  • Thailand
  • Australia
  • GCC Countries
  • South Africa
  • Turkey
Key Market Segments Covered
  • Product Type
  • Distribution Channel
  • Region
Key Companies Profiled
  • GlaxoSmithKline plc.
  • Allergan Plc
  • Johnson & Johnson Services, Inc.
  • Vivus Inc.
  • Eisai Co., Ltd.
  • ReShape Lifesciences, Inc.
  • Aspire Bariatrics
  • Allurion Technologies Inc.
  • Cheplapharm Arzneimittel GmbH
  • Beijing Noble Laser Technology Co., Ltd.
Pricing Available upon Request

Key Segments Of Weight Loss And Obesity Management Industry Survey

Weight Loss and Obesity Management Market by Product Type:

  • Weight Loss and Obesity Management Devices
    • Liposuction Devices
    • Laser-assisted Liposuction Devices
    • Radio Frequency-assisted Liposuction Devices
    • Ultrasound-assisted Liposuction Devices
    • Bariatric Stapling Devices
    • Gastric Bands
    • Gastric Balloon Systems
    • Gastric Emptying Systems
    • Gastric Electrical Stimulation Systems
  • Weight Loss and Obesity Management Drugs
    • GLP-1 Receptor Agonists
    • Lipase Inhibitors
    • Serotonin Receptor Agonists
    • Combination Drugs
    • Others

Weight Loss and Obesity Management Market by Distribution Channel:

  • Institutional Sales
    • Hospitals
    • Weight Loss Clinics
    • Ambulatory Surgery Centers
  • Retail Sales
    • Retail Pharmacies
    • Drug Stores
    • Online Sales

Weight Loss and Obesity Management Market by Region:

  • North America Weight Loss and Obesity Management Market
  • Latin America Weight Loss and Obesity Management Market
  • Europe Weight Loss and Obesity Management Market
  • East Asia Weight Loss and Obesity Management Market
  • South Asia & Pacific Weight Loss and Obesity Management Market
  • Middle East & Africa (MEA) Weight Loss and Obesity Management Market

Frequently Asked Questions

North America accounts for 43% share of the global weight loss and obesity management market.

GlaxoSmithKline plc., Allergan Plc, Johnson & Johnson Services, Inc., Vivus Inc., and Eisai Co., Ltd. are top providers of weight loss and obesity management systems.

The global market for weight loss and obesity management is expected to reach a valuation of US$ 3.68 Bn in 2022.

Increasing obese population, rising number of bariatric surgeries, and growing adoption of online weight loss and weight management programs are driving market growth.

The global weight loss and obesity management market is expected to rise at a CAGR of 5.2% from 2022 to 2028 to reach US$ 4.99 Bn by 2028.

Table of Content

1. Executive Summary

      1.1. Global Market Outlook

      1.2. Demand Side Trends

      1.3. Supply Side Trends

      1.4. Analysis and Recommendations

2. Market Overview

      2.1. Market Coverage / Taxonomy

      2.2. Market Definition / Scope / Limitations

3. Key Success Factors

      3.1. Regulatory Scenario

      3.2. Pipeline Assessment

      3.3. Potential of Anti-Obesity Drugs In The Market

      3.4. Key Market Entry Strategies

      3.5. White Space Analysis

4. Global Market - Pricing Analysis

      4.1. Regional Pricing Analysis By Product Type

      4.2. Pricing Break-up

             4.2.1. Manufacturer Level Pricing

             4.2.2. Distributor Level Pricing

      4.3. Global Average Pricing Analysis Benchmark

5. Global Market Demand (in Value or Size in US$ Mn) Analysis 2013-2021 and Forecast, 2022-2028

      5.1. Historical Market Value (US$ Mn) Analysis, 2013-2021

      5.2. Current and Future Market Value (US$ Mn) Projections, 2022-2028

             5.2.1. Y-o-Y Growth Trend Analysis

             5.2.2. Absolute $ Opportunity Analysis

6. Market Background

      6.1. Macro-Economic Factors

             6.1.1. Increasing Investments Towards Obesity Treatment 

             6.1.2. Global Increase In Healthcare Spending

             6.1.3. Shift Towards A Value-Based Healthcare Model

      6.2. Forecast Factors - Relevance & Impact

             6.2.1. New/Approved Product Launches

             6.2.2. Treatment Rate

             6.2.3. Prevalence of Obesity

             6.2.4. Technological Advancements

             6.2.5. Acceptance of Drugs by Prescribers

             6.2.6. Reimbursement Policies 

             6.2.7. Product Penetration Rate Across End Users

             6.2.8. Adoption Rate among Patients

             6.2.9. Product Penetration across Regions

             6.2.10. Penetration of Product in Different Distribution Channel

      6.3. Value Chain

      6.4. Market Dynamics

             6.4.1. Drivers

             6.4.2. Restraints

             6.4.3. Opportunity Analysis

7. Global Market Analysis 2013-2021 and Forecast 2022-2028, by Product Type 

      7.1. Introduction / Key Findings

      7.2. Historical Market Size (US$ Mn) Analysis By Product Type, 2013 - 2021

      7.3. Current and Future Market Size (US$ Mn) and Volume Analysis and Forecast By Product Type, 2022 - 2028

             7.3.1. Devices

                      7.3.1.1. Liposuction Device

                                 7.3.1.1.1. Laser Assisted Liposuction Devices

                                 7.3.1.1.2. Radio Frequency Assisted Liposuction Devices

                                 7.3.1.1.3. Ultrasound Assisted Liposuction Devices

                      7.3.1.2. Bariatric Stapling Devices

                      7.3.1.3. Gastric Band

                      7.3.1.4. Gastric Balloon Systems

                      7.3.1.5. Gastric Emptying Systems

                      7.3.1.6. Gastric Electrical Stimulation Systems

             7.3.2. Drugs

                      7.3.2.1. GLP-1 receptor agonists

                      7.3.2.2. Lipase Inhibitors

                      7.3.2.3. Serotonin Receptor Agonist

                      7.3.2.4. Combination Drug

                      7.3.2.5. Others

      7.4. Market Attractiveness Analysis By Product Type

8. Global Market Analysis 2013-2021 and Forecast 2022-2028, by Distribution Sales

      8.1. Introduction / Key Findings

      8.2. Historical Market Size (US$ Mn) Analysis By Distribution Sales, 2013 - 2021

      8.3. Current and Future Market Size (US$ Mn) Analysis and Forecast By Distribution Sales, 2022 - 2028

             8.3.1. Institutional Sales 

                      8.3.1.1. Hospitals

                      8.3.1.2. Weightloss Clinics

                      8.3.1.3. Ambulatory Surgery Centers

             8.3.2. Retail Sales

                      8.3.2.1. Retail Pharmacies

                      8.3.2.2. Drug Stores

                      8.3.2.3. Online Sales

      8.4. Market Attractiveness Analysis By Distribution Sales

9. Global Market Analysis 2013-2021 and Forecast 2022-2028, by Region

      9.1. Introduction

      9.2. Historical Market Size (US$ Mn) Analysis By Region, 2013 - 2021

      9.3. Current Market Size (US$ Mn) Analysis and Forecast By Region, 2022 - 2028

             9.3.1. North America

             9.3.2. Latin America

             9.3.3. Europe

             9.3.4. Middle East and Africa (MEA)

             9.3.5. East Asia

             9.3.6. South Asia

             9.3.7. Oceania

      9.4. Market Attractiveness Analysis By Region

10. North America Market Analysis 2013-2021 and Forecast 2022-2028

      10.1. Introduction

      10.2. Historical Market Size (US$ Mn) and Volume Trend Analysis By Market Taxonomy, 2013 - 2021

      10.3. Market Size (US$ Mn) and Volume Forecast By Market Taxonomy, 2022 - 2028

             10.3.1. By Country

                      10.3.1.1. U.S.

                      10.3.1.2. Canada

             10.3.2. By Product Type

             10.3.3. By Distribution Sales

      10.4. Market Attractiveness Analysis

             10.4.1. By Country

             10.4.2. By Product Type

             10.4.3. By Distribution Sales

      10.5. Drivers and Restraints - Impact Analysis

11. Latin America Market Analysis 2013-2021 and Forecast 2022-2028

      11.1. Introduction

      11.2. Historical Market Size (US$ Mn) and Volume Trend Analysis By Market Taxonomy, 2013 - 2021

      11.3. Market Size (US$ Mn) and Volume Forecast By Market Taxonomy, 2022 - 2028

             11.3.1. By Country

                      11.3.1.1. Brazil

                      11.3.1.2. Mexico

                      11.3.1.3. Rest of Latin America

             11.3.2. By Product Type

             11.3.3. By Distribution Sales

      11.4. Market Attractiveness Analysis

             11.4.1. By Country

             11.4.2. By Product Type

             11.4.3. By Distribution Sales

      11.5. Drivers and Restraints - Impact Analysis

12. Europe Market Analysis 2013-2021 and Forecast 2022-2028

      12.1. Introduction

      12.2. Historical Market Size (US$ Mn) and Volume Trend Analysis By Market Taxonomy, 2013 - 2021

      12.3. Market Size (US$ Mn) and Volume Forecast By Market Taxonomy, 2022 - 2028

             12.3.1. By Country

                      12.3.1.1. Germany

                      12.3.1.2. Italy

                      12.3.1.3. France

                      12.3.1.4. U.K.

                      12.3.1.5. Spain

                      12.3.1.6. Russia

                      12.3.1.7. Rest of Europe

             12.3.2. By Product Type

             12.3.3. By Distribution Sales

      12.4. Market Attractiveness Analysis

             12.4.1. By Country

             12.4.2. By Product Type

             12.4.3. By Distribution Sales

     12.5. Drivers and Restraints - Impact Analysis

13. South Asia Market Analysis 2013-2021 and Forecast 2022-2028

      13.1. Introduction

      13.2. Historical Market Size (US$ Mn) and Volume Trend Analysis By Market Taxonomy, 2013 - 2021

      13.3. Market Size (US$ Mn) and Volume Forecast By Market Taxonomy, 2022 - 2028

             13.3.1. By Country

                      13.3.1.1. India

                      13.3.1.2. Thailand

                      13.3.1.3. Indonesia

                      13.3.1.4. Malaysia

                      13.3.1.5. Rest of South Asia

             13.3.2. By Product Type

             13.3.3. By Distribution Sales

      13.4. Market Attractiveness Analysis

             13.4.1. By Country

             13.4.2. By Product Type 

             13.4.3. By Distribution Sales

      13.5. Drivers and Restraints - Impact Analysis

14. East Asia Market Analysis 2013-2021 and Forecast 2022-2028

      14.1. Introduction

      14.2. Historical Market Size (US$ Mn) and Volume Trend Analysis By Market Taxonomy, 2013 - 2021

      14.3. Market Size (US$ Mn) and Volume Forecast By Market Taxonomy, 2022 - 2028

             14.3.1. By Country

                      14.3.1.1. China

                      14.3.1.2. Japan

                      14.3.1.3. South Korea

             14.3.2. By Product Type

             14.3.3. By Distribution Sales

      14.4. Market Attractiveness Analysis

             14.4.1. By Country

             14.4.2. By Product Type

             14.4.3. By Distribution Sales

      14.5. Drivers and Restraints - Impact Analysis

15. Oceania Market Analysis 2013-2021 and Forecast 2022-2028

      15.1. Introduction

      15.2. Historical Market Size (US$ Mn) and Volume Trend Analysis By Market Taxonomy, 2013 - 2021

      15.3. Market Size (US$ Mn) and Volume Forecast By Market Taxonomy, 2022 - 2028

             15.3.1. By Country

                      15.3.1.1. Australia

                      15.3.1.2. New Zealand

             15.3.2. By Product Type

             15.3.3. By Distribution Sales

      15.4. Market Attractiveness Analysis

             15.4.1. By Country

             15.4.2. By Product Type

             15.4.3. By Distribution Sales

      15.5. Drivers and Restraints - Impact Analysis

16. Middle East and Africa Market Analysis 2013-2021 and Forecast 2022-2028

      16.1. Introduction

      16.2. Historical Market Size (US$ Mn) and Volume Trend Analysis By Market Taxonomy, 2013 - 2021

      16.3. Market Size (US$ Mn) and Volume Forecast By Market Taxonomy, 2022 - 2028

             16.3.1. By Country

                      16.3.1.1. GCC Countries

                      16.3.1.2. Turkey

                      16.3.1.3. South Africa

                      16.3.1.4. Rest of Middle East and Africa

             16.3.2. By Product Type

             16.3.3. By Distribution Sales

      16.4. Market Attractiveness Analysis

             16.4.1. By Country

             16.4.2. By Product Type

             16.4.3. By Distribution Sales

      16.5. Drivers and Restraints - Impact Analysis

17. Emerging Countries Market Analysis 2013-2021 and Forecast 2022-2028

      17.1. Introduction

             17.1.1. Market Value Proportion Analysis, By Key Countries

             17.1.2. Global Vs. Country Growth Comparison

      17.2. China Market Analysis

             17.2.1. Introduction

             17.2.2. Market Value Proportion Analysis by Market Taxonomy

             17.2.3. Market Value (US$ Mn) Analysis and Forecast by Market Taxonomy

                      17.2.3.1. By Product Type

                      17.2.3.2. By Distribution Sales

             17.2.4. China Market - Competition Landscape

      17.3. India Market Analysis

             17.3.1. Introduction

             17.3.2. Market Value Proportion Analysis by Market Taxonomy

             17.3.3. Market Value (US$ Mn) Analysis and Forecast by Market Taxonomy

                      17.3.3.1. By Product Type

                      17.3.3.2. By Distribution Sales

             17.3.4. India Market - Competition Landscape

      17.4. Brazil Market Analysis

             17.4.1. Introduction

             17.4.2. Market Value Proportion Analysis by Market Taxonomy

             17.4.3. Market and Value (US$ Mn) Analysis and Forecast by Market Taxonomy

                      17.4.3.1. By Product Type

                      17.4.3.2. By Distribution Sales

             17.4.4. Mexico Market - Competition Landscape

18. Market Structure Analysis

      18.1. Brand Share Analysis of Top Players

19. Competition Analysis

      19.1. Competition Dashboard

      19.2. Competition Benchmarking

      19.3. Competition Deep Dive

             19.3.1. Novo Nordisk A/S 

                      19.3.1.1. Overview

                      19.3.1.2. Product Portfolio

                      19.3.1.3. Profitability by Market Segments (Product/Channel/Region)

                      19.3.1.4. Sales Footprint

                      19.3.1.5. Strategy Overview

                                 19.3.1.5.1. Marketing Strategy

                                 19.3.1.5.2. Product Strategy

                                 19.3.1.5.3. Channel Strategy

             19.3.2. GlaxoSmithKline plc. 

             19.3.3. F. Hoffmann-La Roche AG

             19.3.4. Allergan Plc

             19.3.5. Johnson & Johnson Services, Inc

             19.3.6. Medtronic plc.

             19.3.7. Vivus Inc.

             19.3.8. Eisai Co., Ltd.

             19.3.9. ReShape Lifesciences, Inc.

             19.3.10. Obalon Therapeutics

             19.3.11. Aspire Bariatrics

             19.3.12. Allurion Technologies Inc.

             19.3.13. Nalpropion Pharmaceuticals, Inc.

             19.3.14. Cheplapharm Arzneimittel GmbH

             19.3.15. Beijing Noble Laser Technology Co., Ltd

20. Assumptions and Acronyms Used

21. Research Methodology

Don't pay for what you don't need

Customize your report by selecting specific countries or regions and save 30%!

List of Tables

Table 01: Pipeline Assessment of Drugs for Obesity (1/13)

Table 02: Pipeline Assessment of Drugs for Obesity (2/13)

Table 03: Pipeline Assessment of Drugs for Obesity (3/13)

Table 04: Pipeline Assessment of Drugs for Obesity (4/13)

Table 05: Pipeline Assessment of Drugs for Obesity (5/13)

Table 06: Pipeline Assessment of Drugs for Obesity (6/13)

Table 07: Pipeline Assessment of Drugs for Obesity (7/13)

Table 08: Pipeline Assessment of Drugs for Obesity (8/13)

Table 09: Pipeline Assessment of Drugs for Obesity (9/13)

Table 10: Pipeline Assessment of Drugs for Obesity (10/13)

Table 11: Pipeline Assessment of Drugs for Obesity (11/13)

Table 12: Pipeline Assessment of Drugs for Obesity (12/13)

Table 13: Pipeline Assessment of Drugs for Obesity (13/13)

Table 14: Price (US$) Comparison of Medical Procedures for Weight Loss in Different Countries, 2022

Table 15: Global Market Size (US$ Mn) Analysis 2013-2021 and Forecast 2022-2028, By Product Type (1/2)

Table 16: Global Market Size (US$ Mn) Analysis 2013-2021 and Forecast 2022-2028, By Product Type (2/2)

Table 17: Global Market Volume (Units) Analysis 2013-2021 and Forecast 2022-2028, By Product Type

Table 18: Global Market Size (US$ Mn) Analysis 2013-2021 and Forecast 2022-2028, By Distribution Sales

Table 19: Global Market Size (US$ Mn) Analysis 2013-2021 and Forecast 2022-2028, By Region

Table 20: North America Market Size (US$ Mn) Analysis 2013-2021 and Forecast 2022-2028, By Country

Table 21: North America Market Size (US$ Mn) Analysis 2013-2021 and Forecast 2022-2028, By Product Type (1/2)

Table 22: North America Market Size (US$ Mn) Analysis 2013-2021 and Forecast 2022-2028, By Product Type (2/2)

Table 23: North America Market Volume (Units) Analysis 2013-2021 and Forecast 2022-2028, By Product

Table 24: North America Market Size (US$ Mn) Analysis 2013-2021 and Forecast 2022-2028, By Distribution Sales

Table 25: Latin America Market Size (US$ Mn) Analysis 2013-2021 and Forecast 2022-2028, By Country

Table 26: Latin America Market Size (US$ Mn) Analysis 2013-2021 and Forecast 2022-2028, By Product Type (1/2)

Table 27: Latin America Market Size (US$ Mn) Analysis 2013-2021 and Forecast 2022-2028, By Product Type (2/2)

Table 28: Latin America Market Volume (Units) Analysis 2013-2021 and Forecast 2022-2028, By Product Type

Table 29: Latin America Market Size (US$ Mn) Analysis 2013-2021 and Forecast 2022-2028, By Distribution Sales

Table 30: Europe Market Size (US$ Mn) Analysis 2013-2021 and Forecast 2022-2028, By Country

Table 31: Europe Market Size (US$ Mn) Analysis 2013-2021 and Forecast 2022-2028, By Product Type (1/2)

Table 32: Europe Market Size (US$ Mn) Analysis 2013-2021 and Forecast 2022-2028, By Product Type (2/2)

Table 33: Europe Market Volume (Units) Analysis 2013-2021 and Forecast 2022-2028, By Product Type

Table 34: Europe Market Size (US$ Mn) Analysis 2013-2021 and Forecast 2022-2028, By Distribution Sales

Table 35: South Asia Market Size (US$ Mn) Analysis 2013-2021 and Forecast 2022-2028, By Country

Table 36: South Asia Market Size (US$ Mn) Analysis 2013-2021 and Forecast 2022-2028, By Product Type (1/2)

Table 37: South Asia Market Size (US$ Mn) Analysis 2013-2021 and Forecast 2022-2028, By Product Type (2/2)

Table 38: South Asia Market Volume (Units) Analysis 2013-2021 and Forecast 2022-2028, By Product Type

Table 39: South Asia Market Size (US$ Mn) Analysis 2013-2021 and Forecast 2022-2028, By Distribution Sales

Table 40: East Asia Market Size (US$ Mn) Analysis 2013-2021 and Forecast 2022-2028, By Country

Table 41: East Asia Market Size (US$ Mn) Analysis 2013-2021 and Forecast 2022-2028, By Product Type (1/2)

Table 42: East Asia Market Size (US$ Mn) Analysis 2013-2021 and Forecast 2022-2028, By Product Type (2/2)

Table 43: East Asia Market Volume (Units) Analysis 2013-2021 and Forecast 2022-2028, By Product Type

Table 44: East Asia Market Size (US$ Mn) Analysis 2013-2021 and Forecast 2022-2028, By Distribution Sales

Table 45: Oceania Market Size (US$ Mn) Analysis 2013-2021 and Forecast 2022-2028, By Country

Table 46: Oceania Market Size (US$ Mn) Analysis 2013-2021 and Forecast 2022-2028, By Product Type (1/2)

Table 47: Oceania Market Size (US$ Mn) Analysis 2013-2021 and Forecast 2022-2028, By Product Type (2/2)

Table 48: Oceania Market Volume (Units) Analysis 2013-2021 and Forecast 2022-2028, By Product Type

Table 49: Oceania Market Size (US$ Mn) Analysis 2013-2021 and Forecast 2022-2028, By Distribution Sales

Table 50: Middle East & Africa Market Size (US$ Mn) Analysis 2013-2021 and Forecast 2022-2028, By Country

Table 51: Middle East & Africa Market Size (US$ Mn) Analysis 2013-2021 and Forecast 2022-2028, By Product Type (1/2)

Table 52: Middle East & Africa Market Size (US$ Mn) Analysis 2013-2021 and Forecast 2022-2028, By Product Type (2/2)

Table 53: Middle East & Africa Market Volume (Units) Analysis 2013-2021 and Forecast 2022-2028, By Product Type

Table 54: Middle East & Africa Market Size (US$ Mn) Analysis 2013-2021 and Forecast 2022-2028, By Distribution Sales

Table 55: China Market Size (US$ Mn) Analysis 2013-2021 and Forecast 2022-2028, By Product Type (1/2)

Table 56: China Market Size (US$ Mn) Analysis 2013-2021 and Forecast 2022-2028, By Product Type (2/2)

Table 57: China Market Volume (Units) Analysis 2013-2021 and Forecast 2022-2028, By Product Type

Table 58: China Market Size (US$ Mn) Analysis 2013-2021 and Forecast 2022-2028, By Distribution Sales

Table 59: India Market Size (US$ Mn) Analysis 2013-2021 and Forecast 2022-2028, By Product Type (1/2)

Table 60: India Market Size (US$ Mn) Analysis 2013-2021 and Forecast 2022-2028, By Product Type (2/2)

Table 61: India Market Volume (Units) Analysis 2013-2021 and Forecast 2022-2028, By Product Type

Table 62: India Market Size (US$ Mn) Analysis 2013-2021 and Forecast 2022-2028, By Distribution Sales

Table 63: Brazil Market Size (US$ Mn) Analysis 2013-2021 and Forecast 2022-2028, By Product Type (1/2)

Table 64: Brazil Market Size (US$ Mn) Analysis 2013-2021 and Forecast 2022-2028, By Product Type (2/2)

Table 65: Brazil Market Volume (Units) Analysis 2013-2021 and Forecast 2022-2028, By Product Type

Table 66: Brazil Market Size (US$ Mn) Analysis 2013-2021 and Forecast 2022-2028, By Distribution Sales
Sabyasachi Ghosh
Sabyasachi Ghosh

Principal Consultant

Talk to Analyst

Find your sweet spots for generating winning opportunities in this market.

List of Charts

Figure 01: Market size (US$ Mn) 2022E, 2022F, & 2028F

Figure 02: Market Value Share by Product Type (2022E)

Figure 03: Obesity Drug Development Pipeline by Phase

Figure 04: Per-Capita Pharmaceutical Spending and Absolute Incidence of Obesity

Figure 05: Percent of Patients Remaining on Therapy Over 1 Year

Figure 06: Global Market Size and Y-o-Y, 2013 - 2021

Figure 07: Global Market Size (US$ Mn) & Y-o-Y Growth (%), 2022–2028

Figure 08: Global Market Absolute $ Opportunity, 2021–2028

Figure 09: Increasing Prevalence of Obesity in Adults, by Region, 1990-2014

Figure 10: Increasing number of Bariatric Surgery Numbers, 2011-2021

Figure 11: Global Market Share Analysis (%) By Product Type, 2022 & 2028

Figure 12: Global Market Y-o-Y Growth (%) By Product Type, 2022–2028

Figure 13: Global Market Attractiveness Analysis, By Product Type

Figure 14: Global Market Share Analysis (%) By Distribution Sales, 2022 & 2028

Figure 15: Global Market Y-o-Y Growth (%) By Distribution Sales, 2022–2028

Figure 16: Global Market Attractiveness Analysis, By Distribution Sales

Figure 17: Global Market Share Analysis (%) By Region, 2022 & 2028

Figure 18: Global Market Y-o-Y Growth (%) By Region, 2022–2028

Figure 19: Global Market Attractiveness Analysis, By Region

Figure 20: North America Market Value Share, by Country (2022)

Figure 21: North America Market Value Share, by Product Type (2022)

Figure 22: North America Market Value Share, by Distribution Sales (2022)

Figure 23: North America Market Size (US$ Mn) Analysis, 2013-2021

Figure 24: North America Market Size (US$ Mn) Forecast & Y-o-Y Growth (%), 2022-2028

Figure 25: North America Market Y-o-Y growth (%) Comparison, By Country, 2022-2028

Figure 26: North America Market Size (US$ Mn) Analysis, 2013-2021, by Devices

Figure 27: North America Market Size (US$ Mn) Forecast Analysis & Y-o-Y Growth (%), 2022-2028, by Devices

Figure 28: North America Market Size (US$ Mn) Analysis, 2013-2021, by Drugs

Figure 29: North America Market Size (US$ Mn) Forecast Analysis & Y-o-Y Growth (%), 2022-2028, by Drugs

Figure 30: North America Market Attractiveness Analysis, By Country

Figure 31: North America Market Attractiveness Analysis, By Product Type

Figure 32: North America Market Attractiveness Analysis, By Distribution Sales

Figure 33: Latin America Market Value Share, by Country (2022)

Figure 34: Latin America Market Value Share, by Product Type (2022)

Figure 35: Latin America Market Value Share, by Distribution Sales (2022)

Figure 36: Latin America Market Size (US$ Mn) Analysis, 2013-2021

Figure 37: Latin America Market Size (US$ Mn) Forecast & Y-o-Y Growth (%), 2022-2028

Figure 38: Latin America Market Y-o-Y growth (%) Comparison, By Country, 2022-2028

Figure 39: Latin America Market Size (US$ Mn) Analysis, 2013-2021, by Devices

Figure 40: Latin America Market Size (US$ Mn) Forecast Analysis & Y-o-Y Growth (%), 2022-2028, by Devices

Figure 41: Latin America Market Size (US$ Mn) Analysis, 2013-2021, by Drugs

Figure 42: Latin America Market Size (US$ Mn) Forecast Analysis & Y-o-Y Growth (%), 2022-2028, by Drugs

Figure 43: Latin America Market Attractiveness Analysis, By Country

Figure 44: Latin America Market Attractiveness Analysis, By Product Type

Figure 45: Latin America Market Attractiveness Analysis, By Distribution Sales

Figure 46: Europe Market Value Share, by Country (2022)

Figure 47: Europe Market Value Share, by Product Type (2022)

Figure 48: Europe Market Value Share, by Distribution Sales (2022)

Figure 49: Europe Market Size (US$ Mn) Analysis, 2013-2021

Figure 50: Europe Market Size (US$ Mn) Forecast & Y-o-Y Growth (%), 2022-2028

Figure 51: Europe Market Y-o-Y growth (%) Comparison, By Country, 2022-2028

Figure 52: Europe Market Size (US$ Mn) Analysis, 2013-2021, by Devices

Figure 53: Europe Market Size (US$ Mn) Forecast Analysis & Y-o-Y Growth (%), 2022-2028, by Devices

Figure 54: Europe Market Size (US$ Mn) Analysis, 2013-2021, by Drugs

Figure 55: Europe Market Size (US$ Mn) Forecast Analysis & Y-o-Y Growth (%), 2022-2028, by Drugs

Figure 56: Europe Market Attractiveness Analysis, By Country

Figure 57: Europe Market Attractiveness Analysis, By Product Type

Figure 58: Europe Market Attractiveness Analysis, By Distribution Sales

Figure 59: South Asia Market Value Share, by Country (2022)

Figure 60: South Asia Market Value Share, by Product Type (2022)

Figure 61: South Asia Market Value Share, by Distribution Sales (2022)

Figure 62: South Asia Market Size (US$ Mn) Analysis, 2013-2021

Figure 63: South Asia Market Size (US$ Mn) Forecast & Y-o-Y Growth (%), 2022-2028

Figure 64: South Asia Market Y-o-Y growth (%) Comparison, By Country, 2022-2028

Figure 65: South Asia Market Size (US$ Mn) Analysis, 2013-2021, by Devices

Figure 66: South Asia Market Size (US$ Mn) Forecast Analysis & Y-o-Y Growth (%), 2022-2028, by Devices

Figure 67: South Asia Market Size (US$ Mn) Analysis, 2013-2021, by Drugs

Figure 68: South Asia Market Size (US$ Mn) Forecast Analysis & Y-o-Y Growth (%), 2022-2028, by Drugs

Figure 69: South Asia Market Attractiveness Analysis, By Country

Figure 70: South Asia Market Attractiveness Analysis, By Product Type

Figure 71: South Asia Market Attractiveness Analysis, By Distribution Sales

Figure 72: East Asia Market Value Share, by Country (2022)

Figure 73: East Asia Market Value Share, by Product Type (2022)

Figure 74: East Asia Market Value Share, by Distribution Sales (2022)

Figure 75: East Asia Market Size (US$ Mn) Analysis, 2013-2021

Figure 76: East Asia Market Size (US$ Mn) Forecast & Y-o-Y Growth (%), 2022-2028

Figure 77: East Asia Market Y-o-Y growth (%) Comparison, By Country, 2022-2028

Figure 78: East Asia Market Size (US$ Mn) Analysis, 2013-2021, by Devices

Figure 79: East Asia Market Size (US$ Mn) Forecast Analysis & Y-o-Y Growth (%), 2022-2028, by Devices

Figure 80: East Asia Market Size (US$ Mn) Analysis, 2013-2021, by Drugs

Figure 81: East Asia Market Size (US$ Mn) Forecast Analysis & Y-o-Y Growth (%), 2022-2028, by Drugs

Figure 82: East Asia Market Attractiveness Analysis, By Country

Figure 83: East Asia Market Attractiveness Analysis, By Product Type

Figure 84: East Asia Market Attractiveness Analysis, By Distribution Sales

Figure 85: Oceania Market Value Share, by Country (2022)

Figure 86: Oceania Market Value Share, by Product Type (2022)

Figure 87: Oceania Market Value Share, by Distribution Sales (2022)

Figure 88: Oceania Market Size (US$ Mn) Analysis, 2013-2021

Figure 89: Oceania Market Size (US$ Mn) Forecast & Y-o-Y Growth (%), 2022-2028

Figure 90: Oceania Market Y-o-Y growth (%) Comparison, By Country, 2022-2028

Figure 91: Oceania Market Size (US$ Mn) Analysis, 2013-2021, by Devices

Figure 92: Oceania Market Size (US$ Mn) Forecast Analysis & Y-o-Y Growth (%), 2022-2028, by Devices

Figure 93: Oceania Market Size (US$ Mn) Analysis, 2013-2021, by Drugs

Figure 94: Oceania Market Size (US$ Mn) Forecast Analysis & Y-o-Y Growth (%), 2022-2028, by Drugs

Figure 95: Oceania Market Attractiveness Analysis, By Country

Figure 96: Oceania Market Attractiveness Analysis, By Product Type

Figure 97: Oceania Market Attractiveness Analysis, By Distribution Sales

Figure 98: Middle East & Africa Market Value Share, by Country (2022)

Figure 99: Middle East & Africa Market Value Share, by Product Type (2022)

Figure 100: Middle East & Africa Market Value Share, by Distribution Sales (2022)

Figure 101: Middle East & Africa Market Size (US$ Mn) Analysis, 2013-2021

Figure 102: Middle East & Africa Market Size (US$ Mn) Forecast & Y-o-Y Growth (%), 2022-2028

Figure 103: Middle East & Africa Market Y-o-Y growth (%) Comparison, By Country, 2022-2028

Figure 104: Middle East & Africa Market Size (US$ Mn) Analysis, 2013-2021, by Devices

Figure 105: Middle East & Africa Market Size (US$ Mn) Forecast Analysis & Y-o-Y Growth (%), 2022-2028, by Devices

Figure 106: Middle East & Africa Market Size (US$ Mn) Analysis, 2013-2021, by Drugs

Figure 107: Middle East & Africa Market Size (US$ Mn) Forecast Analysis & Y-o-Y Growth (%), 2022-2028, by Drugs

Figure 108: Middle East & Africa Market Attractiveness Analysis, By Country

Figure 109: Middle East & Africa Market Attractiveness Analysis, By Product Type

Figure 110: Middle East & Africa Market Attractiveness Analysis, By Distribution Sales

Figure 111: Global Market Value Proportion Analysis, By Emerging Countries, 2022

Figure 112: Market, Global Vs. Country Growth Y-o-Y (%) Comparison, 2022-2028

Figure 113: China Market Value Analysis (US$ Mn), 2013-2021

Figure 114: China Market Value Forecast (US$ Mn), 2022-2028

Figure 115: India Market Value Analysis (US$ Mn), 2013-2021

Figure 116: India Market Value Forecast (US$ Mn), 2022-2028

Figure 117: Brazil Market Value Analysis (US$ Mn), 2013-2021

Figure 118: Brazil Market Value Forecast (US$ Mn), 2022-2028

Figure 119: Global Market Brand Share (%) Analysis

Recommendations

Healthcare

Weight Management Market

Published : October 2022

Healthcare

Canine Weight Loss Drugs Market

Published : June 2018

Healthcare

Medically Supervised Weight Loss Services Market

Published : March 2018

Explore Healthcare Insights

View Reports