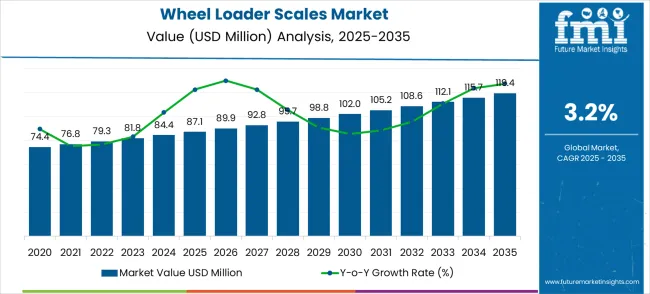
The wheel loader scales market is expected to reach USD 87.1 million in 2025 and expand to USD 119.4 million by 2035, growing at a CAGR of 3.2%. The growth contribution index demonstrates a steady upward trend, driven by increasing adoption in construction, mining, and material handling sectors. From USD 74.4 million in 2020 to USD 87.1 million in 2025, the incremental increase reflects a shift toward integrated wheel loader scales that improve operational efficiency and ensure compliance. Early growth contributions are primarily fueled by the replacement of conventional weighing methods with digital solutions that enhance accuracy and reporting capabilities.
| Metric | Value |
|---|---|
| Market Value (2025) | USD 87.1 million |
| Market Forecast Value (2035) | USD 119.4 million |
| Forecast CAGR (2025-2035) | 3.2% |
In the period between 2025 and 2030, the market value rises from USD 87.1 million to USD 102 million, indicating the first major contribution phase. Growth during these years is influenced by the deployment of advanced wheel loader scales across larger construction and mining operations, where precise load measurement drives cost efficiency and safety. The contribution index shows that mid-decade expansion is supported by investments in fleet monitoring and digital weighing technologies, which improve material tracking and operational reporting, thereby boosting overall market revenue.
Looking at 2030 to 2035, the market grows from USD 102 million to USD 119.4 million, representing the second key phase in growth contributions. Expansion in this period is supported by broader integration of wheel loader scales into automated and semi-automated operations, particularly in high-volume material handling and mining applications. The growth contribution index highlights that upgrades and new equipment adoption continue to fuel revenue, while enhanced data collection, reporting, and measurement accuracy reinforce the strategic value of modern wheel loader scales, maximizing their contribution to market expansion in the latter half of the decade.
Market expansion is being supported by the rapid growth in construction activities across developing economies and the corresponding need for accurate load measurement systems that ensure optimal equipment utilization and operational efficiency. Modern construction and mining operations require precise weight monitoring to maximize productivity and maintain safety standards. The superior accuracy and reliability of wheel loader scales make them essential components in demanding industrial environments where load optimization is critical for profitability.
The growing emphasis on operational efficiency and regulatory compliance is driving demand for advanced weighing technologies from certified manufacturers with proven track records of reliability and performance. Industrial operators are increasingly investing in high-quality scale systems that offer improved accuracy and reduced operational costs over extended service periods. Industry regulations and safety standards are establishing performance benchmarks that favor precision-engineered wheel loader scale solutions with advanced monitoring capabilities.
The market is segmented by technology type, application, and region. By technology type, the market is divided into dynamic weighing systems, static weighing systems, and others. Based on application, the market is categorized into construction industry, mining industry, agriculture industry, waste management, and others. Regionally, the market is divided into North America, Europe, East Asia, South Asia & Pacific, Latin America, and Middle East & Africa.
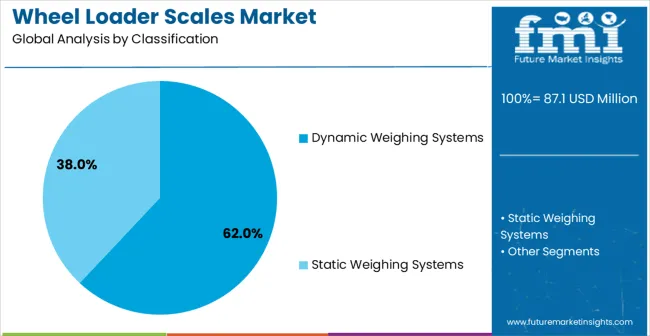
Dynamic weighing systems are projected to account for 62% of the wheel loader scales market in 2025, making them the leading technology type. This dominance is supported by growing demand for real-time material weighing and the emphasis on operational efficiency in heavy equipment operations. Dynamic systems allow operators to measure weight while the loader is in motion, reducing cycle times and improving productivity compared to traditional static weighing methods. Advanced load cells, calibration algorithms, and integrated displays have enhanced measurement accuracy and reliability. Adoption is particularly strong in construction and mining sectors, where continuous material flow and efficient project completion are critical. Automated material handling and cost optimization further accelerate market uptake.
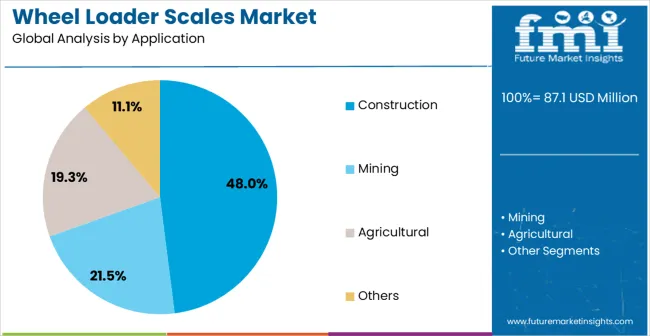
Construction applications are expected to represent 48% of wheel loader scales demand in 2025, making them the largest application segment. Accurate weighing of aggregates, concrete, soil, and other materials is critical to meeting project specifications, controlling costs, and optimizing inventory. Real-time dynamic weighing provides actionable data for project management, billing, and quality assurance. Growing infrastructure development and construction activity in emerging economies are driving consistent demand. The trend toward digitization enables integration of weighing systems with data logging and connectivity features, supporting smart construction operations. Demand is reinforced by global focus on efficient material management, reduced waste, and improved cost control throughout complex construction projects.
The wheel loader scales market is advancing steadily due to increasing construction activities and growing recognition of load management system importance. However, the market faces challenges including high initial equipment costs, need for specialized calibration services, and varying accuracy requirements across different industrial applications. Technology advancement efforts and standardization programs continue to influence equipment development and market adoption patterns.
Challenges From High Costs And Maintenance Requirements The market faces restraints from high initial investment costs and maintenance needs of onboard scale systems. Calibration, sensor replacement, and technical support add operational expenses. Harsh operating conditions such as dust, vibration, and extreme temperatures may affect sensor accuracy and durability. Smaller construction and mining operators may be hesitant to adopt these systems due to cost constraints. Additionally, variations in scale compatibility across different wheel loader models and brands create integration challenges, limiting adoption in certain regions and slowing market penetration despite the clear operational benefits.
Modern scale manufacturers are incorporating advanced sensor technologies and precision measurement systems that improve weighing accuracy while reducing environmental interference effects. Integration of temperature compensation and vibration filtering enables precise measurements in challenging operational conditions compared to traditional mechanical systems. Advanced calibration procedures and quality control measures support development of more reliable and consistent weighing performance for demanding industrial environments.
| Country | CAGR (2025-2035) |
|---|---|
| China | 4.3% |
| India | 4.0% |
| Germany | 3.7% |
| Brazil | 3.4% |
| United States | 3.0% |
| United Kingdom | 2.7% |
| Japan | 2.4% |
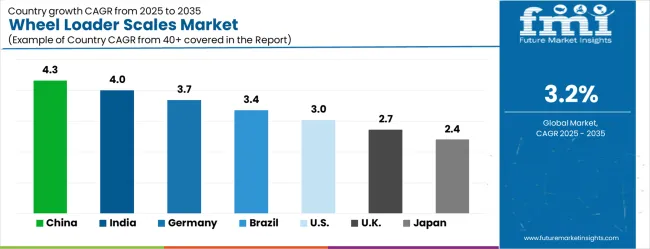
The wheel loader scales market is growing rapidly, with China leading at a 4.3% CAGR through 2035, driven by massive infrastructure development, construction sector expansion, and mining industry growth. India follows at 4.0%, supported by rising construction activities and increasing investments in mining operations. Germany records strong growth at 3.7%, emphasizing precision engineering and advanced manufacturing capabilities. Brazil grows steadily at 3.4%, integrating scale systems into expanding mining and construction operations. The United States shows moderate growth at 3.0%, focusing on equipment upgrades and efficiency improvements. The United Kingdom maintains steady expansion at 2.7%, supported by construction modernization programs. Japan demonstrates stable growth at 2.4%, emphasizing technological innovation and manufacturing excellence.
The report covers an in-depth analysis of 40+ countries top-performing countries are highlighted below.
Wheel loader scales market in China is growing at a CAGR of 4.3% through 2035 as large scale infrastructure and industrial projects expand rapidly. Urban development, industrialization, and major construction initiatives are driving demand for high precision weighing systems. Mining companies and construction operators are adopting advanced scales to optimize load management and enhance project efficiency. Domestic manufacturers focus on cost effective solutions while international suppliers compete by offering high performance technology. Eastern industrial hubs are leading adoption due to dense manufacturing clusters, while central and western provinces are increasingly integrating modern weighing equipment. Government backed modernization programs support widespread adoption of accurate and reliable measurement solutions across construction and mining sectors. • Eastern industrial hubs accelerate adoption of wheel loader scales to enhance operational efficiency and precise load measurement • Large scale projects in central and western provinces drive deployment of advanced weighing systems across industrial sites
India is witnessing strong growth in wheel loader scales market with a CAGR of 4.0% through 2035, driven by expanding construction and infrastructure development. Metro construction, industrial projects, and rising standards for operational efficiency are boosting demand for professional grade weighing systems. Mining and construction sectors are gradually adopting advanced equipment to maintain load accuracy and improve productivity. Local suppliers offering cost effective solutions compete with global brands providing high technology systems. Metro corridors lead adoption while smaller urban regions are gradually integrating modern scales. Operator training and technical support programs enhance utilization and ensure reliability of equipment across industrial and construction projects nationwide. • Major metro infrastructure projects encourage adoption of precision wheel loader scales to maintain operational efficiency • Technical training programs improve operator expertise supporting effective use of weighing equipment across construction sites
Germany is experiencing increasing adoption of wheel loader scales with a CAGR of 3.7% through 2035, driven by precision engineering and advanced manufacturing standards. Construction and mining companies require high performance weighing systems to meet strict operational and quality requirements. Domestic manufacturers focus on engineering excellence while international brands compete by providing innovative technology and superior system reliability. Southern industrial hubs are leading adoption while northern regions prioritize construction and mining applications. Professional certification programs strengthen operator technical skills supporting specialized load measurement and compliance with German standards. Investment in automation, reliability, and service programs continues to shape competitive dynamics in the market. • Southern industrial hubs adopt advanced wheel loader scales emphasizing accuracy, reliability, and operational compliance • Certification programs improve operator technical skills supporting efficient utilization across construction and mining operations
Brazil is showing steady growth in wheel loader scales market with a CAGR of 3.4% through 2035 due to expanding mining operations and increasing construction activities. Southeastern mining regions are leading adoption of advanced weighing systems while other regions gradually integrate modern equipment. Domestic manufacturers compete with international suppliers offering durable and precise solutions. Operator training and technical support initiatives improve operational efficiency and ensure accurate load measurement. Infrastructure development and industrial expansion projects provide opportunities for suppliers to strengthen market presence. The market is defined by operational reliability, accuracy standards, and adoption of advanced weighing technology in industrial sectors. • Southeastern mining regions lead adoption of wheel loader scales to enhance operational efficiency and load measurement accuracy • Operator training and technical support initiatives improve utilization and performance across construction and mining sites
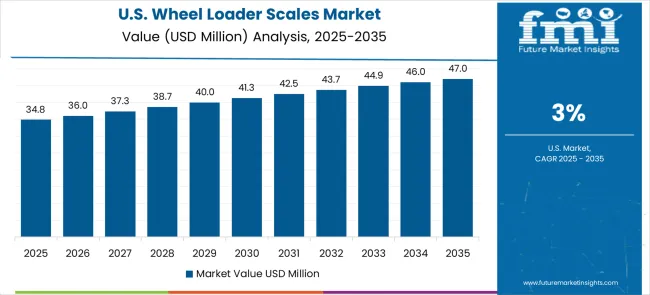
United States is experiencing consistent growth in wheel loader scales market with a CAGR of 3.0% through 2035, driven by modernization in construction and industrial operations. Mining companies and construction firms are implementing standardized weighing systems to improve efficiency and operational consistency. Domestic manufacturers focus on service oriented solutions while multinational suppliers compete with high performance equipment and advanced technology integration. Regional adoption varies with the Midwest leading in industrial hub integration and western urban centers emphasizing precision construction workflows. Professional certification and operator training programs are supporting standardized system use and ensuring operational reliability across sectors. • Midwestern industrial hubs lead adoption of standardized wheel loader scales across construction and industrial operations • Operator certification programs enhance technical skills ensuring consistent accuracy and performance across project sites
United Kingdom is witnessing gradual expansion in wheel loader scales market with a CAGR of 2.7% through 2035, supported by established construction sectors and precision measurement standards. Urban industrial hubs drive adoption of advanced weighing systems while rural regions are slowly integrating modern scales. Domestic distributors focus on service and system integration while international suppliers emphasize high performance technology. Operator training and maintenance programs enhance workforce expertise and ensure compliance with operational standards. Construction and mining projects prioritize accurate load measurement to improve efficiency. Market competition is defined by technological capabilities, service support, and operational reliability across sectors. • Urban industrial hubs prioritize advanced wheel loader scales to maintain operational efficiency and high measurement accuracy • Operator training and technical support programs enhance workforce capabilities ensuring effective scale utilization across sites
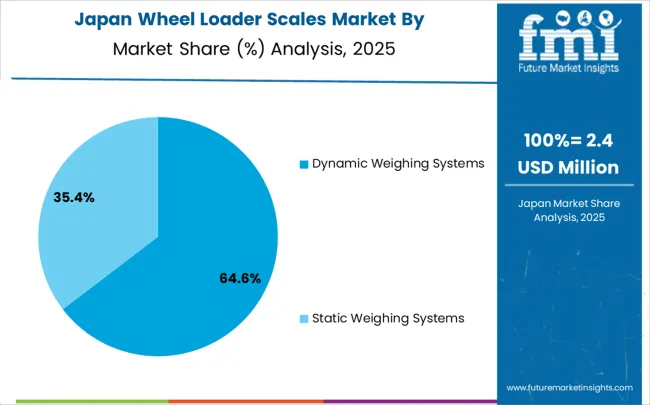
Japan is exceeding in wheel loader scales market with a CAGR of 2.4% through 2035, driven by technological innovation, precision, and quality assurance in industrial applications. Urban industrial and manufacturing hubs lead adoption of advanced weighing systems integrated with sensors for superior measurement accuracy. Domestic manufacturers compete with international suppliers offering high performance solutions. Professional development programs strengthen operator skills ensuring reliability and compliance with Japanese operational standards. Modernization of construction projects, mining expansion, and workflow optimization continue to drive market demand. The market emphasizes operational efficiency, measurement precision, and integration of advanced technologies across sectors. • Urban industrial hubs adopt precision wheel loader scales with sensor integration to optimize load measurement and operational efficiency • Professional development programs improve operator skills ensuring reliable performance and compliance with Japanese technical standards
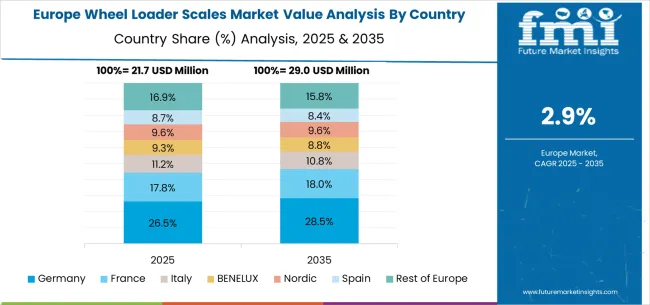
The wheel loader scales market in Europe is projected to grow from USD 18.2 million in 2025 to USD 27.6 million by 2035, registering a CAGR of 3.2% over the forecast period. Germany is expected to remain the largest national market, holding a 22.5% share in 2025, slightly easing to 21.9% by 2035, supported by its strong precision engineering base, advanced manufacturing capabilities, and widespread adoption of weighing systems in construction and mining sectors. The United Kingdom follows with an 18.0% share in 2025, rising to 19.1% by 2035, driven by expanding infrastructure projects, modernization of construction equipment, and increasing use of digital weighing technologies. France accounts for 15.5% in 2025, slightly dipping to 15.2% by 2035 amid growing diversification of suppliers and alternative scale solutions. Italy holds a stable 11.7% in 2025, remaining near 11.5% by 2035, with steady uptake across construction and agricultural applications. Spain represents 10.5% in 2025, increasing to 10.9% by 2035, supported by rising industrial activity. BENELUX countries contribute 6.0% in 2025, slightly decreasing to 5.8% by 2035, while the remainder of Europe, including Nordic and Eastern European markets, collectively declines from 15.8% to 15.0%, reflecting varied adoption across mature and emerging markets.
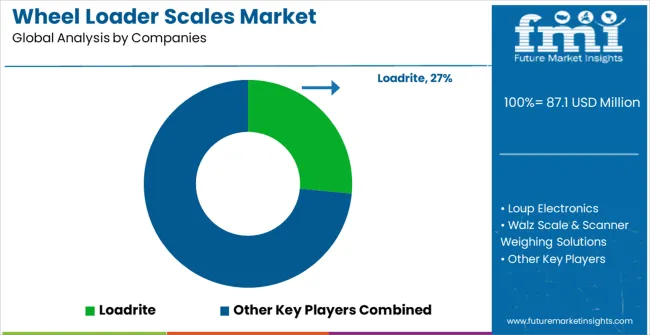
The wheel loader scales market is defined by competition among specialized weighing equipment manufacturers, construction equipment companies, and precision measurement solution providers. Companies are investing in advanced sensor technologies, measurement accuracy enhancement, digital integration capabilities, and comprehensive service offerings to deliver reliable, precise, and cost-effective weighing solutions. Strategic partnerships, technological advancement, and market expansion are central to strengthening product portfolios and market presence.
Loadrite offers comprehensive wheel loader weighing solutions with established manufacturing expertise and precision measurement capabilities. Loup Electronics provides specialized weighing equipment with focus on accuracy and operational reliability. Walz Scale delivers precision measurement solutions with emphasis on industrial applications and technical support. Scanner Weighing Solutions specializes in advanced weighing systems with digital integration capabilities.
Scale and Control offers professional-grade weighing equipment with comprehensive calibration services. e-Trak Technology Solutions provides innovative weighing systems with advanced monitoring features. Topcon delivers established measurement technologies with precision engineering excellence. PFREUNDT, Caterpillar, VEIGROUP SRL, Tamtron, and SEEZOL offer specialized manufacturing expertise, system reliability, and comprehensive product development across global and regional market segments.
Wheel loader scales (WLS) are gaining traction as critical tools for improving productivity, accuracy, and operational efficiency in mining, construction, waste management, and bulk material handling. By providing real-time load measurements, WLS enhance fleet management, reduce overloading fines, optimize fuel usage, and support data-driven decision-making. Scaling adoption requires coordinated action among governments, industry bodies, OEMs and tech providers, equipment suppliers, and investors.
How Governments Could Spur Local Production and Adoption?
How Industry Bodies Could Support Market Development?
How OEMs and Technology Providers Could Strengthen the Ecosystem?
How Equipment Suppliers Could Navigate the Shift?
How Investors and Financial Enablers Could Unlock Value?
| Item | Value |
|---|---|
| Quantitative Units | USD 87.1 million |
| Classification Type | Dynamic Weighing Systems, Static Weighing Systems |
| Application | Construction, Mining, Agricultural, Others |
| Regions Covered | North America, Europe, East Asia, South Asia & Pacific, Latin America, Middle East & Africa |
| Country Covered | China, India, Germany, Brazil, United States, United Kingdom, Japan, and 40+ countries |
| Key Companies Profiled | Loadrite, Loup Electronics, Walz Scale, Scanner Weighing Solutions, Scale and Control, e-Trak Technology Solutions, Topcon, PFREUNDT, Caterpillar, VEIGROUP SRL, Tamtron, SEEZOL |
| Additional Attributes | Dollar sales by classification type and application segment, regional demand trends across major markets, competitive landscape with established equipment manufacturers and emerging technology providers, customer preferences for dynamic versus static weighing systems, integration with construction and mining equipment management systems, innovations in sensor accuracy and digital monitoring technologies, and adoption of advanced calibration systems with enhanced measurement capabilities for improved operational workflows. |
The global wheel loader scales market is estimated to be valued at USD 87.1 million in 2025.
The market size for the wheel loader scales market is projected to reach USD 119.4 million by 2035.
The wheel loader scales market is expected to grow at a 3.2% CAGR between 2025 and 2035.
The key product types in wheel loader scales market are dynamic weighing systems and static weighing systems.
In terms of application, construction segment to command 48.0% share in the wheel loader scales market in 2025.


Our Research Products

The "Full Research Suite" delivers actionable market intel, deep dives on markets or technologies, so clients act faster, cut risk, and unlock growth.

The Leaderboard benchmarks and ranks top vendors, classifying them as Established Leaders, Leading Challengers, or Disruptors & Challengers.

Locates where complements amplify value and substitutes erode it, forecasting net impact by horizon

We deliver granular, decision-grade intel: market sizing, 5-year forecasts, pricing, adoption, usage, revenue, and operational KPIs—plus competitor tracking, regulation, and value chains—across 60 countries broadly.

Spot the shifts before they hit your P&L. We track inflection points, adoption curves, pricing moves, and ecosystem plays to show where demand is heading, why it is changing, and what to do next across high-growth markets and disruptive tech

Real-time reads of user behavior. We track shifting priorities, perceptions of today’s and next-gen services, and provider experience, then pace how fast tech moves from trial to adoption, blending buyer, consumer, and channel inputs with social signals (#WhySwitch, #UX).

Partner with our analyst team to build a custom report designed around your business priorities. From analysing market trends to assessing competitors or crafting bespoke datasets, we tailor insights to your needs.
Supplier Intelligence
Discovery & Profiling
Capacity & Footprint
Performance & Risk
Compliance & Governance
Commercial Readiness
Who Supplies Whom
Scorecards & Shortlists
Playbooks & Docs
Category Intelligence
Definition & Scope
Demand & Use Cases
Cost Drivers
Market Structure
Supply Chain Map
Trade & Policy
Operating Norms
Deliverables
Buyer Intelligence
Account Basics
Spend & Scope
Procurement Model
Vendor Requirements
Terms & Policies
Entry Strategy
Pain Points & Triggers
Outputs
Pricing Analysis
Benchmarks
Trends
Should-Cost
Indexation
Landed Cost
Commercial Terms
Deliverables
Brand Analysis
Positioning & Value Prop
Share & Presence
Customer Evidence
Go-to-Market
Digital & Reputation
Compliance & Trust
KPIs & Gaps
Outputs
Full Research Suite comprises of:
Market outlook & trends analysis
Interviews & case studies
Strategic recommendations
Vendor profiles & capabilities analysis
5-year forecasts
8 regions and 60+ country-level data splits
Market segment data splits
12 months of continuous data updates
DELIVERED AS:
PDF EXCEL ONLINE
Wheeled Bins Market Size and Share Forecast Outlook 2025 to 2035
Wheel Excavator Market Size and Share Forecast Outlook 2025 to 2035
Wheel Balancing Market Size and Share Forecast Outlook 2025 to 2035
Wheel Aligner Equipment Market Size and Share Forecast Outlook 2025 to 2035
Wheel Tractor Scrapers Market Size and Share Forecast Outlook 2025 to 2035
Wheeled Insulated Cooler Market Trends - Growth & Demand Forecast 2025 to 2035
Competitive Breakdown of Wheeled Bin Providers
Germany Wheeled Bin Industry Analysis – Growth & Outlook 2024-2034
Wheelchair Market Analysis – Size, Share & Forecast 2024-2034
Wheel studs Market
Wheel Loader Market Size and Share Forecast Outlook 2025 to 2035
3-Wheel Sit-Down Counterbalance Forklift Market Size and Share Forecast Outlook 2025 to 2035
4-Wheel Sit-Down Counterbalance Forklift Market Size and Share Forecast Outlook 2025 to 2035
4-Wheel Mobility Scooters Market Analysis - Size, Share, and Forecast Outlook 2025 to 2035
Competitive Overview of 4-Wheeled Container Companies
4-Wheeled Container Market Trends – Size, Demand & Forecast 2024-2034
Flywheel Energy Storage Market Size and Share Forecast Outlook 2025 to 2035
Two-Wheeler Lubricants Market Size and Share Forecast Outlook 2025 to 2035
Two Wheeler Anti-lock Braking System Market Size and Share Forecast Outlook 2025 to 2035
Two Wheeler Rental Market Size and Share Forecast Outlook 2025 to 2035

Thank you!
You will receive an email from our Business Development Manager. Please be sure to check your SPAM/JUNK folder too.
Chat With
MaRIA