Reports

- Global Locations -

Headquarters

Future Market Insights, Inc.

Christiana Corporate, 200
Continental Drive, Suite 401,
Newark, Delaware - 19713,
United States

T: +1-845-579-5705

Americas

Future Market Insights, Inc.

616 Corporate Way, Suite 2-9018,
Valley Cottage, NY 10989, United States

T: +1-347-918-3531

MEA

Future Market Insights

1602-6 Jumeirah Bay X2 Tower, Plot No: JLT-PH2-X2A,
Jumeirah Lakes Towers, Dubai,
United Arab Emirates

Europe

Future Market Insights

3rd Floor, 207 Regent Street,
W1B 3HH London
United Kingdom

T: + 44 (0) 20 8123 9659
D: +44 (0) 20 3287 4268

Asia Pacific

Future Market Insights

IndiaLand Global Tech Park, Unit UG-1, Behind Grand HighStreet, Phase 1, Hinjawadi, MH, Pune – 411057, India

Yoga and Meditation Market Outlook from 2023 to 2033

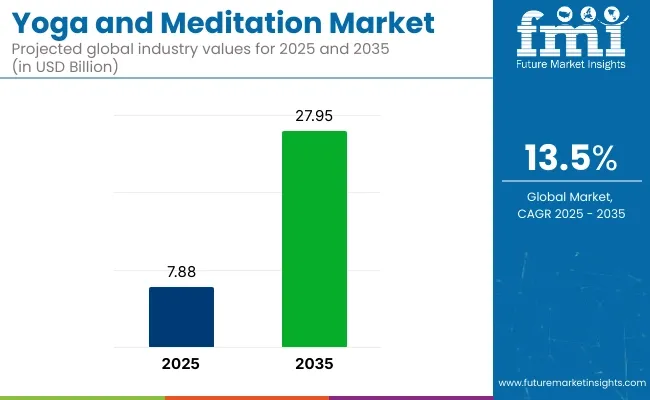
The yoga and meditation market size is projected to be worth US$ 6,063.57 million in 2023. The market is likely to reach US$ 23,000 million by 2033. The market is further expected to surge at a CAGR of 14.3% during the forecast period 2023 to 2033.

Key Market Trends and Highlights

  • Yoga and meditation embrace digital platforms, with apps, wearables, and online classes revolutionizing practice accessibility.
  • Rising mental health awareness propels yoga and meditation as effective stress-relief and anxiety management tools.
  • Eco-conscious consumers seek eco-friendly mats, clothing, and accessories, driving a demand for sustainable products.
  • Specialized forms like aerial yoga and kundalini gain popularity, catering to diverse preferences.
  • Companies invest in employee well-being, elevating yoga and meditation's role in workplace wellness programs.
Attributes Key Insights
Yoga and Meditation Market Estimated Size in 2023 US$ 6,063.57 million
Projected Market Value in 2033 US$ 23,000 million
Value-based CAGR from 2023 to 2033 14.3%

Don't pay for what you don't need

Customize your report by selecting specific countries or regions and save 30%!

2018 to 2022 Historical Analysis vs. 2023 to 2033 Market Forecast Projections

The scope for yoga and meditation rose at a 13.7% CAGR between 2018 and 2022. The global market for yoga and meditation is anticipated to grow at a moderate CAGR of 14.3% over the forecast period 2023 to 2033.

Report Attribute Details
Market Value in 2018 US$ 2,500 million
Market Value in 2022 US$ 5,295.07 million
CAGR from 2018 to 2022 13.7%

From 2018 to 2022, the yoga and meditation market witnessed remarkable growth and transformation. Historical analysis during this period revealed several key trends and factors that shaped the industry's trajectory. The increased awareness of holistic well-being, coupled with a growing interest in mindfulness and mental health, led to a surge in demand for yoga and meditation practices. Online platforms and mobile apps made these practices more accessible than ever, attracting a global audience.

Eco-consciousness drove the demand for sustainable yoga gear, influencing both consumers and manufacturers. The market diversified, with niche yoga forms like Aerial Yoga gaining popularity, reflecting evolving preferences.

As we transition to the 2023 to 2033 market forecast, the industry's upward trajectory is set to continue. The integration of technology, including virtual reality and artificial intelligence, will further enhance the user experience, making yoga and meditation even more personalized and engaging.

Mental health awareness will remain a central driver, with these practices increasingly recognized as effective tools for stress relief and anxiety management. Corporate wellness programs will expand, presenting opportunities for instructors and wellness coaches.

Yoga and Meditation Market Key Drivers

  • The worldwide focus on well-being and a healthier lifestyle fuels the yoga and meditation market's growth as integral components of holistic wellness.
  • An aging demographic seeks mind-body practices to maintain mobility, reduce stress, and enhance overall quality of life, boosting demand.
  • Yoga and meditation increasingly collaborate with fitness centers and trainers, expanding accessibility and reaching a broader audience.
  • Growing medical research supports the therapeutic benefits of these practices, leading to greater acceptance by healthcare professionals.
  • Wellness tourism and retreats incorporating yoga and meditation attract a dedicated market segment seeking relaxation and rejuvenation experiences.
Ronak Shah
Ronak Shah

Principal Consultant

Talk to Analyst

Find your sweet spots for generating winning opportunities in this market.

Challenges in the Yoga and Meditation Market

  • The market is becoming saturated, making it challenging new entrants to differentiate themselves and gain recognition in a crowded space.
  • Ensuring the quality and authenticity of instructors and practices remains a concern, as subpar offerings can harm the reputation of the industry.
  • Despite growing acceptance, there is still some stigma associated with mental health, which can hinder broader adoption of yoga and meditation as mental wellness tools.
  • While technology enhances accessibility, excessive reliance on digital platforms can detract from the holistic and mindful essence of these practices.
  • Some individuals may find the cost of classes, retreats, or sustainable yoga gear prohibitive, limiting accessibility and inclusivity in the market.

Comparative View of Adjacent Markets

Future Market Insights has compared two other markets, namely global medical tourism market and global medical tourism market below.

This highlights that yoga and meditation industry is set to dominate out of these three markets over the forecast period 2023 to 2033.

Yoga and Meditation Market:

CAGR from 2023 to 2033 14.3%
Market Value in 2033 US$ 23,000 million
Key Trends
  • The market sees a surge in tech integration with virtual classes, meditation apps, and wearables enhancing accessibility and personalization.
  • Yoga and meditation are increasingly recognized for their role in stress relief and mental well-being, driving their adoption as holistic mental health tools.
Opportunity
  • Sustainability trends extend to the market, with eco-friendly yoga gear and eco-conscious practices reflecting consumer values and environmental awareness.
  • Schools are integrating mindfulness practices into curricula to enhance student well-being, creating opportunities for specialized educational programs.

Global Medical Tourism Market:

CAGR from 2023 to 2033 30.5%
Market Value in 2033 US$ 75 billion
Key Trends The growing accessibility of cutting-edge technology.
Opportunity The increasing adoption of the internet is expected to have an impact on the market.

Intrabound Medical Tourism Market:

CAGR from 2023 to 2033 10.20%
Market Value in 2033 US$ 54.4 million
Key Trends The growth of this market can be attributed to Ensuring the growth of the intrabound medical tourism market may heavily rely on efforts to improve the quality and availability of healthcare services, along with prioritizing patient safety.
Opportunity The growth of this market can be attributed to the increase in healthcare expenses, extended waiting periods for medical procedures, and the presence of advanced healthcare facilities in certain geographical areas.

Get the data you need at a Fraction of the cost

Personalize your report by choosing insights you need
and save 40%!

Country-wise Insights

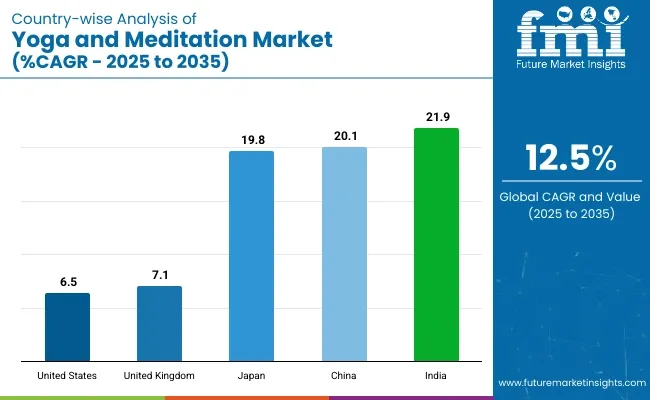
The below table showcases revenues in terms of the top 5 leading countries, spearheaded by the United States and China. These two countries are expected to lead the market through 2033.

Forecast CAGRs from 2023 to 2033

The United States 14.2%
China 14.1%
The United Kingdom 14%
Japan 13.9%
South Korea 13.8%

The Flourishing Yoga and Meditation Scene in the United States

The United States is expected to surge at a CAGR of 14.2%. The United States yoga and meditation market is undergoing dynamic shifts driven by several latest drivers. The heightened focus on mental health and well-being post-pandemic has accelerated the adoption of yoga and meditation as effective stress management tools.

A surge in tech-driven solutions, like meditation apps and online classes, has made these practices more accessible than ever. The integration of yoga and meditation into corporate wellness programs is on the rise, reflecting a commitment to employee mental health. Sustainable and eco-friendly yoga gear is gaining popularity as consumers prioritize eco-conscious choices, reshaping the market's offerings.

Finding Inner Peace in the United Kingdom- Exploring the Landscape

The United Kingdom's yoga and meditation market is currently witnessing a surge in opportunities, reflecting a growing emphasis on holistic well-being. Online platforms and virtual classes have become instrumental in reaching a broader audience, offering instructors and studios the chance to expand their clientele beyond geographical constraints.

The integration of mindfulness practices into corporate wellness programs is on the rise, opening doors for specialized yoga and meditation instructors to serve businesses. Sustainable and eco-friendly yoga gear is gaining traction, presenting a niche market for eco-conscious entrepreneurs. These opportunities collectively signify a flourishing landscape for yoga and meditation in the United Kingdom.

Unearthing the Potential of the Yoga and Meditation Market in China

The market in China is poised to expand at a CAGR of 14.1% through 2033. A surge in virtual classes and meditation apps has made yoga and meditation accessible to a broader audience, especially in urban areas, creating convenience and flexibility.

Chinese practices such as Tai Chi and Qigong are merging with yoga and meditation, offering a unique blend of holistic wellness that resonates with the local culture. Wellness retreats in scenic regions like Tibet and Yunnan are gaining popularity, combining yoga, meditation, and traditional Chinese medicine for a comprehensive wellness experience.

Environmentally conscious consumers are driving the demand for eco-friendly yoga gear and sustainable practices in studios and retreats. Companies are introducing workplace mindfulness programs to reduce employee stress and enhance productivity, fostering a wellness-oriented corporate culture.

Zen Revival- Exploring the Serene Yoga and Meditation Landscape of Japan

Japan is experiencing a transformative wave in the prospects of yoga and meditation. In recent years, there has been a notable surge in interest, as more Japanese individuals are turning to these practices for holistic well-being. The latest trends reveal a growing inclination toward mindfulness and mental health.

Yoga studios and meditation centers are expanding, catering to diverse preferences, from traditional to niche practices. Corporate Japan is recognizing the benefits of employee well-being programs, integrating yoga and meditation to reduce workplace stress.

As Japan embraces these ancient practices in a modern context, the future holds immense potential for their continued growth and integration into daily life. A CAGR of 13.9% is expected for the market from 2023 to 2033.

South Korea Shows Substantial Promise in the Yoga and Meditation Domain

South Korea is emerging as a promising hub in the realm of yoga and meditation. In recent years, it has witnessed a remarkable surge in interest, both among its citizens and tourists. South Korea's unique blend of ancient Eastern traditions and modern innovations has made it a hotspot for yoga and meditation enthusiasts.

The country offers diverse practices, ranging from traditional forms to contemporary fusion styles, attracting a wide audience. With a growing emphasis on holistic well-being, South Korea is not only fostering a thriving local community but also positioning itself as a sought-after destination for wellness seekers, cementing its promising status in this domain.

Category-wise Insights

The below table highlights how cotton is projected to lead the market in terms of products, apps growing at 14.5% CAGR through 2033. The corporate segment is likely to spearhead sales based on end-use, and is anticipated to witness a CAGR of 14.9% through 2033.

Category CAGR from 2023 to 2033
Apps 14.5%
Corporate 14.9%

How Mobile Applications have Transformed Yoga and Meditation Market

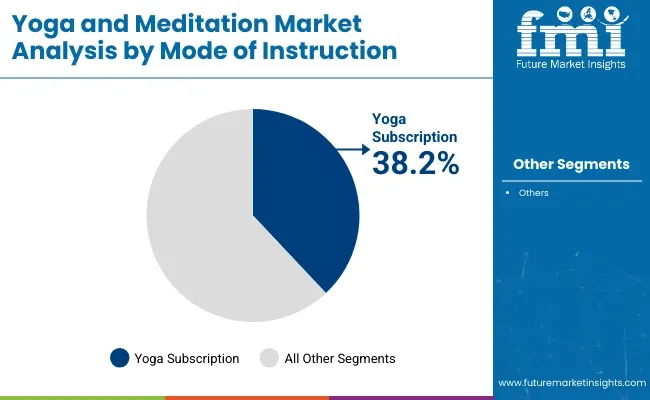
Among the diverse product segments in the yoga and meditation market, apps have emerged as the dominant force. In our digital age, the convenience and accessibility offered by meditation and yoga apps have propelled them to the forefront.

These applications provide a wide range of guided practices, making it easier for individuals to incorporate mindfulness into their daily lives. While yoga centers and meditation workshops offer valuable in-person experiences, the convenience and flexibility of apps have made them the go-to choice for many seeking balance and tranquility amidst their busy lifestyles.

Employee Wellness- Corporate Domination in the Yoga and Meditation Market

Among the various end-use segments in the yoga and meditation market, corporate utilization is currently dominating. With a growing emphasis on employee well-being and stress reduction in the corporate world, many companies are incorporating yoga and meditation programs into their workplace wellness initiatives.

This trend not only enhances the overall health and productivity of employees but also presents a significant market opportunity. While the other segments like home, schools, meditation centers, and others remain important, corporate adoption stands out as the most influential end-use sector, driving the market's expansion and shaping its future dynamics.

Competitive Landscape

The competitive landscape of the yoga and meditation market is vibrant and evolving. Established players continue to expand their digital presence with innovative apps and online platforms.

Niche studios and instructors with unique offerings are gaining ground, appealing to specialized interests. Corporate wellness providers are intensifying their offerings, tapping into the workplace wellness trend.

Sustainable yoga gear manufacturers are also carving their niche, catering to eco-conscious consumers. This dynamic ecosystem fosters healthy competition, driving innovation and enhancing accessibility, ultimately benefiting consumers seeking a diverse array of yoga and meditation experiences tailored to their preferences and needs.

Product Portfolio

  • Stop, Breathe & Think PBC offers a holistic product portfolio of meditation and mindfulness apps, providing personalized meditation experiences for various moods and needs.
  • Simple Habit Inc. specializes in meditation apps designed to fit busy lifestyles, offering short, impactful guided sessions for enhanced well-being.
  • Calm Headspace Inc. delivers a comprehensive collection of meditation and relaxation content, featuring guided sessions, sleep aids, and mindful exercises for diverse user needs.

Report Scope

Attribute Details
Estimated Market Size in 2023 US$ 6,063.57 million
Projected Market Valuation in 2033 US$ 23,000 million
Value-based CAGR 2023 to 2033 14.3%
Forecast Period 2023 to 2033
Historical Data Available for 2018 to 2022
Market Analysis Value in US$ million
Key Regions Covered
  • North America
  • Latin America
  • Western Europe
  • Eastern Europe
  • South Asia and Pacific
  • East Asia
  • The Middle East & Africa
Key Market Segments Covered
  • Product
  • Indication
  • Source
  • End-Use
  • Region
Key Countries Profiled
  • The United States
  • Canada
  • Brazil
  • Mexico
  • Germany
  • The United Kingdom
  • France
  • Spain
  • Italy
  • Russia
  • Poland
  • Czech Republic
  • Romania
  • India
  • Bangladesh
  • Australia
  • New Zealand
  • China
  • Japan
  • South Korea
  • GCC countries
  • South Africa
  • Israel
Key Companies Profiled
  • Smiling Mind
  • Inner Explorer Inc.
  • Committee for Children
  • Stop, Breathe & Think PBC
  • Simple Habit Inc.
  • Calm Headspace Inc.
  • Inscape
  • Insight Network Inc.
  • Waking Up, LLC
  • FeelVeryBien S.a.S
  • MEDITOPIA
  • BetterMe
  • Aura Health
  • Sanity & Self
  • TEN PERCENT HAPPIER
  • Inward Inc.
  • Portal Labs Ltd.
  • MOBIO INTERACTIVE
  • Mindfulness Everywhere

Segmentation Analysis of the Yoga and Meditation Market

By Product:

  • Websites
  • Apps
  • Yoga centers
  • Meditation workshops
  • Books
  • Others

By Indication:

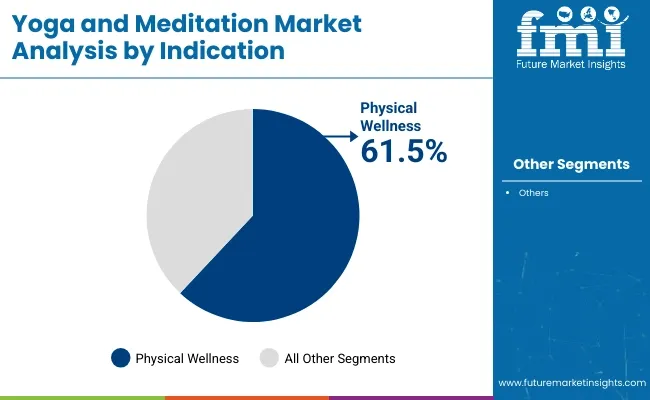
  • Physical
  • Mental

By Source:

  • Internet
  • Instructor
  • Gym
  • Meditation Centers

By End Use:

  • Home
  • Schools
  • Corporates
  • Meditation Centers
  • Others

Region:

  • North America
  • Latin America
  • Western Europe
  • Eastern Europe
  • South Asia & Pacific
  • East Asia
  • The Middle East & Africa

Frequently Asked Questions

How big is the Yoga and Meditation Market?

The yoga and meditation market is expected to reach US$ 6,063.57 million in 2023.

What is the projected market size & growth rate of the Yoga and Meditation Market?

The market for yoga and meditation is set to reach a valuation of US$ 23,000 million, expanding at a CAGR of 14.3% by 2033.

What are the key driving factors for the growth of the Yoga and Meditation Market?

Increasing incidences of mental illnesses and sedentary lifestyle is driving the market growth.

Which country is likely to be at the pinnacle of the Yoga and Meditation market?

The United States is likely to be the top performing market, surging at a CAGR of 14.2% through 2033.

Which is the leading source segment in the Yoga and Meditation domain?

Internet is preferred, expected to rise at a 14.7% CAGR through 2033.

Table of Content

1. Executive Summary

    1.1. Global Market Outlook

    1.2. Demand-side Trends

    1.3. Supply-side Trends

    1.4. Technology Roadmap Analysis

    1.5. Analysis and Recommendations

2. Market Overview

    2.1. Market Coverage / Taxonomy

    2.2. Market Definition / Scope / Limitations

3. Market Background

    3.1. Market Dynamics

        3.1.1. Drivers

        3.1.2. Restraints

        3.1.3. Opportunity

        3.1.4. Trends

    3.2. Scenario Forecast

        3.2.1. Demand in Optimistic Scenario

        3.2.2. Demand in Likely Scenario

        3.2.3. Demand in Conservative Scenario

    3.3. Opportunity Map Analysis

    3.4. Investment Feasibility Matrix

    3.5. PESTLE and Porter’s Analysis

    3.6. Regulatory Landscape

        3.6.1. By Key Regions

        3.6.2. By Key Countries

    3.7. Regional Parent Market Outlook

4. Global Market Analysis 2018 to 2022 and Forecast, 2023 to 2033

    4.1. Historical Market Size Value (US$ Million) Analysis, 2018 to 2022

    4.2. Current and Future Market Size Value (US$ Million) Projections, 2023 to 2033

        4.2.1. Y-o-Y Growth Trend Analysis

        4.2.2. Absolute $ Opportunity Analysis

5. Global Market Analysis 2018 to 2022 and Forecast 2023 to 2033, By Product

    5.1. Introduction / Key Findings

    5.2. Historical Market Size Value (US$ Million) Analysis By Product, 2018 to 2022

    5.3. Current and Future Market Size Value (US$ Million) Analysis and Forecast By Product, 2023 to 2033

        5.3.1. Websites

        5.3.2. Apps

        5.3.3. Yoga Centers

        5.3.4. Meditation Workshops

        5.3.5. Books

        5.3.6. Others

    5.4. Y-o-Y Growth Trend Analysis By Product, 2018 to 2022

    5.5. Absolute $ Opportunity Analysis By Product, 2023 to 2033

6. Global Market Analysis 2018 to 2022 and Forecast 2023 to 2033, By Indication

    6.1. Introduction / Key Findings

    6.2. Historical Market Size Value (US$ Million) Analysis By Indication, 2018 to 2022

    6.3. Current and Future Market Size Value (US$ Million) Analysis and Forecast By Indication, 2023 to 2033

        6.3.1. Physical

        6.3.2. Mental

    6.4. Y-o-Y Growth Trend Analysis By Indication, 2018 to 2022

    6.5. Absolute $ Opportunity Analysis By Indication, 2023 to 2033

7. Global Market Analysis 2018 to 2022 and Forecast 2023 to 2033, By Source

    7.1. Introduction / Key Findings

    7.2. Historical Market Size Value (US$ Million) Analysis by Source, 2018 to 2022

    7.3. Current and Future Market Size Value (US$ Million) Analysis and Forecast by Source, 2023 to 2033

        7.3.1. Internet

        7.3.2. Instructor

        7.3.3. Gym

        7.3.4. Meditation centers

    7.4. Y-o-Y Growth Trend Analysis by Source, 2018 to 2022

    7.5. Absolute $ Opportunity Analysis by Source, 2023 to 2033

8. Global Market Analysis 2018 to 2022 and Forecast 2023 to 2033, By End Use

    8.1. Introduction / Key Findings

    8.2. Historical Market Size Value (US$ Million) Analysis By End Use, 2018 to 2022

    8.3. Current and Future Market Size Value (US$ Million) Analysis and Forecast By End Use, 2023 to 2033

        8.3.1. Home

        8.3.2. Schools

        8.3.3. Corporates

        8.3.4. Meditation Centers

        8.3.5. Others

    8.4. Y-o-Y Growth Trend Analysis By End Use, 2018 to 2022

    8.5. Absolute $ Opportunity Analysis By End Use, 2023 to 2033

9. Global Market Analysis 2018 to 2022 and Forecast 2023 to 2033, By Region

    9.1. Introduction

    9.2. Historical Market Size Value (US$ Million) Analysis By Region, 2018 to 2022

    9.3. Current Market Size Value (US$ Million) Analysis and Forecast By Region, 2023 to 2033

        9.3.1. North America

        9.3.2. Latin America

        9.3.3. Western Europe

        9.3.4. Eastern Europe

        9.3.5. South Asia and Pacific

        9.3.6. East Asia

        9.3.7. Middle East and Africa

    9.4. Market Attractiveness Analysis By Region

10. North America Market Analysis 2018 to 2022 and Forecast 2023 to 2033, By Country

    10.1. Historical Market Size Value (US$ Million) Trend Analysis By Market Taxonomy, 2018 to 2022

    10.2. Market Size Value (US$ Million) Forecast By Market Taxonomy, 2023 to 2033

        10.2.1. By Country

            10.2.1.1. USA

            10.2.1.2. Canada

        10.2.2. By Product

        10.2.3. By Indication

        10.2.4. By Source

        10.2.5. By End Use

    10.3. Market Attractiveness Analysis

        10.3.1. By Country

        10.3.2. By Product

        10.3.3. By Indication

        10.3.4. By Source

        10.3.5. By End Use

    10.4. Key Takeaways

11. Latin America Market Analysis 2018 to 2022 and Forecast 2023 to 2033, By Country

    11.1. Historical Market Size Value (US$ Million) Trend Analysis By Market Taxonomy, 2018 to 2022

    11.2. Market Size Value (US$ Million) Forecast By Market Taxonomy, 2023 to 2033

        11.2.1. By Country

            11.2.1.1. Brazil

            11.2.1.2. Mexico

            11.2.1.3. Rest of Latin America

        11.2.2. By Product

        11.2.3. By Indication

        11.2.4. By Source

        11.2.5. By End Use

    11.3. Market Attractiveness Analysis

        11.3.1. By Country

        11.3.2. By Product

        11.3.3. By Indication

        11.3.4. By Source

        11.3.5. By End Use

    11.4. Key Takeaways

12. Western Europe Market Analysis 2018 to 2022 and Forecast 2023 to 2033, By Country

    12.1. Historical Market Size Value (US$ Million) Trend Analysis By Market Taxonomy, 2018 to 2022

    12.2. Market Size Value (US$ Million) Forecast By Market Taxonomy, 2023 to 2033

        12.2.1. By Country

            12.2.1.1. Germany

            12.2.1.2. United Kingdom

            12.2.1.3. France

            12.2.1.4. Spain

            12.2.1.5. Italy

            12.2.1.6. Rest of Western Europe

        12.2.2. By Product

        12.2.3. By Indication

        12.2.4. By Source

        12.2.5. By End Use

    12.3. Market Attractiveness Analysis

        12.3.1. By Country

        12.3.2. By Product

        12.3.3. By Indication

        12.3.4. By Source

        12.3.5. By End Use

    12.4. Key Takeaways

13. Eastern Europe Market Analysis 2018 to 2022 and Forecast 2023 to 2033, By Country

    13.1. Historical Market Size Value (US$ Million) Trend Analysis By Market Taxonomy, 2018 to 2022

    13.2. Market Size Value (US$ Million) Forecast By Market Taxonomy, 2023 to 2033

        13.2.1. By Country

            13.2.1.1. Poland

            13.2.1.2. Russia

            13.2.1.3. Czech Republic

            13.2.1.4. Romania

            13.2.1.5. Rest of Eastern Europe

        13.2.2. By Product

        13.2.3. By Indication

        13.2.4. By Source

        13.2.5. By End Use

    13.3. Market Attractiveness Analysis

        13.3.1. By Country

        13.3.2. By Product

        13.3.3. By Indication

        13.3.4. By Source

        13.3.5. By End Use

    13.4. Key Takeaways

14. South Asia and Pacific Market Analysis 2018 to 2022 and Forecast 2023 to 2033, By Country

    14.1. Historical Market Size Value (US$ Million) Trend Analysis By Market Taxonomy, 2018 to 2022

    14.2. Market Size Value (US$ Million) Forecast By Market Taxonomy, 2023 to 2033

        14.2.1. By Country

            14.2.1.1. India

            14.2.1.2. Bangladesh

            14.2.1.3. Australia

            14.2.1.4. New Zealand

            14.2.1.5. Rest of South Asia and Pacific

        14.2.2. By Product

        14.2.3. By Indication

        14.2.4. By Source

        14.2.5. By End Use

    14.3. Market Attractiveness Analysis

        14.3.1. By Country

        14.3.2. By Product

        14.3.3. By Indication

        14.3.4. By Source

        14.3.5. By End Use

    14.4. Key Takeaways

15. East Asia Market Analysis 2018 to 2022 and Forecast 2023 to 2033, By Country

    15.1. Historical Market Size Value (US$ Million) Trend Analysis By Market Taxonomy, 2018 to 2022

    15.2. Market Size Value (US$ Million) Forecast By Market Taxonomy, 2023 to 2033

        15.2.1. By Country

            15.2.1.1. China

            15.2.1.2. Japan

            15.2.1.3. South Korea

        15.2.2. By Product

        15.2.3. By Indication

        15.2.4. By Source

        15.2.5. By End Use

    15.3. Market Attractiveness Analysis

        15.3.1. By Country

        15.3.2. By Product

        15.3.3. By Indication

        15.3.4. By Source

        15.3.5. By End Use

    15.4. Key Takeaways

16. Middle East and Africa Market Analysis 2018 to 2022 and Forecast 2023 to 2033, By Country

    16.1. Historical Market Size Value (US$ Million) Trend Analysis By Market Taxonomy, 2018 to 2022

    16.2. Market Size Value (US$ Million) Forecast By Market Taxonomy, 2023 to 2033

        16.2.1. By Country

            16.2.1.1. GCC Countries

            16.2.1.2. South Africa

            16.2.1.3. Israel

            16.2.1.4. Rest of MEA

        16.2.2. By Product

        16.2.3. By Indication

        16.2.4. By Source

        16.2.5. By End Use

    16.3. Market Attractiveness Analysis

        16.3.1. By Country

        16.3.2. By Product

        16.3.3. By Indication

        16.3.4. By Source

        16.3.5. By End Use

    16.4. Key Takeaways

17. Key Countries Market Analysis

    17.1. USA

        17.1.1. Pricing Analysis

        17.1.2. Market Share Analysis, 2022

            17.1.2.1. By Product

            17.1.2.2. By Indication

            17.1.2.3. By Source

            17.1.2.4. By End Use

    17.2. Canada

        17.2.1. Pricing Analysis

        17.2.2. Market Share Analysis, 2022

            17.2.2.1. By Product

            17.2.2.2. By Indication

            17.2.2.3. By Source

            17.2.2.4. By End Use

    17.3. Brazil

        17.3.1. Pricing Analysis

        17.3.2. Market Share Analysis, 2022

            17.3.2.1. By Product

            17.3.2.2. By Indication

            17.3.2.3. By Source

            17.3.2.4. By End Use

    17.4. Mexico

        17.4.1. Pricing Analysis

        17.4.2. Market Share Analysis, 2022

            17.4.2.1. By Product

            17.4.2.2. By Indication

            17.4.2.3. By Source

            17.4.2.4. By End Use

    17.5. Germany

        17.5.1. Pricing Analysis

        17.5.2. Market Share Analysis, 2022

            17.5.2.1. By Product

            17.5.2.2. By Indication

            17.5.2.3. By Source

            17.5.2.4. By End Use

    17.6. United Kingdom

        17.6.1. Pricing Analysis

        17.6.2. Market Share Analysis, 2022

            17.6.2.1. By Product

            17.6.2.2. By Indication

            17.6.2.3. By Source

            17.6.2.4. By End Use

    17.7. France

        17.7.1. Pricing Analysis

        17.7.2. Market Share Analysis, 2022

            17.7.2.1. By Product

            17.7.2.2. By Indication

            17.7.2.3. By Source

            17.7.2.4. By End Use

    17.8. Spain

        17.8.1. Pricing Analysis

        17.8.2. Market Share Analysis, 2022

            17.8.2.1. By Product

            17.8.2.2. By Indication

            17.8.2.3. By Source

            17.8.2.4. By End Use

    17.9. Italy

        17.9.1. Pricing Analysis

        17.9.2. Market Share Analysis, 2022

            17.9.2.1. By Product

            17.9.2.2. By Indication

            17.9.2.3. By Source

            17.9.2.4. By End Use

    17.10. Poland

        17.10.1. Pricing Analysis

        17.10.2. Market Share Analysis, 2022

            17.10.2.1. By Product

            17.10.2.2. By Indication

            17.10.2.3. By Source

            17.10.2.4. By End Use

    17.11. Russia

        17.11.1. Pricing Analysis

        17.11.2. Market Share Analysis, 2022

            17.11.2.1. By Product

            17.11.2.2. By Indication

            17.11.2.3. By Source

            17.11.2.4. By End Use

    17.12. Czech Republic

        17.12.1. Pricing Analysis

        17.12.2. Market Share Analysis, 2022

            17.12.2.1. By Product

            17.12.2.2. By Indication

            17.12.2.3. By Source

            17.12.2.4. By End Use

    17.13. Romania

        17.13.1. Pricing Analysis

        17.13.2. Market Share Analysis, 2022

            17.13.2.1. By Product

            17.13.2.2. By Indication

            17.13.2.3. By Source

            17.13.2.4. By End Use

    17.14. India

        17.14.1. Pricing Analysis

        17.14.2. Market Share Analysis, 2022

            17.14.2.1. By Product

            17.14.2.2. By Indication

            17.14.2.3. By Source

            17.14.2.4. By End Use

    17.15. Bangladesh

        17.15.1. Pricing Analysis

        17.15.2. Market Share Analysis, 2022

            17.15.2.1. By Product

            17.15.2.2. By Indication

            17.15.2.3. By Source

            17.15.2.4. By End Use

    17.16. Australia

        17.16.1. Pricing Analysis

        17.16.2. Market Share Analysis, 2022

            17.16.2.1. By Product

            17.16.2.2. By Indication

            17.16.2.3. By Source

            17.16.2.4. By End Use

    17.17. New Zealand

        17.17.1. Pricing Analysis

        17.17.2. Market Share Analysis, 2022

            17.17.2.1. By Product

            17.17.2.2. By Indication

            17.17.2.3. By Source

            17.17.2.4. By End Use

    17.18. China

        17.18.1. Pricing Analysis

        17.18.2. Market Share Analysis, 2022

            17.18.2.1. By Product

            17.18.2.2. By Indication

            17.18.2.3. By Source

            17.18.2.4. By End Use

    17.19. Japan

        17.19.1. Pricing Analysis

        17.19.2. Market Share Analysis, 2022

            17.19.2.1. By Product

            17.19.2.2. By Indication

            17.19.2.3. By Source

            17.19.2.4. By End Use

    17.20. South Korea

        17.20.1. Pricing Analysis

        17.20.2. Market Share Analysis, 2022

            17.20.2.1. By Product

            17.20.2.2. By Indication

            17.20.2.3. By Source

            17.20.2.4. By End Use

    17.21. GCC Countries

        17.21.1. Pricing Analysis

        17.21.2. Market Share Analysis, 2022

            17.21.2.1. By Product

            17.21.2.2. By Indication

            17.21.2.3. By Source

            17.21.2.4. By End Use

    17.22. South Africa

        17.22.1. Pricing Analysis

        17.22.2. Market Share Analysis, 2022

            17.22.2.1. By Product

            17.22.2.2. By Indication

            17.22.2.3. By Source

            17.22.2.4. By End Use

    17.23. Israel

        17.23.1. Pricing Analysis

        17.23.2. Market Share Analysis, 2022

            17.23.2.1. By Product

            17.23.2.2. By Indication

            17.23.2.3. By Source

            17.23.2.4. By End Use

18. Market Structure Analysis

    18.1. Competition Dashboard

    18.2. Competition Benchmarking

    18.3. Market Share Analysis of Top Players

        18.3.1. By Regional

        18.3.2. By Product

        18.3.3. By Indication

        18.3.4. By Source

        18.3.5. By End Use

19. Competition Analysis

    19.1. Competition Deep Dive

        19.1.1. Smiling Mind

            19.1.1.1. Overview

            19.1.1.2. Product Portfolio

            19.1.1.3. Profitability by Market Segments

            19.1.1.4. Sales Footprint

            19.1.1.5. Strategy Overview

                19.1.1.5.1. Marketing Strategy

        19.1.2. Inner Explorer Inc.

            19.1.2.1. Overview

            19.1.2.2. Product Portfolio

            19.1.2.3. Profitability by Market Segments

            19.1.2.4. Sales Footprint

            19.1.2.5. Strategy Overview

                19.1.2.5.1. Marketing Strategy

        19.1.3. Committee for Children

            19.1.3.1. Overview

            19.1.3.2. Product Portfolio

            19.1.3.3. Profitability by Market Segments

            19.1.3.4. Sales Footprint

            19.1.3.5. Strategy Overview

                19.1.3.5.1. Marketing Strategy

        19.1.4. Stop, Breathe & Think PBC

            19.1.4.1. Overview

            19.1.4.2. Product Portfolio

            19.1.4.3. Profitability by Market Segments

            19.1.4.4. Sales Footprint

            19.1.4.5. Strategy Overview

                19.1.4.5.1. Marketing Strategy

        19.1.5. Simple Habit, Inc.

            19.1.5.1. Overview

            19.1.5.2. Product Portfolio

            19.1.5.3. Profitability by Market Segments

            19.1.5.4. Sales Footprint

            19.1.5.5. Strategy Overview

                19.1.5.5.1. Marketing Strategy

        19.1.6. Calm, Headspace Inc.

            19.1.6.1. Overview

            19.1.6.2. Product Portfolio

            19.1.6.3. Profitability by Market Segments

            19.1.6.4. Sales Footprint

            19.1.6.5. Strategy Overview

                19.1.6.5.1. Marketing Strategy

        19.1.7. Inscape

            19.1.7.1. Overview

            19.1.7.2. Product Portfolio

            19.1.7.3. Profitability by Market Segments

            19.1.7.4. Sales Footprint

            19.1.7.5. Strategy Overview

                19.1.7.5.1. Marketing Strategy

        19.1.8. Insight Network Inc.

            19.1.8.1. Overview

            19.1.8.2. Product Portfolio

            19.1.8.3. Profitability by Market Segments

            19.1.8.4. Sales Footprint

            19.1.8.5. Strategy Overview

                19.1.8.5.1. Marketing Strategy

        19.1.9. Waking Up, LLC

            19.1.9.1. Overview

            19.1.9.2. Product Portfolio

            19.1.9.3. Profitability by Market Segments

            19.1.9.4. Sales Footprint

            19.1.9.5. Strategy Overview

                19.1.9.5.1. Marketing Strategy

        19.1.10. FeelVeryBien, s.a.s.

            19.1.10.1. Overview

            19.1.10.2. Product Portfolio

            19.1.10.3. Profitability by Market Segments

            19.1.10.4. Sales Footprint

            19.1.10.5. Strategy Overview

                19.1.10.5.1. Marketing Strategy

        19.1.11. MEDITOPIA

            19.1.11.1. Overview

            19.1.11.2. Product Portfolio

            19.1.11.3. Profitability by Market Segments

            19.1.11.4. Sales Footprint

            19.1.11.5. Strategy Overview

                19.1.11.5.1. Marketing Strategy

        19.1.12. BetterMe

            19.1.12.1. Overview

            19.1.12.2. Product Portfolio

            19.1.12.3. Profitability by Market Segments

            19.1.12.4. Sales Footprint

            19.1.12.5. Strategy Overview

                19.1.12.5.1. Marketing Strategy

        19.1.13. Aura Health

            19.1.13.1. Overview

            19.1.13.2. Product Portfolio

            19.1.13.3. Profitability by Market Segments

            19.1.13.4. Sales Footprint

            19.1.13.5. Strategy Overview

                19.1.13.5.1. Marketing Strategy

        19.1.14. Sanity & Self

            19.1.14.1. Overview

            19.1.14.2. Product Portfolio

            19.1.14.3. Profitability by Market Segments

            19.1.14.4. Sales Footprint

            19.1.14.5. Strategy Overview

                19.1.14.5.1. Marketing Strategy

        19.1.15. TEN PERCENT HAPPIER

            19.1.15.1. Overview

            19.1.15.2. Product Portfolio

            19.1.15.3. Profitability by Market Segments

            19.1.15.4. Sales Footprint

            19.1.15.5. Strategy Overview

                19.1.15.5.1. Marketing Strategy

        19.1.16. Inward Inc

            19.1.16.1. Overview

            19.1.16.2. Product Portfolio

            19.1.16.3. Profitability by Market Segments

            19.1.16.4. Sales Footprint

            19.1.16.5. Strategy Overview

                19.1.16.5.1. Marketing Strategy

        19.1.17. Portal Labs Ltd.

            19.1.17.1. Overview

            19.1.17.2. Product Portfolio

            19.1.17.3. Profitability by Market Segments

            19.1.17.4. Sales Footprint

            19.1.17.5. Strategy Overview

                19.1.17.5.1. Marketing Strategy

        19.1.18. MOBIO INTERACTIVE

            19.1.18.1. Overview

            19.1.18.2. Product Portfolio

            19.1.18.3. Profitability by Market Segments

            19.1.18.4. Sales Footprint

            19.1.18.5. Strategy Overview

                19.1.18.5.1. Marketing Strategy

        19.1.19. Mindfulness Everywhere

            19.1.19.1. Overview

            19.1.19.2. Product Portfolio

            19.1.19.3. Profitability by Market Segments

            19.1.19.4. Sales Footprint

            19.1.19.5. Strategy Overview

                19.1.19.5.1. Marketing Strategy

20. Assumptions & Acronyms Used

21. Research Methodology

Don't pay for what you don't need

Customize your report by selecting specific countries or regions and save 30%!

List of Tables

Table 1: Global Market Value (US$ Million) Forecast by Region, 2018 to 2033

Table 2: Global Market Value (US$ Million) Forecast by Product, 2018 to 2033

Table 3: Global Market Value (US$ Million) Forecast by Indication, 2018 to 2033

Table 4: Global Market Value (US$ Million) Forecast by Source, 2018 to 2033

Table 5: Global Market Value (US$ Million) Forecast by End Use, 2018 to 2033

Table 6: North America Market Value (US$ Million) Forecast by Country, 2018 to 2033

Table 7: North America Market Value (US$ Million) Forecast by Product, 2018 to 2033

Table 8: North America Market Value (US$ Million) Forecast by Indication, 2018 to 2033

Table 9: North America Market Value (US$ Million) Forecast by Source, 2018 to 2033

Table 10: North America Market Value (US$ Million) Forecast by End Use, 2018 to 2033

Table 11: Latin America Market Value (US$ Million) Forecast by Country, 2018 to 2033

Table 12: Latin America Market Value (US$ Million) Forecast by Product, 2018 to 2033

Table 13: Latin America Market Value (US$ Million) Forecast by Indication, 2018 to 2033

Table 14: Latin America Market Value (US$ Million) Forecast by Source, 2018 to 2033

Table 15: Latin America Market Value (US$ Million) Forecast by End Use, 2018 to 2033

Table 16: Western Europe Market Value (US$ Million) Forecast by Country, 2018 to 2033

Table 17: Western Europe Market Value (US$ Million) Forecast by Product, 2018 to 2033

Table 18: Western Europe Market Value (US$ Million) Forecast by Indication, 2018 to 2033

Table 19: Western Europe Market Value (US$ Million) Forecast by Source, 2018 to 2033

Table 20: Western Europe Market Value (US$ Million) Forecast by End Use, 2018 to 2033

Table 21: Eastern Europe Market Value (US$ Million) Forecast by Country, 2018 to 2033

Table 22: Eastern Europe Market Value (US$ Million) Forecast by Product, 2018 to 2033

Table 23: Eastern Europe Market Value (US$ Million) Forecast by Indication, 2018 to 2033

Table 24: Eastern Europe Market Value (US$ Million) Forecast by Source, 2018 to 2033

Table 25: Eastern Europe Market Value (US$ Million) Forecast by End Use, 2018 to 2033

Table 26: South Asia and Pacific Market Value (US$ Million) Forecast by Country, 2018 to 2033

Table 27: South Asia and Pacific Market Value (US$ Million) Forecast by Product, 2018 to 2033

Table 28: South Asia and Pacific Market Value (US$ Million) Forecast by Indication, 2018 to 2033

Table 29: South Asia and Pacific Market Value (US$ Million) Forecast by Source, 2018 to 2033

Table 30: South Asia and Pacific Market Value (US$ Million) Forecast by End Use, 2018 to 2033

Table 31: East Asia Market Value (US$ Million) Forecast by Country, 2018 to 2033

Table 32: East Asia Market Value (US$ Million) Forecast by Product, 2018 to 2033

Table 33: East Asia Market Value (US$ Million) Forecast by Indication, 2018 to 2033

Table 34: East Asia Market Value (US$ Million) Forecast by Source, 2018 to 2033

Table 35: East Asia Market Value (US$ Million) Forecast by End Use, 2018 to 2033

Table 36: Middle East and Africa Market Value (US$ Million) Forecast by Country, 2018 to 2033

Table 37: Middle East and Africa Market Value (US$ Million) Forecast by Product, 2018 to 2033

Table 38: Middle East and Africa Market Value (US$ Million) Forecast by Indication, 2018 to 2033

Table 39: Middle East and Africa Market Value (US$ Million) Forecast by Source, 2018 to 2033

Table 40: Middle East and Africa Market Value (US$ Million) Forecast by End Use, 2018 to 2033
Ronak Shah
Ronak Shah

Principal Consultant

Talk to Analyst

Find your sweet spots for generating winning opportunities in this market.

List of Charts

Figure 1: Global Market Value (US$ Million) by Product, 2023 to 2033

Figure 2: Global Market Value (US$ Million) by Indication, 2023 to 2033

Figure 3: Global Market Value (US$ Million) by Source, 2023 to 2033

Figure 4: Global Market Value (US$ Million) by End Use, 2023 to 2033

Figure 5: Global Market Value (US$ Million) by Region, 2023 to 2033

Figure 6: Global Market Value (US$ Million) Analysis by Region, 2018 to 2033

Figure 7: Global Market Value Share (%) and BPS Analysis by Region, 2023 to 2033

Figure 8: Global Market Y-o-Y Growth (%) Projections by Region, 2023 to 2033

Figure 9: Global Market Value (US$ Million) Analysis by Product, 2018 to 2033

Figure 10: Global Market Value Share (%) and BPS Analysis by Product, 2023 to 2033

Figure 11: Global Market Y-o-Y Growth (%) Projections by Product, 2023 to 2033

Figure 12: Global Market Value (US$ Million) Analysis by Indication, 2018 to 2033

Figure 13: Global Market Value Share (%) and BPS Analysis by Indication, 2023 to 2033

Figure 14: Global Market Y-o-Y Growth (%) Projections by Indication, 2023 to 2033

Figure 15: Global Market Value (US$ Million) Analysis by Source, 2018 to 2033

Figure 16: Global Market Value Share (%) and BPS Analysis by Source, 2023 to 2033

Figure 17: Global Market Y-o-Y Growth (%) Projections by Source, 2023 to 2033

Figure 18: Global Market Value (US$ Million) Analysis by End Use, 2018 to 2033

Figure 19: Global Market Value Share (%) and BPS Analysis by End Use, 2023 to 2033

Figure 20: Global Market Y-o-Y Growth (%) Projections by End Use, 2023 to 2033

Figure 21: Global Market Attractiveness by Product, 2023 to 2033

Figure 22: Global Market Attractiveness by Indication, 2023 to 2033

Figure 23: Global Market Attractiveness by Source, 2023 to 2033

Figure 24: Global Market Attractiveness by End Use, 2023 to 2033

Figure 25: Global Market Attractiveness by Region, 2023 to 2033

Figure 26: North America Market Value (US$ Million) by Product, 2023 to 2033

Figure 27: North America Market Value (US$ Million) by Indication, 2023 to 2033

Figure 28: North America Market Value (US$ Million) by Source, 2023 to 2033

Figure 29: North America Market Value (US$ Million) by End Use, 2023 to 2033

Figure 30: North America Market Value (US$ Million) by Country, 2023 to 2033

Figure 31: North America Market Value (US$ Million) Analysis by Country, 2018 to 2033

Figure 32: North America Market Value Share (%) and BPS Analysis by Country, 2023 to 2033

Figure 33: North America Market Y-o-Y Growth (%) Projections by Country, 2023 to 2033

Figure 34: North America Market Value (US$ Million) Analysis by Product, 2018 to 2033

Figure 35: North America Market Value Share (%) and BPS Analysis by Product, 2023 to 2033

Figure 36: North America Market Y-o-Y Growth (%) Projections by Product, 2023 to 2033

Figure 37: North America Market Value (US$ Million) Analysis by Indication, 2018 to 2033

Figure 38: North America Market Value Share (%) and BPS Analysis by Indication, 2023 to 2033

Figure 39: North America Market Y-o-Y Growth (%) Projections by Indication, 2023 to 2033

Figure 40: North America Market Value (US$ Million) Analysis by Source, 2018 to 2033

Figure 41: North America Market Value Share (%) and BPS Analysis by Source, 2023 to 2033

Figure 42: North America Market Y-o-Y Growth (%) Projections by Source, 2023 to 2033

Figure 43: North America Market Value (US$ Million) Analysis by End Use, 2018 to 2033

Figure 44: North America Market Value Share (%) and BPS Analysis by End Use, 2023 to 2033

Figure 45: North America Market Y-o-Y Growth (%) Projections by End Use, 2023 to 2033

Figure 46: North America Market Attractiveness by Product, 2023 to 2033

Figure 47: North America Market Attractiveness by Indication, 2023 to 2033

Figure 48: North America Market Attractiveness by Source, 2023 to 2033

Figure 49: North America Market Attractiveness by End Use, 2023 to 2033

Figure 50: North America Market Attractiveness by Country, 2023 to 2033

Figure 51: Latin America Market Value (US$ Million) by Product, 2023 to 2033

Figure 52: Latin America Market Value (US$ Million) by Indication, 2023 to 2033

Figure 53: Latin America Market Value (US$ Million) by Source, 2023 to 2033

Figure 54: Latin America Market Value (US$ Million) by End Use, 2023 to 2033

Figure 55: Latin America Market Value (US$ Million) by Country, 2023 to 2033

Figure 56: Latin America Market Value (US$ Million) Analysis by Country, 2018 to 2033

Figure 57: Latin America Market Value Share (%) and BPS Analysis by Country, 2023 to 2033

Figure 58: Latin America Market Y-o-Y Growth (%) Projections by Country, 2023 to 2033

Figure 59: Latin America Market Value (US$ Million) Analysis by Product, 2018 to 2033

Figure 60: Latin America Market Value Share (%) and BPS Analysis by Product, 2023 to 2033

Figure 61: Latin America Market Y-o-Y Growth (%) Projections by Product, 2023 to 2033

Figure 62: Latin America Market Value (US$ Million) Analysis by Indication, 2018 to 2033

Figure 63: Latin America Market Value Share (%) and BPS Analysis by Indication, 2023 to 2033

Figure 64: Latin America Market Y-o-Y Growth (%) Projections by Indication, 2023 to 2033

Figure 65: Latin America Market Value (US$ Million) Analysis by Source, 2018 to 2033

Figure 66: Latin America Market Value Share (%) and BPS Analysis by Source, 2023 to 2033

Figure 67: Latin America Market Y-o-Y Growth (%) Projections by Source, 2023 to 2033

Figure 68: Latin America Market Value (US$ Million) Analysis by End Use, 2018 to 2033

Figure 69: Latin America Market Value Share (%) and BPS Analysis by End Use, 2023 to 2033

Figure 70: Latin America Market Y-o-Y Growth (%) Projections by End Use, 2023 to 2033

Figure 71: Latin America Market Attractiveness by Product, 2023 to 2033

Figure 72: Latin America Market Attractiveness by Indication, 2023 to 2033

Figure 73: Latin America Market Attractiveness by Source, 2023 to 2033

Figure 74: Latin America Market Attractiveness by End Use, 2023 to 2033

Figure 75: Latin America Market Attractiveness by Country, 2023 to 2033

Figure 76: Western Europe Market Value (US$ Million) by Product, 2023 to 2033

Figure 77: Western Europe Market Value (US$ Million) by Indication, 2023 to 2033

Figure 78: Western Europe Market Value (US$ Million) by Source, 2023 to 2033

Figure 79: Western Europe Market Value (US$ Million) by End Use, 2023 to 2033

Figure 80: Western Europe Market Value (US$ Million) by Country, 2023 to 2033

Figure 81: Western Europe Market Value (US$ Million) Analysis by Country, 2018 to 2033

Figure 82: Western Europe Market Value Share (%) and BPS Analysis by Country, 2023 to 2033

Figure 83: Western Europe Market Y-o-Y Growth (%) Projections by Country, 2023 to 2033

Figure 84: Western Europe Market Value (US$ Million) Analysis by Product, 2018 to 2033

Figure 85: Western Europe Market Value Share (%) and BPS Analysis by Product, 2023 to 2033

Figure 86: Western Europe Market Y-o-Y Growth (%) Projections by Product, 2023 to 2033

Figure 87: Western Europe Market Value (US$ Million) Analysis by Indication, 2018 to 2033

Figure 88: Western Europe Market Value Share (%) and BPS Analysis by Indication, 2023 to 2033

Figure 89: Western Europe Market Y-o-Y Growth (%) Projections by Indication, 2023 to 2033

Figure 90: Western Europe Market Value (US$ Million) Analysis by Source, 2018 to 2033

Figure 91: Western Europe Market Value Share (%) and BPS Analysis by Source, 2023 to 2033

Figure 92: Western Europe Market Y-o-Y Growth (%) Projections by Source, 2023 to 2033

Figure 93: Western Europe Market Value (US$ Million) Analysis by End Use, 2018 to 2033

Figure 94: Western Europe Market Value Share (%) and BPS Analysis by End Use, 2023 to 2033

Figure 95: Western Europe Market Y-o-Y Growth (%) Projections by End Use, 2023 to 2033

Figure 96: Western Europe Market Attractiveness by Product, 2023 to 2033

Figure 97: Western Europe Market Attractiveness by Indication, 2023 to 2033

Figure 98: Western Europe Market Attractiveness by Source, 2023 to 2033

Figure 99: Western Europe Market Attractiveness by End Use, 2023 to 2033

Figure 100: Western Europe Market Attractiveness by Country, 2023 to 2033

Figure 101: Eastern Europe Market Value (US$ Million) by Product, 2023 to 2033

Figure 102: Eastern Europe Market Value (US$ Million) by Indication, 2023 to 2033

Figure 103: Eastern Europe Market Value (US$ Million) by Source, 2023 to 2033

Figure 104: Eastern Europe Market Value (US$ Million) by End Use, 2023 to 2033

Figure 105: Eastern Europe Market Value (US$ Million) by Country, 2023 to 2033

Figure 106: Eastern Europe Market Value (US$ Million) Analysis by Country, 2018 to 2033

Figure 107: Eastern Europe Market Value Share (%) and BPS Analysis by Country, 2023 to 2033

Figure 108: Eastern Europe Market Y-o-Y Growth (%) Projections by Country, 2023 to 2033

Figure 109: Eastern Europe Market Value (US$ Million) Analysis by Product, 2018 to 2033

Figure 110: Eastern Europe Market Value Share (%) and BPS Analysis by Product, 2023 to 2033

Figure 111: Eastern Europe Market Y-o-Y Growth (%) Projections by Product, 2023 to 2033

Figure 112: Eastern Europe Market Value (US$ Million) Analysis by Indication, 2018 to 2033

Figure 113: Eastern Europe Market Value Share (%) and BPS Analysis by Indication, 2023 to 2033

Figure 114: Eastern Europe Market Y-o-Y Growth (%) Projections by Indication, 2023 to 2033

Figure 115: Eastern Europe Market Value (US$ Million) Analysis by Source, 2018 to 2033

Figure 116: Eastern Europe Market Value Share (%) and BPS Analysis by Source, 2023 to 2033

Figure 117: Eastern Europe Market Y-o-Y Growth (%) Projections by Source, 2023 to 2033

Figure 118: Eastern Europe Market Value (US$ Million) Analysis by End Use, 2018 to 2033

Figure 119: Eastern Europe Market Value Share (%) and BPS Analysis by End Use, 2023 to 2033

Figure 120: Eastern Europe Market Y-o-Y Growth (%) Projections by End Use, 2023 to 2033

Figure 121: Eastern Europe Market Attractiveness by Product, 2023 to 2033

Figure 122: Eastern Europe Market Attractiveness by Indication, 2023 to 2033

Figure 123: Eastern Europe Market Attractiveness by Source, 2023 to 2033

Figure 124: Eastern Europe Market Attractiveness by End Use, 2023 to 2033

Figure 125: Eastern Europe Market Attractiveness by Country, 2023 to 2033

Figure 126: South Asia and Pacific Market Value (US$ Million) by Product, 2023 to 2033

Figure 127: South Asia and Pacific Market Value (US$ Million) by Indication, 2023 to 2033

Figure 128: South Asia and Pacific Market Value (US$ Million) by Source, 2023 to 2033

Figure 129: South Asia and Pacific Market Value (US$ Million) by End Use, 2023 to 2033

Figure 130: South Asia and Pacific Market Value (US$ Million) by Country, 2023 to 2033

Figure 131: South Asia and Pacific Market Value (US$ Million) Analysis by Country, 2018 to 2033

Figure 132: South Asia and Pacific Market Value Share (%) and BPS Analysis by Country, 2023 to 2033

Figure 133: South Asia and Pacific Market Y-o-Y Growth (%) Projections by Country, 2023 to 2033

Figure 134: South Asia and Pacific Market Value (US$ Million) Analysis by Product, 2018 to 2033

Figure 135: South Asia and Pacific Market Value Share (%) and BPS Analysis by Product, 2023 to 2033

Figure 136: South Asia and Pacific Market Y-o-Y Growth (%) Projections by Product, 2023 to 2033

Figure 137: South Asia and Pacific Market Value (US$ Million) Analysis by Indication, 2018 to 2033

Figure 138: South Asia and Pacific Market Value Share (%) and BPS Analysis by Indication, 2023 to 2033

Figure 139: South Asia and Pacific Market Y-o-Y Growth (%) Projections by Indication, 2023 to 2033

Figure 140: South Asia and Pacific Market Value (US$ Million) Analysis by Source, 2018 to 2033

Figure 141: South Asia and Pacific Market Value Share (%) and BPS Analysis by Source, 2023 to 2033

Figure 142: South Asia and Pacific Market Y-o-Y Growth (%) Projections by Source, 2023 to 2033

Figure 143: South Asia and Pacific Market Value (US$ Million) Analysis by End Use, 2018 to 2033

Figure 144: South Asia and Pacific Market Value Share (%) and BPS Analysis by End Use, 2023 to 2033

Figure 145: South Asia and Pacific Market Y-o-Y Growth (%) Projections by End Use, 2023 to 2033

Figure 146: South Asia and Pacific Market Attractiveness by Product, 2023 to 2033

Figure 147: South Asia and Pacific Market Attractiveness by Indication, 2023 to 2033

Figure 148: South Asia and Pacific Market Attractiveness by Source, 2023 to 2033

Figure 149: South Asia and Pacific Market Attractiveness by End Use, 2023 to 2033

Figure 150: South Asia and Pacific Market Attractiveness by Country, 2023 to 2033

Figure 151: East Asia Market Value (US$ Million) by Product, 2023 to 2033

Figure 152: East Asia Market Value (US$ Million) by Indication, 2023 to 2033

Figure 153: East Asia Market Value (US$ Million) by Source, 2023 to 2033

Figure 154: East Asia Market Value (US$ Million) by End Use, 2023 to 2033

Figure 155: East Asia Market Value (US$ Million) by Country, 2023 to 2033

Figure 156: East Asia Market Value (US$ Million) Analysis by Country, 2018 to 2033

Figure 157: East Asia Market Value Share (%) and BPS Analysis by Country, 2023 to 2033

Figure 158: East Asia Market Y-o-Y Growth (%) Projections by Country, 2023 to 2033

Figure 159: East Asia Market Value (US$ Million) Analysis by Product, 2018 to 2033

Figure 160: East Asia Market Value Share (%) and BPS Analysis by Product, 2023 to 2033

Figure 161: East Asia Market Y-o-Y Growth (%) Projections by Product, 2023 to 2033

Figure 162: East Asia Market Value (US$ Million) Analysis by Indication, 2018 to 2033

Figure 163: East Asia Market Value Share (%) and BPS Analysis by Indication, 2023 to 2033

Figure 164: East Asia Market Y-o-Y Growth (%) Projections by Indication, 2023 to 2033

Figure 165: East Asia Market Value (US$ Million) Analysis by Source, 2018 to 2033

Figure 166: East Asia Market Value Share (%) and BPS Analysis by Source, 2023 to 2033

Figure 167: East Asia Market Y-o-Y Growth (%) Projections by Source, 2023 to 2033

Figure 168: East Asia Market Value (US$ Million) Analysis by End Use, 2018 to 2033

Figure 169: East Asia Market Value Share (%) and BPS Analysis by End Use, 2023 to 2033

Figure 170: East Asia Market Y-o-Y Growth (%) Projections by End Use, 2023 to 2033

Figure 171: East Asia Market Attractiveness by Product, 2023 to 2033

Figure 172: East Asia Market Attractiveness by Indication, 2023 to 2033

Figure 173: East Asia Market Attractiveness by Source, 2023 to 2033

Figure 174: East Asia Market Attractiveness by End Use, 2023 to 2033

Figure 175: East Asia Market Attractiveness by Country, 2023 to 2033

Figure 176: Middle East and Africa Market Value (US$ Million) by Product, 2023 to 2033

Figure 177: Middle East and Africa Market Value (US$ Million) by Indication, 2023 to 2033

Figure 178: Middle East and Africa Market Value (US$ Million) by Source, 2023 to 2033

Figure 179: Middle East and Africa Market Value (US$ Million) by End Use, 2023 to 2033

Figure 180: Middle East and Africa Market Value (US$ Million) by Country, 2023 to 2033

Figure 181: Middle East and Africa Market Value (US$ Million) Analysis by Country, 2018 to 2033

Figure 182: Middle East and Africa Market Value Share (%) and BPS Analysis by Country, 2023 to 2033

Figure 183: Middle East and Africa Market Y-o-Y Growth (%) Projections by Country, 2023 to 2033

Figure 184: Middle East and Africa Market Value (US$ Million) Analysis by Product, 2018 to 2033

Figure 185: Middle East and Africa Market Value Share (%) and BPS Analysis by Product, 2023 to 2033

Figure 186: Middle East and Africa Market Y-o-Y Growth (%) Projections by Product, 2023 to 2033

Figure 187: Middle East and Africa Market Value (US$ Million) Analysis by Indication, 2018 to 2033

Figure 188: Middle East and Africa Market Value Share (%) and BPS Analysis by Indication, 2023 to 2033

Figure 189: Middle East and Africa Market Y-o-Y Growth (%) Projections by Indication, 2023 to 2033

Figure 190: Middle East and Africa Market Value (US$ Million) Analysis by Source, 2018 to 2033

Figure 191: Middle East and Africa Market Value Share (%) and BPS Analysis by Source, 2023 to 2033

Figure 192: Middle East and Africa Market Y-o-Y Growth (%) Projections by Source, 2023 to 2033

Figure 193: Middle East and Africa Market Value (US$ Million) Analysis by End Use, 2018 to 2033

Figure 194: Middle East and Africa Market Value Share (%) and BPS Analysis by End Use, 2023 to 2033

Figure 195: Middle East and Africa Market Y-o-Y Growth (%) Projections by End Use, 2023 to 2033

Figure 196: Middle East and Africa Market Attractiveness by Product, 2023 to 2033

Figure 197: Middle East and Africa Market Attractiveness by Indication, 2023 to 2033

Figure 198: Middle East and Africa Market Attractiveness by Source, 2023 to 2033

Figure 199: Middle East and Africa Market Attractiveness by End Use, 2023 to 2033

Figure 200: Middle East and Africa Market Attractiveness by Country, 2023 to 2033

Recommendations

Technology

Mindfulness Meditation Application Market

Published : March 2024

Travel and Tourism

Medical Tourism Market

Published : November 2023

Travel and Tourism

China Outbound MICE Tourism to US Market

Published : February 2023

Healthcare

North America Outbound Medical Tourism Services Market

Published : November 2016

Explore Travel and Tourism Insights

View Reports

Yoga and Meditation Market