

- Market Size (2026)
- USD 92.5 Bn
- Forecast (2036)
- USD 143.6 Bn
- CAGR (2026 to 2036)
- 4.5%
How big is Cheese Market in 2026?
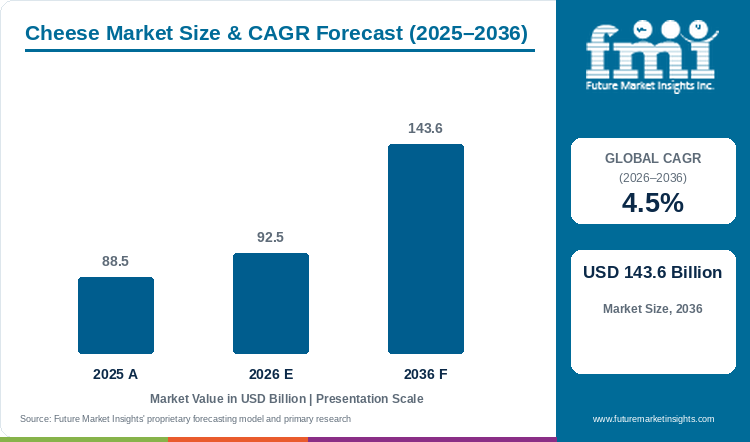
The cheese market is forecast to register a CAGR of 4.5% through 2036, with revenue increasing from USD 88.5 billion in 2025 to USD 92.5 billion in 2026 before reaching USD 143.6 billion by 2036.
Global cheese revenue increases from USD 88.5 billion in 2025 to USD 92.5 billion in 2026 and is projected to reach USD 143.6 billion by 2036, registering a 4.5% CAGR from 2026 to 2036 and generating USD 51.1 billion in added revenue. Commercial pizza ovens and fast-casual sandwich lines depend on coagulated curd loaves that slice cleanly and melt without oiling off under baking heat, which keeps plain unflavored cheese at 50.2% of flavor demand in 2026. In April 2026, the USDA National Agricultural Statistics Service reported that U.S. commercial cheese output reached 14.35 billion pounds in 2025 as Italian varieties climbed 5.1% to 6.33 billion pounds [1]. However, aging-cellar electricity expenses continue to restrain creamery margins.
Key Market Trends & Insights
- By flavor / type: Plain unflavored cheese led the market with a share of 50.2% in 2026, as unseasoned mozzarella and cheddar blocks integrate across both hot foodservice lines and household cooking.
- By distribution channel: Supermarkets and hypermarkets accounted for 41.0% in 2026, underpinned by multi-deck chilled grab-and-go cases and staffed specialty cut-to-order deli counters.
- By form: Slices, shreds, and blocks represented 36.4% of revenue in 2026, reflecting kitchen labor savings when restaurants and households buy pre-portioned formats.
Regional Highlights
- Fastest-growing evaluated country: Denmark, at 5.5% CAGR from 2026 to 2036.
- By country: Canada at 5.0%, Australia at 4.7%, the USA at 4.3%, and Germany at 4.0% follow, while France records the lowest evaluated CAGR at 3.6%.
Market Size & Forecast
Table 1: Market Size and Forecast for the Cheese Market (USD billion and CAGR percentage), 2025 to 2036
| Metric | Value |
|---|---|
| 2025 Market Size | USD 88.5 billion |
| Estimated Market Size in 2026 | USD 92.5 billion |
| Projected Market Size by 2036 | USD 143.6 billion |
| CAGR, 2026 to 2036 | 4.5% |
| Added Revenue, 2026 to 2036 | USD 51.1 billion |
Federal milk supply quotas in Canada and protected-origin cave maturation rules in France create very different vat economics from the export-driven ultrafiltration plants operating in Denmark and Australia. Industrial creameries are fortifying vat milk with concentrated milk protein retentates to raise curd yield per liter of raw milk while maintaining uniform moisture-to-protein ratios across batches. Biological safety evaluations updated by the European Food Safety Authority in May 2025 reaffirmed qualified status for starter and adjunct ripening cultures used in commercial cheese vats [2]. As a result, cheesemakers are pairing selected lactic cultures with automated vacuum block formers to shorten ripening cycles without sacrificing savory proteolysis.
Milk Coagulation and Curd Ripening Processing Metrics
Table 2: Milk Coagulation and Curd Ripening Processing Metrics for the Cheese Market (USD billion and operational metrics), mixed historical and forecast years from 2025 to 2036
| Metric | 2025 | 2026 | 2036 |
|---|---|---|---|
| Market size (USD billion) | 88.5 | 92.5 | 143.6 |
| Global Commercial Cheese Output (million metric tons) | 24.1 | 24.8 | 34.5 |
| Milk to Finished Hard Cheese Ratio (liters per kilogram) | 9.8 to 10.5 | 9.6 to 10.3 | 9.2 to 9.8 |
| Average Natural Aging Duration for Cheddar (months) | 3.0 to 12.0 | 3.0 to 12.0 | 2.5 to 10.0 |
Enclosed rennet coagulation vats and humidity-controlled ripening rooms balance milk-to-curd conversion ratios against aging duration for cheddar and pasta-filata loaves.
Commercial Foodservice & Retail Penetration Sizing
Quick-service pizza chains and fast-casual burger operators require pasta-filata mozzarella and cheddar loaves that deliver predictable blister formation and stretch under conveyor-oven heat. Supermarkets expand specialty deli islands stocked with regional European wheels alongside single-serve string cheese packs. Besides this, savory snack formulators incorporate spray-dried cheese powder into extruded corn puffs and ready-to-heat pasta sauces.
Table 3: Commercial Foodservice and Retail Spending Indicators for the Cheese Market (USD, kilograms, and percentages), mixed historical and forecast years from 2025 to 2036
| Metric | 2025 | 2026 | 2036 |
|---|---|---|---|
| Developed Market Per Capita Consumption (kilograms per year) | 18.2 | 18.7 | 23.4 |
| Annual Cheese Spend per Urban Household (USD) | 165.4 | 172.5 | 235.8 |
| Foodservice Pizza & Burger Cheese Volume Share (%) | 44.5% | 45.2% | 51.0% |
| Cold-Chain Ripening and Storage Cost Share of Wholesale Price (%) | 12.5% to 15.0% | 12.8% to 15.4% | 11.5% to 13.8% |
Table 4: Facility & Creamery Operational Spending Indicators for the Cheese Market (USD and operational units), mixed reporting years from 2024 to 2026
| Operational Spend Indicator | 2024 | 2025 | 2026 |
|---|---|---|---|
| Whole Milk Procurement Cost per Metric Ton of Cheese (USD) | 3,850.0 to 4,450.0 | 3,980.0 to 4,620.0 | 4,120.0 to 4,800.0 |
| Industrial Enclosed Cheese Vat Capital Cost (USD million) | 1.2 to 1.8 | 1.3 to 1.9 | 1.4 to 2.1 |
| Natural Microbial Rennet Cost per Production Batch (USD) | 310.0 to 460.0 | 330.0 to 490.0 | 350.0 to 520.0 |
| Modified Atmosphere Barrier Film Cost per 1,000 Packs (USD) | 28.0 to 38.0 | 30.0 to 41.0 | 32.0 to 44.0 |
Analyst Perspective
"Automated continuous block formers and melt-controlled mozzarella curds allow commercial creameries to capture high-volume foodservice and retail contracts. Aging-cellar electricity expenses and volatile farmgate milk pricing still compress margins across standard retail cheese lines."
- Nandini Roy Choudhury, Principal Consultant, Future Market Insights.
How is the cheese market segmented?
The cheese market is segmented by form, source, distribution channel, flavor / type, and region. In 2026, plain unflavored cheese is projected at 50.2% of flavor / type, supermarkets and hypermarkets at 41.0% of distribution channel, and slices, shreds, and blocks at 36.4% of form.
By form: Slices, shreds & blocks, wedges & wheels, spreads & portions, and specialty cuts.
By source: Bovine / cow milk dairy, sheep & goat milk dairy, and plant-based / vegan formulations.
By distribution channel: Supermarkets & hypermarkets, convenience stores, food service & restaurants, and specialty deli stores.
By flavor / type: Plain / unflavored, flavored & herb-infused, and smoked & spiced.
Why does Plain / Unflavored lead the flavor category?
Plain unflavored cheese is expected to hold 50.2% of flavor demand in 2026, linked to broad foodservice melting versatility.
Table 5: Flavor / Type Share for the Cheese Market (percentage share), 2026
| Flavor / Type | Share (2026) |
|---|---|
| Plain / Unflavored | 50.2% |
| Other Segments Combined | 49.8%* |
| Total | 100.0% |
*Calculated as the balance remaining after deducting the leading segment's reported share from 100.0%.
Table 6: Flavor / Type Leadership and Market Growth for the Cheese Market (segment and CAGR percentage), 2026 to 2036
| Metric | Value |
|---|---|
| Global CAGR (2026 to 2036) | 4.5% |
| Leading Segment | Plain / Unflavored |
Commercial kitchens and packaged-meal plants require a neutral dairy base that does not clash with proprietary sauces or bakery batters, keeping unseasoned mozzarella, cheddar, gouda, and emmental blocks at the top of creamery production schedules. Industrial converters also melt plain natural curds with emulsifying salts to manufacture processed cheese slices for high-speed burger assembly lines. Herb-infused and chili-spiced varieties appeal to household charcuterie boards, yet particulate spices cause uneven ultrasonic slicing blade wear and create allergen cross-contact changeovers that limit deployment across institutional catering lines.
- Plain unflavored cheese is expected to hold 50.2% of flavor / type revenue in 2026, linked to universal deployment across pizza ovens and prepared meals.
- In March 2025, the Food and Agriculture Organization updated its Codex Alimentarius dairy compositional standards for natural ripened cheese varieties in international trade [3].
What supports Supermarkets & Hypermarkets leadership in distribution channel?
Supermarkets and hypermarkets are set to command 41.0% of distribution channel volume in 2026, backed by specialty deli counter assortments.
Dual merchandising zones give large grocery chains a decisive advantage in retail cheese distribution: self-service chilled wall cases move everyday sliced and shredded packs, while staffed deli counters cut artisan wheels and stock spreadable cream cheese tubs. High weekly store footfall enables grocers to rotate temperature-sensitive soft-ripened cheeses before rind ammonia develops. Furthermore, supermarket private-label contracts allow large farmer cooperatives to run continuous twenty-four-hour slicing and thermoforming lines at high capacity utilization throughout the year.
- Supermarkets and hypermarkets are set to command 41.0% of distribution channel demand in 2026, backed by dual self-service dairy aisles and staffed artisan deli counters.
- In September 2025, the European Commission Milk Market Observatory documented that retail supermarket cheese scanner volumes across the European Union rose by 2.8% year-over-year [4].
How do Slices, Shreds & Blocks maintain the leading position by form?
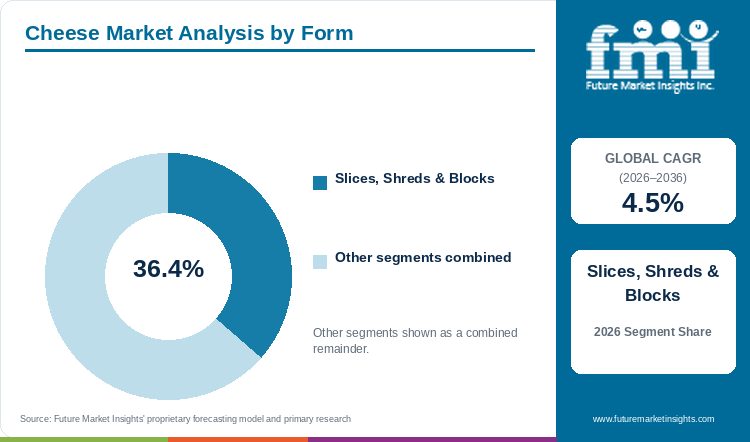
Slices, shreds, and blocks are projected to capture 36.4% of form sales in 2026, enabled by automated kitchen portioning speed.
Eliminating manual grating and knife portioning in both quick-service restaurants and home kitchens keeps pre-cut shingle slices, feathered shreds, and rectangular loaves ahead of whole wheels. High-speed ultrasonic slicers and centrifugal shredders dose cellulose or potato-starch anti-caking dust onto shreds before sealing them inside modified-atmosphere dairy packaging flushed with carbon dioxide and nitrogen. This protective gas balance inhibits surface mold growth during cold transit while preventing shredded mozzarella from clumping inside refrigerated restaurant prep tables.
- Slices, shreds, and blocks are projected to capture 36.4% of form revenue in 2026, enabled by exact weight control in commercial sandwiches and household pizza baking.
- In July 2025, the European Dairy Association reported that European cheese converters cut plastic film gauge by 15% across modified-atmosphere sliced cheese flow-packs [5].
What are the drivers, restraints, and opportunities in the cheese market?
In the cheese market, quick-service pizza and protein snacking drive volume, aging-cellar electricity and milk price volatility restrain margins, and clean-label artisanal and hybrid cheeses create premium value through 2036.
- Driver:Global expansion of quick-service pizza and burger chains alongside high-protein snacking will continue to drive natural curd demand through 2036.
- Restraint:Refrigerated ripening cellar electricity costs and volatile farmgate milk pricing will continue to pressure creamery margins through 2036.
- Opportunity:Scaling protected-origin artisan wheels and clean-label fermentation-derived rennet lines is expected to unlock higher export margins through 2036.
Growth Analysis and Future Potential: Qualitative Demand Catalysts
Fast-casual restaurant expansion and household preference for savory high-protein snacks are pulling larger milk volumes into commercial cheese vats worldwide. Multi-unit pizza and burger chains specify mozzarella and cheddar standardized with native micellar casein so every slice stretches uniformly without scorching under high-velocity impinger ovens. In April 2025, the National Restaurant Association reported that commercial foodservice pizza and cheeseburger menu transactions expanded by 4.9% across North American multi-unit operators [6]. Creameries must guarantee consistent shred melt-flow and blister geometry across year-round deliveries to retain national restaurant supply agreements.
Risk Assessment of the Cheese Market: Operational and Formulation Friction
Ripening hard cheddar and gouda wheels for three to twelve months inside climate-controlled cellars ties up working capital while consuming continuous refrigeration electricity. When seasonal heat stress reduces butterfat and protein levels in farmgate milk, vat coagulation slows and curd moisture drifts out of specification. In August 2025, the International Dairy Foods Association reported that commercial cold-storage warehousing and refrigeration energy expenses for North American cheese plants rose by 8.6% [7]. Furthermore, fluctuations in acid and rennet casein commodity prices expose industrial cheese processors to sudden raw-material cost squeezes when retail grocers lock in fixed annual shelf prices.
Commercial Opportunity Analysis: Formulation Differentiation and Value-Add Formats
Creameries are expanding gross margins by automating artisan cave-ripening environments and developing flexitarian dairy-and-plant hybrid blocks. In September 2025, a study in the International Journal of Dairy Technology demonstrated that ultrasonic brining and automated robotics in ripening rooms reduce salt uptake variance by 23% while trimming aging cellar energy loads across commercial facilities [8]. At the same time, specialty formulators are upgrading plant-based cheese alternatives with precision-fermented dairy caseins that replicate true stretch and melt for lactose-avoidant consumers. Producers that combine protected regional provenance with resealable shingle-pack convenience capture premium grocery deli facings.
Cheese Market by Country (2026 to 2036)
Export-oriented ultrafiltration creameries in Denmark post a 5.5% CAGR from 2026 to 2036, followed by quota-managed Canadian mozzarella plants at 5.0%, while mature table-cheese consumption in France grows at 3.6%. Vat operators across these jurisdictions use calcium caseinate emulsifiers and membrane filtration to protect curd yields against raw milk price swings.
Table 7: Country CAGR and Primary Growth Levers for the Cheese Market (CAGR percentage and operational drivers), 2026 to 2036
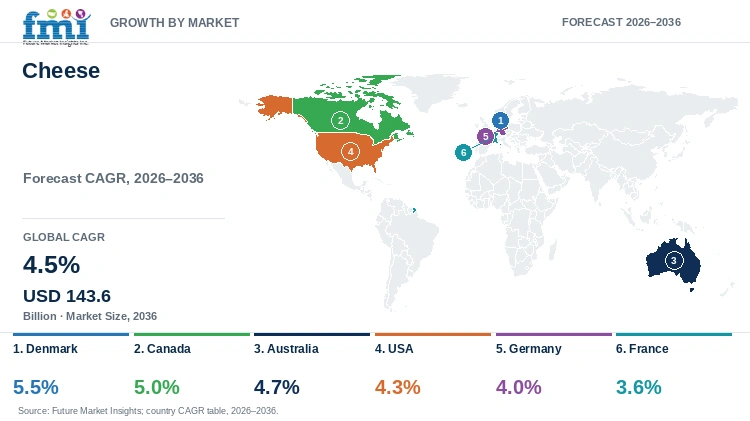
| Country | CAGR (2026 to 2036) | Primary Growth Lever |
|---|---|---|
| Denmark | 5.5% | Ultrafiltered white cheese and export-oriented specialty cream cheese hubs |
| Canada | 5.0% | Domestic pizza mozzarella vats and ethnic paneer under supply management |
| Australia | 4.7% | Pasture-fed cheddar blocks and chilled foodservice exports to Asia |
| USA | 4.3% | Mega-vat cheddar and mozzarella expansion and protein snack packs |
| Germany | 4.0% | High-speed sliced gouda and edam automation for European retail |
| France | 3.6% | Protected Designation of Origin cave ripening and gourmet export wheels |
Source: Future Market Insights analysis
Denmark Cheese Market Outlook (2026 to 2036)
Denmark's cheese sector is projected to advance at 5.5% CAGR from 2026 to 2036, propelled by high-yield membrane ultrafiltration and export-focused cream cheese and Castello specialty plants. Because Denmark exports over three-quarters of its dairy output, domestic creameries engineer shelf-stable white cheeses and havarti blocks tailored for international foodservice buyers. Production records from the Danish Agriculture and Food Council in September 2025 showed that Danish creameries manufactured 475,000 metric tons of cheese while expanding whey valorization capacity [9]. Statutory agricultural nitrogen and carbon taxes constrain domestic dairy herd expansion, compelling Danish cooperatives to extract higher cheese solids per liter of raw milk via reverse osmosis.
Key takeaway:Membrane ultrafiltration and export-driven cream and white cheese plants sustain Danish value growth despite domestic herd emission caps.
Canada Cheese Market Outlook (2026 to 2036)
Canada regulates industrial milk allocation through federal supply management, shielding domestic creameries from spot milk price crashes while capping tariff-free foreign cheese imports. Canadian Dairy Information Centre bulletins in June 2025 documented that domestic plants produced 520,000 metric tons of natural cheese across pizza mozzarella and cheddar vats [10]. Demand in the Canada cheese market is anticipated to rise at 5.0% CAGR through 2036, supported by quick-service restaurant pizza chains and rapid multicultural grocery demand for unripened paneer and curd cheese. Because bilateral trade quotas allow incremental specialty imports, Canadian processors are upgrading domestic artisan brie and washed-rind facilities.
Key takeaway:Pizza mozzarella contracts and multicultural demand for unripened paneer drive Canadian creamery expansion under federal supply management.
Australia Cheese Market Outlook (2026 to 2036)
Australian cheese processors capitalize on temperate ryegrass pastures and duty-free trade agreements to supply bulk cheddar and shredding mozzarella across Japanese and Southeast Asian bakery and restaurant chains. In October 2025, Dairy Australia confirmed that national cheese manufacturing reached 390,000 metric tons, accounting for the largest single use of Australian manufacturing milk [11]. Sales of cheese in Australia are forecast to expand at 4.7% CAGR through 2036, reinforced by Asian commercial bakery demand for cream cheese and domestic gourmet deli platters. Seasonal drought risk in the Murray-Darling Basin periodically tightens farmgate milk supply, prompting processors to lock in multi-year farm irrigation incentives.
Key takeaway:Export-oriented cream cheese and grass-fed cheddar contracts with Asian foodservice buyers anchor Australian creamery investment.
USA Cheese Market Outlook (2026 to 2036)
Massive greenfield cheddar and pasta-filata mozzarella complexes across Texas, Kansas, Wisconsin, and Idaho anchor the United States as the world's largest commercial cheese producer. Commodity tracking by the USDA Economic Research Service in February 2026 confirmed that domestic commercial cheese disappearance exceeded 14.1 billion pounds while export shipments set a record high [12]. The outlook for cheese in the USA remains positive, with sales projected to increase at 4.3% CAGR through 2036, aided by quick-service restaurant menu innovation alongside single-serve protein snacking trays. Weekly price swings on the Chicago Mercantile Exchange spot cheddar block market still create hedging challenges, leading converters to sign formula-priced foodservice supply contracts.
Key takeaway:Multi-million-pound mozzarella and cheddar complexes across the U.S. Central Plains fuel both domestic foodservice shredding and export volume.
Germany Cheese Market Outlook (2026 to 2036)
Germany operates the highest-volume cheese manufacturing sector in Europe, centered on automated gouda, edam, tilsiter, and fresh quark lines serving domestic supermarkets and intra-EU export trade. Federal Statistical Office Destatis figures released in December 2025 showed that German dairies produced 2.6 million metric tons of cheese across cooperative and private creameries [13]. Adoption of cheese in Germany is estimated to expand at 4.0% CAGR through 2036, aided by household consumption of pre-sliced breakfast cheeses and high-protein baking quark. Aggressive annual price negotiations with hard-discount grocery chains compress margins on standard blocks, pushing German cooperatives to invest in high-speed ultrasonic slicing and organic pasture-milk tiers.
Key takeaway:Ultrasonic slicing automation and pasture-certified gouda tiers protect German cooperative margins against discount grocery price pressure.
France Cheese Market Outlook (2026 to 2036)
France combines mature per-capita table cheese consumption with strict Appellation d'Origine Protégée terroir regulations that govern milk breed and cave maturation across Comté, Roquefort, Brie, and Camembert. In August 2025, the French Ministry of Agriculture and Food Sovereignty reported that national creameries produced 1.85 million metric tons of cheese, with protected-origin wheels commanding rising export premiums [14]. The France cheese sector is projected to record 3.6% CAGR during the assessment period, driven by culinary ingredient cheeses and international gourmet export demand. Strict EGalim farmgate price floors prevent processors from pushing raw-milk cost cuts onto farmers, encouraging French groups to expand high-margin portioned snacking formats.
Key takeaway:Protected-origin cave maturation and gourmet export wheels sustain French value expansion within a mature domestic table-cheese market.
Full report country CAGRs cover: North America; Latin America; Western Europe; Eastern Europe; East Asia; South Asia and Pacific; Middle East and Africa.
Who are the notable companies in the cheese market?
Lactalis Group, Fonterra Co-operative Group, Royal FrieslandCampina N.V., Arla Foods amba, Saputo Inc., Savencia Fromage & Dairy, The Kraft Heinz Company, Kerry Group plc, Glanbia plc, and Associated British Foods plc are the notable companies in this market.
High-volume curd production and specialty deli supply bring together multinational dairy processors, farmer-owned mega-cooperatives, and functional cheese ingredient formulators. Global dairy corporations operate multi-continent mozzarella, cheddar, and soft-ripened cheese plants serving both supermarket delis and quick-service restaurant chains. Farmer-owned cooperatives control massive raw milk reception pools across Europe and Oceania, pairing continuous block forming with whey protein valorization. Ingredient specialists engineer spray-dried cheese powders and enzyme-modified flavors for savory snack and sauce manufacturers.
- Global Multi-Category Cheese Processors: Lactalis Group, Saputo Inc., Savencia Fromage & Dairy, and The Kraft Heinz Company operate international natural, artisan, and processed cheese portfolios.
- Farmer-Owned Cooperative Creameries: Fonterra Co-operative Group, Royal FrieslandCampina N.V., and Arla Foods amba integrate direct farmgate milk pools with high-volume block, slice, and export curd manufacturing.
- Industrial Cheddar & Cheese Ingredient Platforms: Glanbia plc, Kerry Group plc, and Associated British Foods plc supply bulk American-style cheddar, spray-dried cheese powders, and functional dairy blends.
Competitive Benchmarking: Cheese Market
Table 8: Competitive Benchmarking for the Cheese Market (qualitative capability ratings), 2026
| Company | Natural & Specialty Breadth | Ripening & Melt Engineering | Foodservice & Retail Access | Geographic Reach |
|---|---|---|---|---|
| Lactalis Group | High | High | High | High |
| Fonterra Co-operative Group | High | High | High | High |
| Royal FrieslandCampina N.V. | High | High | High | High |
| Arla Foods amba | High | High | High | High |
| Saputo Inc. | High | High | High | High |
| Savencia Fromage & Dairy | High | High | High | High |
| The Kraft Heinz Company | Medium | High | High | High |
| Glanbia plc | Medium | High | High | Medium |
| Kerry Group plc | Medium | High | Medium | High |
| Associated British Foods plc | Medium | Medium | Medium | High |
Scoring basis: Qualitative ratings in Table 8 benchmark each producer across four operational pillars. Natural & Specialty Breadth reflects portfolio coverage across hard, pasta-filata, soft-ripened, and spreadable curds. Ripening & Melt Engineering assesses continuous block forming, cave maturation, and pizza-oven melt standardization, while Foodservice & Retail Access and Geographic Reach reflect restaurant chain contracts and international creamery locations.
Key Developments in the Cheese Market
- In October 2025, Saputo Inc. completed commissioning of automated cut-and-wrap and shredded mozzarella lines across its United States and Canadian cheese plants to serve foodservice and retail accounts [15].
- In June 2025, Arla Foods amba expanded cream cheese and ultrafiltered specialty cheese capacity in Denmark to fulfill rising European and Middle Eastern foodservice export orders [16].
- In January 2025, Lactalis Group modernized high-speed slicing and modified-atmosphere packaging lines across its European Galbani and Président creameries [17].
Key Players in the Cheese Market
Global Multi-Category Cheese Processors
- Lactalis Group
- Saputo Inc.
- Savencia Fromage & Dairy
- The Kraft Heinz Company
Farmer-Owned Cooperative Creameries
- Fonterra Co-operative Group
- Royal FrieslandCampina N.V.
- Arla Foods amba
Industrial Cheddar & Cheese Ingredient Platforms
- Glanbia plc
- Kerry Group plc
- Associated British Foods plc
Cheese Market - Report Scope
Table 9: Report Scope for the Cheese Market (coverage fields and definitions), 2026 to 2036
| Coverage field | Report scope |
|---|---|
| Market breakdown | Form; Source; Distribution Channel; Flavor / Type; Region |
| Quantitative Units | USD Billion |
| Market Definition | Includes commercial revenue from specialty, artisanal, and industrial cheeses across slices, shreds, blocks, wedges, wheels, and spreads derived from bovine (cow) dairy milk, sheep and goat milk, and certified plant-based vegan formulations. Excludes raw unprocessed curds, whey protein derivatives, and liquid milk beverages. |
| Regions Covered | North America; Latin America; Western Europe; Eastern Europe; East Asia; South Asia and Pacific; Middle East and Africa |
| Countries Covered | Denmark, Canada, Australia, USA, Germany, France, and additional countries in the full report |
| Key Companies Covered | Lactalis Group, Fonterra Co-operative Group, Royal FrieslandCampina N.V., Arla Foods amba, Saputo Inc., Savencia Fromage & Dairy, The Kraft Heinz Company, Kerry Group plc, Glanbia plc, Associated British Foods plc |
| Forecast Period | 2026 to 2036 |
| Approach | Primary and secondary research with market triangulation. |
Cheese Market - Research Methodology
Table 10: Research Methodology for the Cheese Market (research methods and approach), 2026 edition
| Method | Approach |
|---|---|
| Primary Research | Primary interviews were conducted with commercial master cheesemakers, creamery plant directors, rennet and starter-culture engineers, foodservice pizza procurement heads, and supermarket deli buyers to validate vat conversion ratios and pricing. |
| Secondary Research | Secondary research covered USDA National Agricultural Statistics Service summaries, EU Milk Market Observatory reports, EFSA scientific opinions, FAO Codex standards, national dairy board statistics, and corporate annual filings. |
| Market Sizing and Forecasting | Market sizing and forecasting for 2026 to 2036 combined top-down industrial milk allocation balances with bottom-up grocery scanner sales and quick-service restaurant procurement volumes. |
| Data Triangulation and Validation | Estimates were cross-checked against commercial cheese cold-storage inventories, milk-to-curd yield coefficients, and household dairy expenditure surveys to prevent double counting. |
| Country Forecasting Model | Country-level CAGRs are projected via FMI's dairy econometric model, calibrating evaluated national growth rates against the 4.5% global baseline through verified per-capita cheese consumption, PDO artisanal production yields, and cold-chain retail grab-and-go case expansion. |
| Operational Benchmark Traceability | Operational benchmarks (global commercial cheese output, milk-to-cheese conversion ratios, and curd aging turnover) represent modeled estimates synthesized from USDA NASS reports, EFSA dairy safety bulletins, FAO dairy production data, and commercial creamery disclosures. |
Cheese Market by Segments
Cheese Market segmented by Form:
- Slices, Shreds & Blocks
- Wedges & Wheels
- Spreads & Portions
- Specialty Cuts
Cheese Market segmented by Source:
- Bovine / Cow Milk Dairy
- Plant-Based / Vegan Formulations
- Sheep & Goat Milk Dairy
Cheese Market segmented by Distribution Channel:
- Supermarkets & Hypermarkets
- Convenience Stores
- Food Service & Restaurants
- Specialty Deli Stores
Cheese Market segmented by Flavor / Type:
- Plain / Unflavored
- Flavored & Herb-Infused
- Smoked & Spiced
Cheese Market by Region
- North America
- United States
- Canada
- Latin America
- Brazil
- Mexico
- Argentina
- Chile
- Western Europe
- France
- Germany
- Italy
- United Kingdom
- Denmark
- Spain
- Benelux
- Nordics
- Eastern Europe
- Poland
- Czech Republic
- Romania
- Hungary
- East Asia
- Japan
- China
- South Korea
- South Asia and Pacific
- India
- ASEAN
- Australia and New Zealand
- Middle East and Africa
- GCC Countries
- South Africa
- Türkiye
- Israel
Research Sources and Bibliography
- [1] United States Department of Agriculture. (2026, April 24). Dairy products 2025 annual summary: Natural cheese and Italian mozzarella manufacturing. USDA National Agricultural Statistics Service Report Da 2-1(26).
- [2] European Food Safety Authority. (2025, May 14). Scientific opinion on the maintenance of the list of QPS-recommended biological agents intentionally added to food and dairy starter cultures. EFSA Journal, 23(5), 8912.
- [3] Food and Agriculture Organization. (2025, March 21). Codex Alimentarius standards for milk and ripened cheese products in international trade. FAO Dairy Production and Codex Standards Portal.
- [4] European Commission. (2025, September 16). EU Milk Market Observatory: Retail cheese scanner volumes and intra-EU dairy trade balances. DG Agriculture and Rural Development Market Observatory Report.
- [5] European Dairy Association. (2025, July 14). Cold-chain efficiency and modified-atmosphere packaging benchmarks in European cheese ripening cellars. EDA Technical Publication, 22, 65-82.
- [6] National Restaurant Association. (2025, April 18). Commercial foodservice industry trends: Pizza and burger cheese procurement patterns. NRA Industry Review, 39, 44-59.
- [7] International Dairy Foods Association. (2025, August 19). Dairy facts and figures: Commercial cheese cold-storage energy and processing costs. IDFA Annual Industry Report, 48, 110-132.
- [8] International Journal of Dairy Technology. (2025, September 11). Automated curd handling, ultrasonic brining, and continuous ripening systems for natural cheese. IJDT Review Series, 78(3), 315-334.
- [9] Danish Agriculture and Food Council. (2025, September 25). Statistics on dairy production, ultrafiltered cheese exports, and milk processing in Denmark. Landbrug & Fødevarer Annual Report, 29, 32-48.
- [10] Canadian Dairy Information Centre. (2025, June 20). Canadian cheese manufacturing statistics and industrial milk allocation bulletin. CDIC Statistical Series, 41, 58-75.
- [11] Dairy Australia. (2025, October 17). Australian dairy industry review: Manufacturing milk allocation, cheddar output, and Asian export trade. Dairy Australia Research Publication, 24, 70-92.
- [12] United States Department of Agriculture. (2026, February 12). Livestock, dairy, and poultry outlook: Natural cheese disappearance and export shipments. USDA Economic Research Service Report LDP-M-380.
- [13] Statistisches Bundesamt. (2025, December 15). Erzeugung und Verwendung von Milch und Milcherzeugnissen in Deutschland: Käseproduktion. Destatis Fachserie 3, Reihe 4.2.
- [14] Ministère de l'Agriculture et de la Souveraineté Alimentaire. (2025, August 26). Les filières laitière et fromagère françaises: Production sous signes de qualité AOP. Agreste Bilan Annuel, 52, 85-104.
- [15] Saputo Inc. (2025, October 28). Commissioning of automated cut-and-wrap and shredded mozzarella lines in North America. Saputo Corporate News Releases.
- [16] Arla Foods amba. (2025, June 18). Capacity expansion for specialty cream cheese and ultrafiltered foodservice curds in Denmark. Arla Foods Cooperative Announcements.
- [17] Lactalis Group. (2025, January 23). Modernization of high-speed slicing and modified-atmosphere packaging across European creameries. Lactalis Corporate Communications.
- [18] Fonterra Co-operative Group. (2025, August 12). Expansion of Anchor Food Professionals individual-quick-frozen mozzarella shreds for Asian foodservice. Fonterra Co-operative Reports.
- [19] Royal FrieslandCampina N.V. (2025, November 04). Ripening cellar energy recovery and lower-sodium Dutch Gouda block rollout. FrieslandCampina Corporate Releases.
- [20] Glanbia plc. (2026, February 05). High-capacity American-style cheddar vat optimization and whey protein recovery update. Glanbia Investor Relations Disclosures.
- [21] Savencia Fromage & Dairy. (2025, July 09). Specialty soft-ripened cheese packaging modernization across French and European dairies. Savencia Corporate News.
This bibliography is provided for reader reference and is not exhaustive. The full report contains the complete reference list and detailed citations.
This Report Answers
- How large is the global cheese market in 2026 and what is forecast for 2036?
- How do continuous vacuum block formers and ultrasonic brining improve curd consistency?
- Why does plain unflavored cheese command the largest share within the flavor category?
- What keeps supermarkets and hypermarkets ahead of alternative distribution channels in 2026?
- How do growth rates and milk allocation frameworks differ across Denmark, Canada, Australia, and the USA?
- Which multinational dairy corporations, farmer cooperatives, and ingredient specialists lead the market?
- What aging-cellar energy and commodity milk price risks restrain processor margins?
- What melt-flow, moisture, and food safety standards should foodservice buyers audit before qualifying a creamery?
Frequently Asked Questions
How large is the Cheese Market expected to be in 2026?
Commercial cheese revenues are projected to total USD 92.5 billion in 2026, up from USD 88.5 billion in 2025, before reaching USD 143.6 billion by 2036 on the back of quick-service pizza expansion and retail deli demand.
What CAGR is forecast for the Cheese Market through 2036?
FMI data suggests that global cheese sales are forecast to register a 4.5% CAGR from 2026 to 2036, supported by foodservice mozzarella shredding and resealable sliced retail packs.
Which flavor segment holds the leading cheese demand share in 2026?
Plain unflavored cheese represents 50.2% of flavor / type demand in 2026, as unseasoned mozzarella, cheddar, and gouda loaves integrate into both commercial baking and prepared meal assembly.
Which form segment leads commercial cheese sales in 2026?
Slices, shreds, and blocks capture 36.4% of form sales in 2026 because pre-portioned formats eliminate manual grating and knife labor in restaurant and household kitchens.
Which country has the highest cheese expansion outlook during the forecast period?
As noted by FMI, Denmark is anticipated to post a 5.5% CAGR over the 2026 to 2036 period, driven by membrane-ultrafiltered white cheese production and specialty cream cheese exports.
Which companies are active in the Cheese Market during 2026?
Active cheese manufacturers include Lactalis Group, Fonterra Co-operative Group, Royal FrieslandCampina N.V., Arla Foods amba, Saputo Inc., Savencia Fromage & Dairy, The Kraft Heinz Company, Kerry Group plc, Glanbia plc, and Associated British Foods plc, prioritizing ultrasonic slicing lines and automated curd block forming.
Preview the report firsthand - request a free sample
Get SampleGet the brochure for pricing and purchase details.
Get PDFTable of Content
- Key Takeaways
- Market Size and CAGR
- Top Growth Driver
- Fastest Growing Segment
- Leading Region
- Key Companies
- Emerging Opportunities
- Executive Summary
- Global Market Outlook
- Demand-side Trends
- Supply-side Trends
- Technology Roadmap Analysis
- Analysis and Recommendations
- Analyst Perspective (What is happening? Why now? What should investors know?)
- Key Questions Answered
- How large is the market?
- What is the CAGR?
- What are key trends?
- Which region dominates?
- Who are the leaders?
- Market Overview
- Market Coverage / Taxonomy
- Market Definition / Scope / Limitations
- Research Methodology
- Chapter Orientation
- Analytical Lens and Working Hypotheses
- Market Structure, Signals, and Trend Drivers
- Benchmarking and Cross-market Comparability
- Market Sizing, Forecasting, and Opportunity Mapping
- Research Design and Evidence Framework
- Desk Research Programme (Secondary Evidence)
- Expert Input and Fieldwork (Primary Evidence)
- Tooling, Models, and Reference Databases
- Data Engineering and Model Build
- Quality Assurance and Audit Trail
- Market Background
- Market Dynamics (Drivers, Restraints, Opportunity, Trends)
- Scenario Forecast (Optimistic, Likely, Conservative)
- Impact Analysis
- AI Impact
- Sustainability Impact
- Regulatory Impact
- Technology Impact
- Consumer / Buyer Analysis
- Purchase Drivers
- Adoption Barriers
- Buyer Journey
- Opportunity Map Analysis
- Product Life Cycle Analysis
- Supply Chain Analysis
- Investment Feasibility Matrix
- Value Chain Analysis
- PESTLE and Porter's Analysis
- Regulatory Landscape
- Regional Parent Market Outlook
- Production and Consumption Statistics
- Import and Export Statistics
- Global Market Analysis and Forecast, 2021 to 2036
- Historical Market Size Value (USD Billion) Analysis, 2021 to 2025
- Current and Future Market Size Value (USD Billion) Projections, 2026 to 2036
- Y-o-Y Growth Trend Analysis
- Absolute $ Opportunity Analysis
- Global Market Pricing Analysis, 2021 to 2036
- Global Market Analysis and Forecast, By Form, 2021 to 2036
- Introduction / Key Findings
- Historical Market Size Value (USD Billion) Analysis By Form, 2021 to 2025
- Current and Future Market Size Value (USD Billion) Analysis and Forecast By Form, 2026 to 2036
- Slices, Shreds & Blocks
- Wedges & Wheels
- Spreads & Portions
- Specialty Cuts
- Y-o-Y Growth Trend Analysis By Form, 2021 to 2025
- Absolute $ Opportunity Analysis By Form, 2026 to 2036
- Global Market Analysis and Forecast, By Source, 2021 to 2036
- Introduction / Key Findings
- Historical Market Size Value (USD Billion) Analysis By Source, 2021 to 2025
- Current and Future Market Size Value (USD Billion) Analysis and Forecast By Source, 2026 to 2036
- Bovine / Cow Milk Dairy
- Plant-Based / Vegan Formulations
- Sheep & Goat Milk Dairy
- Y-o-Y Growth Trend Analysis By Source, 2021 to 2025
- Absolute $ Opportunity Analysis By Source, 2026 to 2036
- Global Market Analysis and Forecast, By Distribution Channel, 2021 to 2036
- Introduction / Key Findings
- Historical Market Size Value (USD Billion) Analysis By Distribution Channel, 2021 to 2025
- Current and Future Market Size Value (USD Billion) Analysis and Forecast By Distribution Channel, 2026 to 2036
- Supermarkets & Hypermarkets
- Convenience Stores
- Food Service & Restaurants
- Specialty Deli Stores
- Y-o-Y Growth Trend Analysis By Distribution Channel, 2021 to 2025
- Absolute $ Opportunity Analysis By Distribution Channel, 2026 to 2036
- Global Market Analysis and Forecast, By Flavor / Type, 2021 to 2036
- Introduction / Key Findings
- Historical Market Size Value (USD Billion) Analysis By Flavor / Type, 2021 to 2025
- Current and Future Market Size Value (USD Billion) Analysis and Forecast By Flavor / Type, 2026 to 2036
- Plain / Unflavored
- Flavored & Herb-Infused
- Smoked & Spiced
- Y-o-Y Growth Trend Analysis By Flavor / Type, 2021 to 2025
- Absolute $ Opportunity Analysis By Flavor / Type, 2026 to 2036
- Global Market Analysis and Forecast, By Region, 2021 to 2036
- Introduction
- Historical Market Size Value (USD Billion) Analysis By Region, 2021 to 2025
- Current Market Size Value (USD Billion) Analysis and Forecast By Region, 2026 to 2036
- North America
- Latin America
- Western Europe
- Eastern Europe
- East Asia
- South Asia and Pacific
- Middle East and Africa
- Market Attractiveness Analysis By Region
- North America Market Analysis and Forecast, By Country, 2021 to 2036
- Historical Market Size Value (USD Billion) Trend Analysis By Market Taxonomy, 2021 to 2025
- Market Size Value (USD Billion) Forecast By Market Taxonomy, 2026 to 2036
- By Country
- United States
- Canada
- By Form
- By Source
- By Distribution Channel
- By Flavor / Type
- By Country
- Market Attractiveness Analysis
- By Country
- By Form
- By Source
- By Distribution Channel
- By Flavor / Type
- Key Takeaways
- Latin America Market Analysis and Forecast, By Country
- Historical Market Size Value (USD Billion) Trend Analysis By Market Taxonomy, 2021 to 2025
- Market Size Value (USD Billion) Forecast By Market Taxonomy, 2026 to 2036
- By Country
- Brazil
- Mexico
- Argentina
- Chile
- By Form
- By Source
- By Distribution Channel
- By Flavor / Type
- By Country
- Market Attractiveness Analysis
- By Country
- By Form
- By Source
- By Distribution Channel
- By Flavor / Type
- Key Takeaways
- Western Europe Market Analysis and Forecast, By Country
- Historical Market Size Value (USD Billion) Trend Analysis By Market Taxonomy, 2021 to 2025
- Market Size Value (USD Billion) Forecast By Market Taxonomy, 2026 to 2036
- By Country
- France
- Germany
- Italy
- United Kingdom
- Denmark
- Spain
- Benelux
- Nordics
- By Form
- By Source
- By Distribution Channel
- By Flavor / Type
- By Country
- Market Attractiveness Analysis
- By Country
- By Form
- By Source
- By Distribution Channel
- By Flavor / Type
- Key Takeaways
- Eastern Europe Market Analysis and Forecast, By Country
- Historical Market Size Value (USD Billion) Trend Analysis By Market Taxonomy, 2021 to 2025
- Market Size Value (USD Billion) Forecast By Market Taxonomy, 2026 to 2036
- By Country
- Poland
- Czech Republic
- Romania
- Hungary
- By Form
- By Source
- By Distribution Channel
- By Flavor / Type
- By Country
- Market Attractiveness Analysis
- By Country
- By Form
- By Source
- By Distribution Channel
- By Flavor / Type
- Key Takeaways
- East Asia Market Analysis and Forecast, By Country
- Historical Market Size Value (USD Billion) Trend Analysis By Market Taxonomy, 2021 to 2025
- Market Size Value (USD Billion) Forecast By Market Taxonomy, 2026 to 2036
- By Country
- Japan
- China
- South Korea
- By Form
- By Source
- By Distribution Channel
- By Flavor / Type
- By Country
- Market Attractiveness Analysis
- By Country
- By Form
- By Source
- By Distribution Channel
- By Flavor / Type
- Key Takeaways
- South Asia and Pacific Market Analysis and Forecast, By Country
- Historical Market Size Value (USD Billion) Trend Analysis By Market Taxonomy, 2021 to 2025
- Market Size Value (USD Billion) Forecast By Market Taxonomy, 2026 to 2036
- By Country
- India
- ASEAN
- Australia and New Zealand
- By Form
- By Source
- By Distribution Channel
- By Flavor / Type
- By Country
- Market Attractiveness Analysis
- By Country
- By Form
- By Source
- By Distribution Channel
- By Flavor / Type
- Key Takeaways
- Middle East and Africa Market Analysis and Forecast, By Country
- Historical Market Size Value (USD Billion) Trend Analysis By Market Taxonomy, 2021 to 2025
- Market Size Value (USD Billion) Forecast By Market Taxonomy, 2026 to 2036
- By Country
- GCC Countries
- South Africa
- Türkiye
- Israel
- By Form
- By Source
- By Distribution Channel
- By Flavor / Type
- By Country
- Market Attractiveness Analysis
- By Country
- By Form
- By Source
- By Distribution Channel
- By Flavor / Type
- Key Takeaways
- Key Countries Market Analysis
- United States
- Pricing Analysis
- Market Share Analysis, 2025
- By Form
- By Source
- By Distribution Channel
- By Flavor / Type
- Canada
- Pricing Analysis
- Market Share Analysis, 2025
- By Form
- By Source
- By Distribution Channel
- By Flavor / Type
- Mexico
- Pricing Analysis
- Market Share Analysis, 2025
- By Form
- By Source
- By Distribution Channel
- By Flavor / Type
- Brazil
- Pricing Analysis
- Market Share Analysis, 2025
- By Form
- By Source
- By Distribution Channel
- By Flavor / Type
- Chile
- Pricing Analysis
- Market Share Analysis, 2025
- By Form
- By Source
- By Distribution Channel
- By Flavor / Type
- Germany
- Pricing Analysis
- Market Share Analysis, 2025
- By Form
- By Source
- By Distribution Channel
- By Flavor / Type
- United Kingdom
- Pricing Analysis
- Market Share Analysis, 2025
- By Form
- By Source
- By Distribution Channel
- By Flavor / Type
- Italy
- Pricing Analysis
- Market Share Analysis, 2025
- By Form
- By Source
- By Distribution Channel
- By Flavor / Type
- Spain
- Pricing Analysis
- Market Share Analysis, 2025
- By Form
- By Source
- By Distribution Channel
- By Flavor / Type
- France
- Pricing Analysis
- Market Share Analysis, 2025
- By Form
- By Source
- By Distribution Channel
- By Flavor / Type
- India
- Pricing Analysis
- Market Share Analysis, 2025
- By Form
- By Source
- By Distribution Channel
- By Flavor / Type
- ASEAN
- Pricing Analysis
- Market Share Analysis, 2025
- By Form
- By Source
- By Distribution Channel
- By Flavor / Type
- Australia and New Zealand
- Pricing Analysis
- Market Share Analysis, 2025
- By Form
- By Source
- By Distribution Channel
- By Flavor / Type
- China
- Pricing Analysis
- Market Share Analysis, 2025
- By Form
- By Source
- By Distribution Channel
- By Flavor / Type
- Japan
- Pricing Analysis
- Market Share Analysis, 2025
- By Form
- By Source
- By Distribution Channel
- By Flavor / Type
- South Korea
- Pricing Analysis
- Market Share Analysis, 2025
- By Form
- By Source
- By Distribution Channel
- By Flavor / Type
- Poland
- Pricing Analysis
- Market Share Analysis, 2025
- By Form
- By Source
- By Distribution Channel
- By Flavor / Type
- Hungary
- Pricing Analysis
- Market Share Analysis, 2025
- By Form
- By Source
- By Distribution Channel
- By Flavor / Type
- Türkiye
- Pricing Analysis
- Market Share Analysis, 2025
- By Form
- By Source
- By Distribution Channel
- By Flavor / Type
- South Africa
- Pricing Analysis
- Market Share Analysis, 2025
- By Form
- By Source
- By Distribution Channel
- By Flavor / Type
- Denmark
- Pricing Analysis
- Market Share Analysis, 2025
- By Form
- By Source
- By Distribution Channel
- By Flavor / Type
- Australia
- Pricing Analysis
- Market Share Analysis, 2025
- By Form
- By Source
- By Distribution Channel
- By Flavor / Type
- United States
- Market Structure Analysis
- Competition Dashboard
- Competition Benchmarking
- Market Share Analysis of Top Players
- By Regional
- By Form
- By Source
- By Distribution Channel
- By Flavor / Type
- Emerging Startups
- Innovation Benchmarking
- Competition Analysis
- Competition Deep Dive
- Lactalis Group
- Overview
- Product Portfolio
- Profitability by Market Segments
- Sales Footprint
- Strategy Overview
- Marketing Strategy
- Product Strategy
- Channel Strategy
- Fonterra Co-operative Group
- Royal FrieslandCampina N.V.
- Arla Foods amba
- Saputo Inc.
- Savencia Fromage & Dairy
- The Kraft Heinz Company
- Glanbia plc
- Kerry Group plc
- Associated British Foods plc
- Lactalis Group
- Case Studies
- Success Stories
- Recent Developments
- Competition Deep Dive
- Assumptions & Acronyms Used


