Reports

- Global Locations -

Headquarters

Future Market Insights, Inc.

Christiana Corporate, 200
Continental Drive, Suite 401,
Newark, Delaware - 19713,
United States

T: +1-845-579-5705

Americas

Future Market Insights, Inc.

616 Corporate Way, Suite 2-9018,
Valley Cottage, NY 10989, United States

T: +1-347-918-3531

MEA

Future Market Insights

1602-6 Jumeirah Bay X2 Tower, Plot No: JLT-PH2-X2A,
Jumeirah Lakes Towers, Dubai,
United Arab Emirates

Europe

Future Market Insights

3rd Floor, 207 Regent Street,
W1B 3HH London
United Kingdom

T: + 44 (0) 20 8123 9659
D: +44 (0) 20 3287 4268

Asia Pacific

Future Market Insights

IndiaLand Global Tech Park, Unit UG-1, Behind Grand HighStreet, Phase 1, Hinjawadi, MH, Pune – 411057, India

Automotive Cabin Air Quality Sensors Market (Outlook 2023 to 2033)

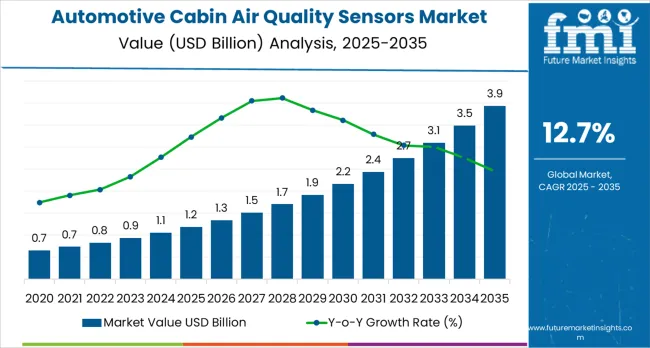
In 2023, the global automotive cabin air quality sensors market is likely to be valued at US$ 467.8 million. Through 2033, the market is anticipated to develop at a CAGR of 12.3% and reach US$ 1,492.3 million.

The global automotive cabin air quality sensors market is anticipated to grow as consumers become more aware of the dangers of air pollution and its poor quality. Rising urbanization and gradual improvement in emerging regions' economic situations have increased the penetration rate of cars, which has led to an increase in vehicle emissions such as carbon monoxide and hydrogen. As a result, demand for automotive cabin air quality sensors is surging. To limit automotive emissions, the governments of several regions have implemented strict emission requirements. The popularity of automobile cabin air quality sensors is rising as a result of this.

With an escalating awareness of the detrimental impact of air pollution on human health, there is a mounting demand for cutting-edge technologies. These technologies are capable of monitoring and enhancing air quality. Cabin air quality sensors are vital in identifying harmful pollutants and providing real-time information to vehicle occupants. This empowers them to take necessary measures to mitigate risks.

Governments worldwide are enacting and enforcing stringent regulations and standards to ensure superior air quality inside vehicles. Notably, crucial regulations like Euro 6 and China 6 mandate vehicles to incorporate efficient air filtration systems and cabin air quality sensors. This regulatory framework is stimulating the widespread adoption of cabin air quality sensors across automotive applications.

The ever-increasing adoption of electric vehicles (EVs) and autonomous vehicles (AVs) is a key catalyst driving the demand for cabin air quality sensors. As EVs gain prominence, there arises a need for robust cabin air management systems to ensure a healthy and comfortable environment within the vehicle. Similarly, AVs require advanced sensor technologies to safeguard passenger well-being in fully autonomous driving scenarios. Consequently, the surge in EVs and AVs is fueling the demand for automotive cabin air quality sensors.

The automotive cabin air quality sensors market has witnessed significant trends shaping the industry. There is a growing awareness of the detrimental effects of air pollution on human health. There is an increased focus on improving the air quality inside vehicles. This has resulted in the integration of cabin air quality sensors. These sensors monitor and regulate the levels of pollutants, allergens, and harmful gases present in the cabin environment.

The integration of cabin air quality sensors with the vehicle's HVAC systems is gaining traction. This integration allows for the automatic adjustment of ventilation and air circulation settings. The adjustments are based on the detected air quality parameters. By doing so, the HVAC system optimizes air quality and passenger comfort. Simultaneously, it minimizes energy consumption.

Attributes Details
Historical Value (2022) US$ 432.1 million
Current Year Value (2023) US$ 467.8 million
Expected Forecast Value (2033) US$ 1,492.3 million
Projected CAGR (2023 to 2033) 12.3%

Don't pay for what you don't need

Customize your report by selecting specific countries or regions and save 30%!

2023 to 2033 Demand Outlook in Comparison to Sales Registered from 2018 to 20222023 to 2033 Demand Outlook in Comparison to Sales Registered from 2018 to 2022

The automotive cabin air quality sensors market is likely to experience a growth rate of 12.3% CAGR during the period from 2023 to 2033. This represents a slightly lower growth rate compared to the 12.9% CAGR recorded from 2018 to 2022.

The early adopters of automotive cabin air quality sensors have already embraced their usage. Now, the market is shifting toward broader adoption. Consequently, the growth rate of the market is slowing down. The decreasing cost of sensors makes them more affordable for automakers to include in their vehicles. As a result, there is less demand for aftermarket sensors, which has been a crucial market driver.

Several new technologies are emerging that could potentially replace cabin air quality sensors. For instance, certain automakers are developing systems that use artificial intelligence to monitor air quality in the cabin. If these technologies become widely adopted, they could further slow the market growth.

Despite these factors, the automotive cabin air quality sensors market is still expected to grow in the coming years. However, the growth rate of the market is likely to slow down.

How Environmental Concerns are Impacting the Automotive Cabin Air Quality Sensors Market?

Automotive air pollution control has always been a significant difficulty due to the rapidly changing environment both outside and inside the vehicle when it is moving, as well as owing to the space constraints inside. People are unaware of how automotive cabin air quality sensors may effectively remove dangerous contaminants.

The market is expanding as a result of an increase in the deployment of air quality sensors due to the interior emission of dangerous pollutants. One of the key factors driving the growth of the automotive cabin air quality sensors market is the increase in vehicle technology and rising demand for luxury vehicles.

Additionally, rising demand for vehicles from developing nations like China, India, Japan, and others is driving up vehicle manufacturing, which is assisting the expansion of the market for automotive cabin air quality sensors.

Automotive Cabin Air Quality Sensor Taking Step Forward In Industry Development

Due to anticipated vehicle safety regulations for in-cabin air quality that utilizes the recent pollution sensor technology, automotive cabin air quality sensors are ready to advance public health protection.

Additionally, sensors in electric vehicles may be necessary to guarantee that the HVAC systems meet air quality regulations. Due to its ability to identify all airborne pollutants and toxins, demand for automobile cabin air quality sensors is high.

These highly developed sensors are capable of picking up ultrafine gases and particles, such as CO, NOx, carbon dioxide, and VOCs, both inside and outside the vehicle.

Vehicle occupants are still exposed to in-cabin air pollutants and CO2 in the absence of a proper filtration system or fresh, clean air, which can cause long-term respiratory health problems and short-term attention problems. As a result, the adoption of automotive cabin air quality sensors is increasing to a new level.

Nikhil Kaitwade
Nikhil Kaitwade

Principal Consultant

Talk to Analyst

Find your sweet spots for generating winning opportunities in this market.

Comparative Analysis of the Adjacent Automotive Cabin Air Quality Sensors Market

Automotive Cabin Air Quality Sensors Market:

Differentiating Aspects Automotive Cabin Air Quality Sensors Market
CAGR (2023 to 2033) 12.3%
Projected Market Value in 2033 US$ 1,492.3 million
Growth Factors The demand for automotive cabin air quality sensors is high, since they can detect all airborne poisons and contaminants
Opportunities Rising luxury vehicle demand and improved vehicle technologies are creating new industry opportunities
Key Trends The overall market is expanding as a result of growing urbanization and gradual improvements in the economic conditions of emerging regions

Automotive Sensors Market:

Differentiating Aspects Automotive Sensors Market
CAGR (2023 to 2033) 7.2%
Projected Market Value in 2033 US$ 84.53 billion
Growth Factors Automobile sales, which are fueled by rising per capita income in emerging economies, are what drive demand
Opportunities The market players benefit from the focus on enhancing overall vehicle performance
Key Trends The installation of safety sensors in commercial vehicles is now required by a number of governments, which help the market expand

Automotive Turbochargers Market:

Differentiating Aspects Automotive Turbochargers Market
CAGR (2023 to 2033) 8.8%
Projected Market Value in 2033 US$ 26.42 billion
Growth Factors The use of automotive turbochargers in off-road equipment, heavy-duty trucks, light-duty vehicles, and passenger automobiles is likely to accelerate market expansion
Opportunities Engine Downsizing is providing lucrative opportunities in the market
Key Trends To meet the pollution targets, manufacturers have adopted a number of cutting-edge technologies, such as selective catalytic reduction and exhaust gas circulation

With the development of filter technology, even odor and tiny contaminants can be filtered by the filter. As health benefits increased, consumers soon began purchasing vehicles with HVAC. Moreover, due to this, HVAC is now a standard component in all automobiles. Governments around the world have been instrumental in raising awareness and limiting vehicular pollution by enforcing emission standards and providing new opportunities in the automotive cabin air quality sensors market.

Vehicle manufacturers were forced by government pressure to alter engine design for low emissions and incorporate cabin air quality sensors for passenger safety. People are more likely to be exposed to air pollution in an open setting than they are in a closed one.

Due to the increased vulnerability of modern automobiles to air pollution, the demand for automotive cabin air quality sensors is expanding. However, it could be significantly impacted by the existing slowdown and the possibility of a further decline in China's economy.

One of the key climate change regulations put into place by the UN is the Paris Agreement. In addition, people are increasingly demanding that modern technologies be installed in their automobiles so that they can self-diagnose problems and perform better overall. One of the opportunities for the aftermarket throughout the predicted period is the routine replacement of the sensor owing to unit failure.

What is the Regional Outlook of the Automotive Cabin Air Quality Sensors Market?

North America, Asia Pacific, and Europe are expected to be the primary markets contributing to the adequate share during the forecast period.

North America Analysis

As commercial vehicle production is at its highest level, North America has the largest automotive cabin air quality sensors market share worldwide. The main causes of the strong sales and demand for commercial vehicles in this region also include the expansion of the industrial sector, as well as the growth of the building, logistics, and transportation sectors.

Asia Pacific Analysis

Due to the region's recent explosive growth in the automobile industry, Asia Pacific has also experienced significant growth on the worldwide market. Additionally, this region's high rates of urbanization, industrialization, disposable income growth, and demographic expansion are boosting the expansion of logistics and transportation, which is ultimately opening up lucrative potential for the automotive cabin air quality sensors market there.

Get the data you need at a Fraction of the cost

Personalize your report by choosing insights you need
and save 40%!

Country-wise Insights

How are Government Regulations Shaping the Landscape of the United States Automotive Cabin Air Quality Sensors Market?

The United States stands as one of the leading automotive markets globally, characterized by a strong emphasis on technology and innovation. With the growing concerns over air pollution and health risks, there is an increasing demand for automotive cabin air quality sensors to ensure clean and safe air inside vehicles.

Country United States
2022 Value Share in Global Market 21.6%

A notable rise in public awareness regarding air quality and its profound impact on health is evident. Consumers have become more conscious of the air they breathe, both indoors and within vehicles. This trend fuels the adoption of cabin air quality sensors as a standard feature in vehicles.

The United States has implemented strict environmental regulations, particularly concerning vehicle emissions and air quality. This regulatory environment creates a favorable market for automotive cabin air quality sensors as automakers strive to comply with regulations and provide healthier driving environments.

How is the United Kingdom Addressing Air Quality Concerns through Cabin Air Quality Sensors?

The United Kingdom automotive cabin air quality sensors market is experiencing substantial growth, driven by

  • stringent regulations
  • increasing consumer awareness
  • technological advancements

The United Kingdom has demonstrated a strong commitment to addressing environmental concerns, particularly air pollution. The automotive industry has been actively engaged in enhancing the air quality within vehicles to provide a healthier driving experience. Cabin air quality sensors play a pivotal role in monitoring and controlling the presence of air pollutants inside vehicles.

Country United Kingdom
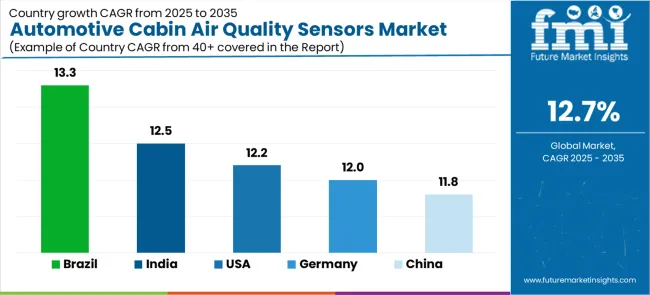
Value CAGR (2023 to 2033) 10.4%

The growing popularity of electric vehicles in the United Kingdom contributes to the demand for cabin air quality sensors. As EVs do not emit tailpipe pollutants, there is a heightened focus on maintaining excellent air quality inside these vehicles. Cabin air quality sensors are crucial in ensuring optimal air quality within the electric vehicle cabin.

What Makes Germany a Hotbed for Automotive Cabin Air Quality Sensor Innovation?

The Germany automotive cabin air quality sensors market is likely to witness significant growth. With rising concerns about air pollution and its impact on health, there is a surging demand for technologies that enable real-time air quality monitoring. German consumers are becoming increasingly conscious of the air they breathe, not just outdoors but also inside their vehicles. This trend is propelling the adoption of automotive cabin air quality sensors in automobiles.

Country Germany
2022 Value Share in Global Market 7.9%

Germany has been at the forefront of implementing stricter emission standards for vehicles. The upcoming Euro 7 emission standards are expected to further tighten the limits on pollutant emissions. This development is expected to drive the adoption of advanced cabin air quality sensors to ensure compliance with these stringent standards.

What Ongoing Developments Are Fueling Innovation in Japan Automotive Cabin Air Quality Sensors Market?

Consumers in Japan are becoming increasingly mindful of air pollution and its detrimental impact on health. This heightened awareness has propelled the demand for automotive cabin air quality sensors as individuals seek effective ways to ensure cleaner and healthier air inside their vehicles.

Country Japan
2022 Value Share in Global Market 8.5%

Japan-based automotive manufacturers are placing greater emphasis on air purification systems within vehicles. Cabin air quality sensors play a pivotal role in these systems by continuously monitoring and adjusting air quality parameters. This emerging trend signifies the growing importance of cabin air quality sensors in overall vehicle design and consumer satisfaction.

How Can Advanced Cabin Air Quality Sensors Improve the Travel Experience in China's Luxury Vehicle Segment?

The China automotive cabin air quality sensors market has been experiencing remarkable growth lately. The automotive industry in China is placing increasing emphasis on air purification systems, particularly in premium and luxury vehicle segments. Cabin air quality sensors are being utilized to monitor and improve air filtration and purification systems. This ensures the efficient removal of pollutants and allergens from the cabin.

Country China
Value CAGR (2023 to 2033) 14.0%

China stands as the global leader in electric vehicle sales. The soaring demand for EVs in the country is positively influencing the need for cabin air quality sensors, as these vehicles prioritize providing clean and healthy air for passengers.

In recent years, China has implemented national standards for cabin air quality. These standards require vehicles to meet specific air quality parameters. As a result, there has been a significant increase in demand for automotive cabin air quality sensors. These sensors are necessary to ensure compliance with the standards and maintain acceptable air quality inside vehicles.

Are Automotive Cabin Air Quality Sensors the Solution to India's Air Pollution Crisis?

India is grappling with severe air pollution issues, with several cities consistently recording high levels of particulate matter pollution. This has prompted a heightened focus on air pollution control measures, including the installation of cabin air quality sensors in vehicles. The government has implemented stricter emission norms and is actively encouraging the adoption of clean technologies. These initiatives are driving the demand for cabin air quality sensors in the country.

Country India
Value CAGR (2023 to 2033) 13.5%

India has set ambitious targets for electric vehicle adoption to combat pollution and reduce reliance on fossil fuels. As the EV market expands, the demand for cabin air quality sensors is expected to surge. Electric vehicles often feature advanced air filtration systems to provide a clean and healthy cabin environment, thereby driving the need for cabin air quality sensors.

Segmentation Analysis

Segment 2022 Value Share in Global Market
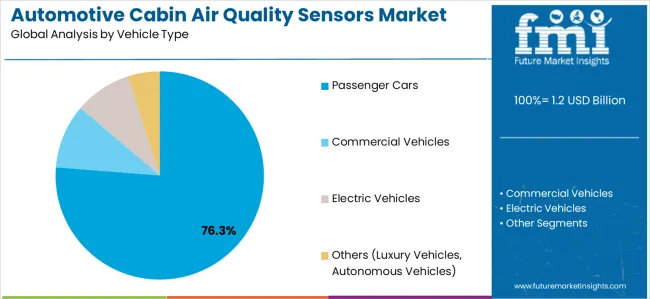
Passenger Cars Vehicle Type 58.7%
OEM Sales Channel 89.4%

How are Passenger Cars Driving the Demand for Cabin Air Quality Sensors?

Passenger cars represent a substantial proportion of the global automotive market, with millions of units sold annually. This extensive presence in the market contributes to the significant demand for cabin air quality sensors. The automotive industry has also witnessed a rising focus on enhancing passenger comfort and health.

Passenger cars predominantly operate in urban areas. Pollution levels in urban regions are generally higher than in rural areas. Traffic congestion, exhaust emissions, and other pollutants characterize urban environments. The presence of these pollutants necessitates the use of effective cabin air quality sensors in passenger cars. The sensors help mitigate the impact of contaminants on the occupants of the vehicle.

Rising consumer demand for comfort, air quality, and health safety, as well as rising sales and demand for passenger automobiles, particularly in developed nations, are predicted to increase the market for automotive cabin air quality sensors globally. Additionally, the anticipated trend toward shared and autonomous passenger vehicle mobility is likely to increase new car sales by 30% in the United States, Europe, and China due to the expansion of the market.

Why Do OEMs Hold a Firm Grip on the Automotive Cabin Air Quality Sensors Market?

One of the key advantages of OEMs is their ability to seamlessly incorporate cabin air quality sensors into the vehicle manufacturing process. OEMs can ensure optimal placement and alignment by integrating these sensors from the outset. This results in enhanced sensor performance and accuracy.

OEMs possess a well-established supply chain network and maintain strong partnerships with reliable suppliers. This enables them to procure cabin air quality sensors in large quantities. It helps them to ensure a consistent and dependable supply. OEMs gain a competitive edge over other sales channels by exercising control over the supply chain.

OEMs typically offer comprehensive warranties and exceptional after-sales support for their vehicles. When the OEM integrates cabin air quality sensors into the vehicle, they can extend these warranties and provide dedicated service support for the sensors. This instills trust among consumers and solidifies the preference for OEM sales channels.

How Competition Impacts the Automotive Cabin Air Quality Sensors Market?

In order to increase their market presence across the automotive cabin air quality sensors market, prominent manufacturers have been found to be involved in the development of new and innovative automotive cabin air quality sensors, as well as acquisition activities.

  • In June 2023, Sensirion announced the integration of its air quality sensors with the RESET Air Standard. This integration aims to streamline the accreditation procedure for indoor air quality monitors. Customers can now adhere to RESET standards effortlessly. This development ensures precise and dependable monitoring of indoor air quality.
  • In June 2021, Prodrive Technologies developed a sensor to measure dust particles. It can evaluate dust particles both inside and outside of a car. Car manufacturers can utilize this data to improve the air quality within the vehicle.
  • In May 2021, Figaro Engineering Inc. unveiled the FECS series. The FECS series consists of three-electrode electrochemical gas sensors. These sensors exhibit minimal susceptibility to interference gases. They also feature a distinctive leak-proof design. As a result, the FECS-series sensors are highly suitable for gas monitors and detectors in automotive industries.

The primary development methods chosen by car cabin air quality sensor manufacturers for connecting with clients include a well-organized and effective supply chain, as well as an upgraded retailing network.

For example

In order to provide trustworthy real-time data on the air quality inside and outside of the automotive and deliver this data to passengers, Hella and BreezoMeter created an air quality management system for vehicles in 2017. The alliance also aimed to provide specialized active health management solutions based on cloud technologies. The product has two essential parts:

  • PM2.5 sensor: Hella created a sensor that continuously measures particulate matter concentrations both inside and outside the car.
  • Data from BreezoMeter and the cloud were added to the sensor's data to provide information on additional pollutants, such as carbon monoxide (CO), ozone (O3), sulfur dioxide (SO2), nitrogen dioxide (NO2), and particulate matter (PM10).

Key Players

  • Amphenol Corporation
  • Sensirion AG Switzerland
  • Paragon AG
  • Valeo
  • Sensata Technologies, Inc.
  • Honeywell International Inc.
  • ams AG
  • OMRON Corporation
  • Figaro Engineering Inc.
  • Prodrive Technologies
  • UST Umweltsensortechnik GmbH
  • Chemisense Inc
  • MicroJet Technology
  • Infineon Technologies AG
  • Others

Monitoring, purification, and cloud-based technology have surpassed the prospects in the industry.

The manufacturing process undergoes a dramatic transformation thanks to artificial intelligence (AI) and machine learning, which is likely to increase robotic uniformity, accuracy, and efficiency.

OEMs are able to offer appealing features and support revenue development due to level 2 automation, which includes active safety systems and driver assistance. For the technology to evolve and for consumers to embrace level 4 autonomous vehicles, however, additional delays are anticipated.

Key players are focusing on technology like cloud based solutions. Over 1.6 TB of BreezoMeter data could be validated and organized every hour due to the cloud solution. Predicted air quality information was transmitted to the car through an interface, analyzed centrally within, and displayed on the infotainment system. Thus, demand for automotive cabin air quality sensors is anticipated to be boosted by technical advancements, greater real-time data processing capabilities of air quality monitoring solutions, and the commercialization of sensor technologies.

The automobile cabin air quality sensors have two features that can be advantageous to both manufacturers and end users: monitoring and purification. Built-in air quality modules are created in a way that they may adjust to OEM requirements that alter in accordance with local and national environmental conditions.

However, the sensor data can be simply connected with the air purification module, which can then neutralize the specific pollutants detected by the monitoring system. These modules just monitor the air quality.

These mechanical filters have some restrictions on the pollutants they can effectively filter out, and they are typically poor at filtering out CO2, CO2, and VOCs. At this point, technology replaces the mechanical filters. Additionally, particle charging is one of the ground-breaking technologies that has proven to be quite successful. The basic idea behind this technology is to electrostatically charge the airborne particles, typically with a negative charge.

In their forthcoming models, a number of OEMs have already begun to include cabin air quality monitoring and filtration solutions. And as more people are aware of the importance of respiratory health, such technologies are widely used in the automotive sector.

Key Segments of the Automotive Cabin Air Quality Sensors Market

By Vehicle Type:

  • Passenger Cars
  • Commercial Vehicles

By Sales Channel Type:

  • OEM
  • Aftermarket

By Region:

  • North America
  • Latin America
  • Western Europe
  • Eastern Europe
  • East Asia and Pacific
  • Middle East and Africa

Frequently Asked Questions

How big is the Automotive Cabin Air Quality Sensors Market by 2033?

The projected revenue of the market by 2033 is US$ 1,492.3 million.

What is the Automotive Cabin Air Quality Sensors Market CAGR for 2033?

The market CAGR for 2033 is projected to be 12.3%.

How Big is the Automotive Cabin Air Quality Sensors Market?

The market is valued at US$ 467.8 million in 2023.

Which Industry is the Key Consumer of the Automotive Cabin Air Quality Sensors Market?

The automotive industry is the key consumer of the automotive cabin air quality sensors market.

Who are the Key Automotive Cabin Air Quality Sensors Market Players?

The key market players are Honeywell International Inc., Valeo, and Axetris.

Table of Content

1. Executive Summary

    1.1. Global Market Outlook

    1.2. Demand Side Trends

    1.3. Supply Side Trends

    1.4. Technology Roadmap

    1.5. Analysis and Recommendations

2. Market Overview

    2.1. Market Coverage / Taxonomy

    2.2. Market Definition / Scope / Limitations

3. Key Market Trends

    3.1. Key Trends Impacting the Market

    3.2. Product Innovation / Development Trends

4. Key Success Factors

    4.1. Product Adoption / Usage Analysis

    4.2. Product USPs / Features

    4.3. Strategic Promotional Strategies

5. Global Market Demand Analysis 2018 to 2022 and Forecast, 2023 to 2033

    5.1. Historical Market Volume (Unit) Analysis, 2018 to 2022

    5.2. Current and Future Market Volume (Unit) Projections, 2023 to 2033

    5.3. Y-o-Y Growth Trend Analysis

6. Global Market - Pricing Analysis

    6.1. Regional Pricing Analysis By Vehicle Type

    6.2. Global Average Pricing Analysis Benchmark

7. Global Market Demand (in Value or Size in US$ Million) Analysis 2018 to 2022 and Forecast, 2023 to 2033

    7.1. Historical Market Value (US$ Million) Analysis, 2018 to 2022

    7.2. Current and Future Market Value (US$ Million) Projections, 2023 to 2033

        7.2.1. Y-o-Y Growth Trend Analysis

        7.2.2. Absolute $ Opportunity Analysis

8. Market Background

    8.1. Macro-Economic Factors

        8.1.1. Global GDP Growth Outlook

        8.1.2. Manufacturing Value-Added

        8.1.3. Industry Value Added

        8.1.4. Global Commercial Vehicles Overview

        8.1.5. Global Automotive Industry Outlook

        8.1.6. Other Macro-Economic Factors

    8.2. Forecast Factors - Relevance & Impact

        8.2.1. Top Companies Historical Growth

        8.2.2. GDP Growth Forecast

        8.2.3. Manufacturing Industry Forecast

        8.2.4. Global Urbanization Growth Outlook

        8.2.5. End-use Industry Growth Outlook

        8.2.6. Other Forecast Factors

    8.3. Value Chain

        8.3.1. Product Manufacturers

        8.3.2. End Users

        8.3.3. Avg. Profitability Margins

    8.4. COVID-19 Crisis – Impact Assessment

        8.4.1. Current Statistics

        8.4.2. Short-Mid-Long Term Outlook

        8.4.3. Likely Rebound

    8.5. Market Dynamics

        8.5.1. Drivers

        8.5.2. Restraints

        8.5.3. Opportunity Analysis

    8.6. Key Regulations & Certifications

    8.7. Key Developments

    8.8. Parent Market Overview

    8.9. Patent Analysis

    8.10. Porter and PEST Analysis

9. Global Market Analysis 2018 to 2022 and Forecast 2023 to 2033, By Vehicle Type

    9.1. Introduction / Key Findings

    9.2. Historical Market Size (US$ Million) and Volume Analysis By Vehicle Type, 2018 to 2022

    9.3. Current and Future Market Size (US$ Million) and Volume Analysis and Forecast By Vehicle Type, 2023 to 2033

        9.3.1. Passenger Cars

        9.3.2. Commercial Vehicles

    9.4. Market Attractiveness Analysis By Vehicle Type

10. Global Market Analysis 2018 to 2022 and Forecast 2023 to 2033, By Sales Channel Type

    10.1. Introduction / Key Findings

    10.2. Historical Market Size (US$ Million) and Volume Analysis By Sales Channel Type, 2018 to 2022

    10.3. Current and Future Market Size (US$ Million) and Volume Analysis and Forecast By Sales Channel Type, 2023 to 2033

        10.3.1. OEM

        10.3.2. Aftermarket

    10.4. Market Attractiveness Analysis By Sales Channel Type

11. Global Market Analysis 2018 to 2022 and Forecast 2023 to 2033, by Region

    11.1. Introduction

    11.2. Historical Market Size (US$ Million) and Volume Analysis By Region, 2018 to 2022

    11.3. Current Market Size (US$ Million) and Volume Analysis and Forecast By Region, 2023 to 2033

        11.3.1. North America

        11.3.2. Latin America

        11.3.3. East Asia

        11.3.4. South Asia Pacific

        11.3.5. Western Europe

        11.3.6. Eastern Europe

        11.3.7. Middle East and Africa (MEA)

    11.4. Market Attractiveness Analysis By Region

12. North America Market Analysis 2018 to 2022 and Forecast 2023 to 2033

    12.1. Introduction

    12.2. Historical Market Size (US$ Million) and Volume Trend Analysis By Market Taxonomy, 2018 to 2022

    12.3. Market Size (US$ Million) and Volume Forecast By Market Taxonomy, 2023 to 2033

        12.3.1. By Country

            12.3.1.1. USA

            12.3.1.2. Canada

            12.3.1.3. Mexico

        12.3.2. By Vehicle Type

        12.3.3. By Sales Channel Type

    12.4. Market Attractiveness Analysis

        12.4.1. By Country

        12.4.2. By Vehicle Type

        12.4.3. By Sales Channel Type

13. Latin America Market Analysis 2018 to 2022 and Forecast 2023 to 2033

    13.1. Introduction

    13.2. Historical Market Size (US$ Million) and Volume Trend Analysis By Market Taxonomy, 2018 to 2022

    13.3. Market Size (US$ Million) and Volume Forecast By Market Taxonomy, 2023 to 2033

        13.3.1. By Country

            13.3.1.1. Brazil

            13.3.1.2. Chile

            13.3.1.3. Rest of Latin America

        13.3.2. By Vehicle Type

        13.3.3. By Sales Channel Type

    13.4. Market Attractiveness Analysis

        13.4.1. By Country

        13.4.2. By Vehicle Type

        13.4.3. By Sales Channel Type

14. East Asia Market Analysis 2018 to 2022 and Forecast 2023 to 2033

    14.1. Introduction

    14.2. Historical Market Size (US$ Million) and Volume Trend Analysis By Market Taxonomy, 2018 to 2022

    14.3. Market Size (US$ Million) and Volume Forecast By Market Taxonomy, 2023 to 2033

        14.3.1. By Country

            14.3.1.1. China

            14.3.1.2. Japan

            14.3.1.3. South Korea

        14.3.2. By Vehicle Type

        14.3.3. By Sales Channel Type

    14.4. Market Attractiveness Analysis

        14.4.1. By Country

        14.4.2. By Vehicle Type

        14.4.3. By Sales Channel Type

15. South Asia Pacific Market Analysis 2018 to 2022 and Forecast 2023 to 2033

    15.1. Introduction

    15.2. Historical Market Size (US$ Million) and Volume Trend Analysis By Market Taxonomy, 2018 to 2022

    15.3. Market Size (US$ Million) and Volume Forecast By Market Taxonomy, 2023 to 2033

        15.3.1. By Country

            15.3.1.1. India

            15.3.1.2. ASEAN

            15.3.1.3. ANZ

            15.3.1.4. Rest of SAP

        15.3.2. By Vehicle Type

        15.3.3. By Sales Channel Type

    15.4. Market Attractiveness Analysis

        15.4.1. By Country

        15.4.2. By Vehicle Type

        15.4.3. By Sales Channel Type

16. Western Europe Market Analysis 2018 to 2022 and Forecast 2023 to 2033

    16.1. Introduction

    16.2. Historical Market Size (US$ Million) and Volume Trend Analysis By Market Taxonomy, 2018 to 2022

    16.3. Market Size (US$ Million) and Volume Forecast By Market Taxonomy, 2023 to 2033

        16.3.1. By Country

            16.3.1.1. Germany

            16.3.1.2. Italy

            16.3.1.3. France

            16.3.1.4. UK

            16.3.1.5. Spain

            16.3.1.6. BENELUX

            16.3.1.7. NORDICS

            16.3.1.8. Rest of W. Europe

        16.3.2. By Vehicle Type

        16.3.3. By Sales Channel Type

    16.4. Market Attractiveness Analysis

        16.4.1. By Country

        16.4.2. By Vehicle Type

        16.4.3. By Sales Channel Type

17. Eastern Europe Market Analysis 2018 to 2022 and Forecast 2023 to 2033

    17.1. Introduction

    17.2. Historical Market Size (US$ Million) and Volume Trend Analysis By Market Taxonomy, 2018 to 2022

    17.3. Market Size (US$ Million) and Volume Forecast By Market Taxonomy, 2023 to 2033

        17.3.1. By Country

            17.3.1.1. Russia

            17.3.1.2. Poland

            17.3.1.3. Hungary

            17.3.1.4. Balkan & Baltics

            17.3.1.5. Rest of E. Europe

        17.3.2. By Vehicle Type

        17.3.3. By Sales Channel Type

    17.4. Market Attractiveness Analysis

        17.4.1. By Country

        17.4.2. By Vehicle Type

        17.4.3. By Sales Channel Type

18. Middle East and Africa Market Analysis 2018 to 2022 and Forecast 2023 to 2033

    18.1. Introduction

    18.2. Historical Market Size (US$ Million) and Volume Trend Analysis By Market Taxonomy, 2018 to 2022

    18.3. Market Size (US$ Million) and Volume Forecast By Market Taxonomy, 2023 to 2033

        18.3.1. By Country

            18.3.1.1. KSA

            18.3.1.2. Other GCC Countries

            18.3.1.3. Türkiye

            18.3.1.4. South Africa

            18.3.1.5. Other African Union

            18.3.1.6. Rest of MEA

        18.3.2. By Vehicle Type

        18.3.3. By Sales Channel Type

    18.4. Market Attractiveness Analysis

        18.4.1. By Country

        18.4.2. By Vehicle Type

        18.4.3. By Sales Channel Type

19. Country-wise Market Analysis

    19.1. Introduction

        19.1.1. Market Value Proportion Analysis, By Key Countries

        19.1.2. Global Vs. Country Growth Comparison

    19.2. USA Market Analysis

        19.2.1. By Vehicle Type

        19.2.2. By Sales Channel Type

    19.3. Canada Market Analysis

        19.3.1. By Vehicle Type

        19.3.2. By Sales Channel Type

    19.4. Mexico Market Analysis

        19.4.1. By Vehicle Type

        19.4.2. By Sales Channel Type

    19.5. Brazil Market Analysis

        19.5.1. By Vehicle Type

        19.5.2. By Sales Channel Type

    19.6. Chile Market Analysis

        19.6.1. By Vehicle Type

        19.6.2. By Sales Channel Type

    19.7. China Market Analysis

        19.7.1. By Vehicle Type

        19.7.2. By Sales Channel Type

    19.8. Japan Market Analysis

        19.8.1. By Vehicle Type

        19.8.2. By Sales Channel Type

    19.9. South Korea Market Analysis

        19.9.1. By Vehicle Type

        19.9.2. By Sales Channel Type

    19.10. India Market Analysis

        19.10.1. By Vehicle Type

        19.10.2. By Sales Channel Type

    19.11. ASEAN Market Analysis

        19.11.1. By Vehicle Type

        19.11.2. By Sales Channel Type

    19.12. ANZ Market Analysis

        19.12.1. By Vehicle Type

        19.12.2. By Sales Channel Type

    19.13. Germany Market Analysis

        19.13.1. By Vehicle Type

        19.13.2. By Sales Channel Type

    19.14. Italy Market Analysis

        19.14.1. By Vehicle Type

        19.14.2. By Sales Channel Type

    19.15. France Market Analysis

        19.15.1. By Vehicle Type

        19.15.2. By Sales Channel Type

    19.16. UK Market Analysis

        19.16.1. By Vehicle Type

        19.16.2. By Sales Channel Type

    19.17. Spain Market Analysis

        19.17.1. By Vehicle Type

        19.17.2. By Sales Channel Type

    19.18. BENELUX Market Analysis

        19.18.1. By Vehicle Type

        19.18.2. By Sales Channel Type

    19.19. NORDICS Market Analysis

        19.19.1. By Vehicle Type

        19.19.2. By Sales Channel Type

    19.20. Russia Market Analysis

        19.20.1. By Vehicle Type

        19.20.2. By Sales Channel Type

    19.21. Poland Market Analysis

        19.21.1. By Vehicle Type

        19.21.2. By Sales Channel Type

    19.22. Hungary Market Analysis

        19.22.1. By Vehicle Type

        19.22.2. By Sales Channel Type

    19.23. Balkan & Baltics Market Analysis

        19.23.1. By Vehicle Type

        19.23.2. By Sales Channel Type

    19.24. KSA Market Analysis

        19.24.1. By Vehicle Type

        19.24.2. By Sales Channel Type

    19.25. Other GCC Countries Market Analysis

        19.25.1. By Vehicle Type

        19.25.2. By Sales Channel Type

    19.26. Turkiye Market Analysis

        19.26.1. By Vehicle Type

        19.26.2. By Sales Channel Type

    19.27. South Africa Market Analysis

        19.27.1. By Vehicle Type

        19.27.2. By Sales Channel Type

    19.28. Other African Union Market Analysis

        19.28.1. By Vehicle Type

        19.28.2. By Sales Channel Type

20. Market Structure Analysis

    20.1. Market Analysis by Tier of Companies

    20.2. Market Concentration

    20.3. Market Share Analysis of Top Players

    20.4. Market Presence Analysis

        20.4.1. By Product Footprint of Players

        20.4.2. By Regional Footprint of Players

        20.4.3. By Application Footprint of Players

    20.5. Key Players Brand Mapping

21. Competition Analysis

    21.1. Competition Dashboard

    21.2. Competition Benchmarking

    21.3. Competition Deep Dive

        21.3.1. Amphenol Corporation

            21.3.1.1. Overview

            21.3.1.2. Product Portfolio

            21.3.1.3. Profitability by Market Segments (Product/Channel/Region)

            21.3.1.4. Sales Footprint

            21.3.1.5. Strategy Overview

        21.3.2. Sensirion AG Switzerland

        21.3.3. Paragon AG

        21.3.4. Valeo

        21.3.5. Sensata Technologies, Inc.

        21.3.6. Honeywell International Inc.

        21.3.7. ams AG

        21.3.8. OMRON Corporation

        21.3.9. Figaro Engineering Inc.

        21.3.10. Prodrive Technologies

        21.3.11. UST Umweltsensortechnik GmbH

        21.3.12. Chemisense Inc.

        21.3.13. MicroJet Technology

        21.3.14. Infineon Technologies AG

        21.3.15. Other Key Players

22. Assumptions and Acronyms Used

23. Research Methodology

Don't pay for what you don't need

Customize your report by selecting specific countries or regions and save 30%!

List of Tables

Table 1: Global Market Value (US$ Million) Forecast by Region, 2018 & 2033

Table 2: Global Market Volume (Unit) Forecast by Region, 2018 & 2033

Table 3: Global Market Value (US$ Million) Forecast by Vehicle Type, 2018 & 2033

Table 4: Global Market Volume (Unit) Forecast by Vehicle Type, 2018 & 2033

Table 5: Global Market Value (US$ Million) Forecast by Sales Channel Type, 2018 & 2033

Table 6: Global Market Volume (Unit) Forecast by Sales Channel Type, 2018 & 2033

Table 7: North America Market Value (US$ Million) Forecast by Country, 2018 & 2033

Table 8: North America Market Volume (Unit) Forecast by Country, 2018 & 2033

Table 9: North America Market Value (US$ Million) Forecast by Vehicle Type, 2018 & 2033

Table 10: North America Market Volume (Unit) Forecast by Vehicle Type, 2018 & 2033

Table 11: North America Market Value (US$ Million) Forecast by Sales Channel Type, 2018 & 2033

Table 12: North America Market Volume (Unit) Forecast by Sales Channel Type, 2018 & 2033

Table 13: Latin America Market Value (US$ Million) Forecast by Country, 2018 & 2033

Table 14: Latin America Market Volume (Unit) Forecast by Country, 2018 & 2033

Table 15: Latin America Market Value (US$ Million) Forecast by Vehicle Type, 2018 & 2033

Table 16: Latin America Market Volume (Unit) Forecast by Vehicle Type, 2018 & 2033

Table 17: Latin America Market Value (US$ Million) Forecast by Sales Channel Type, 2018 & 2033

Table 18: Latin America Market Volume (Unit) Forecast by Sales Channel Type, 2018 & 2033

Table 19: Western Europe Market Value (US$ Million) Forecast by Country, 2018 & 2033

Table 20: Western Europe Market Volume (Unit) Forecast by Country, 2018 & 2033

Table 21: Western Europe Market Value (US$ Million) Forecast by Vehicle Type, 2018 & 2033

Table 22: Western Europe Market Volume (Unit) Forecast by Vehicle Type, 2018 & 2033

Table 23: Western Europe Market Value (US$ Million) Forecast by Sales Channel Type, 2018 & 2033

Table 24: Western Europe Market Volume (Unit) Forecast by Sales Channel Type, 2018 & 2033

Table 25: Eastern Europe Market Value (US$ Million) Forecast by Country, 2018 & 2033

Table 26: Eastern Europe Market Volume (Unit) Forecast by Country, 2018 & 2033

Table 27: Eastern Europe Market Value (US$ Million) Forecast by Vehicle Type, 2018 & 2033

Table 28: Eastern Europe Market Volume (Unit) Forecast by Vehicle Type, 2018 & 2033

Table 29: Eastern Europe Market Value (US$ Million) Forecast by Sales Channel Type, 2018 & 2033

Table 30: Eastern Europe Market Volume (Unit) Forecast by Sales Channel Type, 2018 & 2033

Table 31: East Asia Market Value (US$ Million) Forecast by Country, 2018 & 2033

Table 32: East Asia Market Volume (Unit) Forecast by Country, 2018 & 2033

Table 33: East Asia Market Value (US$ Million) Forecast by Vehicle Type, 2018 & 2033

Table 34: East Asia Market Volume (Unit) Forecast by Vehicle Type, 2018 & 2033

Table 35: East Asia Market Value (US$ Million) Forecast by Sales Channel Type, 2018 & 2033

Table 36: East Asia Market Volume (Unit) Forecast by Sales Channel Type, 2018 & 2033

Table 37: South Asia Pacific Market Value (US$ Million) Forecast by Country, 2018 & 2033

Table 38: South Asia Pacific Market Volume (Unit) Forecast by Country, 2018 & 2033

Table 39: South Asia Pacific Market Value (US$ Million) Forecast by Vehicle Type, 2018 & 2033

Table 40: South Asia Pacific Market Volume (Unit) Forecast by Vehicle Type, 2018 & 2033

Table 41: South Asia Pacific Market Value (US$ Million) Forecast by Sales Channel Type, 2018 & 2033

Table 42: South Asia Pacific Market Volume (Unit) Forecast by Sales Channel Type, 2018 & 2033

Table 43: Middle East & Africa Market Value (US$ Million) Forecast by Country, 2018 & 2033

Table 44: Middle East & Africa Market Volume (Unit) Forecast by Country, 2018 & 2033

Table 45: Middle East & Africa Market Value (US$ Million) Forecast by Vehicle Type, 2018 & 2033

Table 46: Middle East & Africa Market Volume (Unit) Forecast by Vehicle Type, 2018 & 2033

Table 47: Middle East & Africa Market Value (US$ Million) Forecast by Sales Channel Type, 2018 & 2033

Table 48: Middle East & Africa Market Volume (Unit) Forecast by Sales Channel Type, 2018 & 2033
Nikhil Kaitwade
Nikhil Kaitwade

Principal Consultant

Talk to Analyst

Find your sweet spots for generating winning opportunities in this market.

List of Charts

Figure 1: Global Market Value (US$ Million) by Vehicle Type, 2023 & 2033

Figure 2: Global Market Value (US$ Million) by Sales Channel Type, 2023 & 2033

Figure 3: Global Market Value (US$ Million) by Region, 2023 & 2033

Figure 4: Global Market Value (US$ Million) Analysis by Region, 2018 & 2033

Figure 5: Global Market Volume (Unit) Analysis by Region, 2018 & 2033

Figure 6: Global Market Value Share (%) and BPS Analysis by Region, 2023 & 2033

Figure 7: Global Market Y-o-Y Growth (%) Projections by Region, 2023 to 2033

Figure 8: Global Market Value (US$ Million) Analysis by Vehicle Type, 2018 & 2033

Figure 9: Global Market Volume (Unit) Analysis by Vehicle Type, 2018 & 2033

Figure 10: Global Market Value Share (%) and BPS Analysis by Vehicle Type, 2023 & 2033

Figure 11: Global Market Y-o-Y Growth (%) Projections by Vehicle Type, 2023 to 2033

Figure 12: Global Market Value (US$ Million) Analysis by Sales Channel Type, 2018 & 2033

Figure 13: Global Market Volume (Unit) Analysis by Sales Channel Type, 2018 & 2033

Figure 14: Global Market Value Share (%) and BPS Analysis by Sales Channel Type, 2023 & 2033

Figure 15: Global Market Y-o-Y Growth (%) Projections by Sales Channel Type, 2023 to 2033

Figure 16: Global Market Attractiveness by Vehicle Type, 2023 to 2033

Figure 17: Global Market Attractiveness by Sales Channel Type, 2023 to 2033

Figure 18: Global Market Attractiveness by Region, 2023 to 2033

Figure 19: North America Market Value (US$ Million) by Vehicle Type, 2023 & 2033

Figure 20: North America Market Value (US$ Million) by Sales Channel Type, 2023 & 2033

Figure 21: North America Market Value (US$ Million) by Country, 2023 & 2033

Figure 22: North America Market Value (US$ Million) Analysis by Country, 2018 & 2033

Figure 23: North America Market Volume (Unit) Analysis by Country, 2018 & 2033

Figure 24: North America Market Value Share (%) and BPS Analysis by Country, 2023 & 2033

Figure 25: North America Market Y-o-Y Growth (%) Projections by Country, 2023 to 2033

Figure 26: North America Market Value (US$ Million) Analysis by Vehicle Type, 2018 & 2033

Figure 27: North America Market Volume (Unit) Analysis by Vehicle Type, 2018 & 2033

Figure 28: North America Market Value Share (%) and BPS Analysis by Vehicle Type, 2023 & 2033

Figure 29: North America Market Y-o-Y Growth (%) Projections by Vehicle Type, 2023 to 2033

Figure 30: North America Market Value (US$ Million) Analysis by Sales Channel Type, 2018 & 2033

Figure 31: North America Market Volume (Unit) Analysis by Sales Channel Type, 2018 & 2033

Figure 32: North America Market Value Share (%) and BPS Analysis by Sales Channel Type, 2023 & 2033

Figure 33: North America Market Y-o-Y Growth (%) Projections by Sales Channel Type, 2023 to 2033

Figure 34: North America Market Attractiveness by Vehicle Type, 2023 to 2033

Figure 35: North America Market Attractiveness by Sales Channel Type, 2023 to 2033

Figure 36: North America Market Attractiveness by Country, 2023 to 2033

Figure 37: Latin America Market Value (US$ Million) by Vehicle Type, 2023 & 2033

Figure 38: Latin America Market Value (US$ Million) by Sales Channel Type, 2023 & 2033

Figure 39: Latin America Market Value (US$ Million) by Country, 2023 & 2033

Figure 40: Latin America Market Value (US$ Million) Analysis by Country, 2018 & 2033

Figure 41: Latin America Market Volume (Unit) Analysis by Country, 2018 & 2033

Figure 42: Latin America Market Value Share (%) and BPS Analysis by Country, 2023 & 2033

Figure 43: Latin America Market Y-o-Y Growth (%) Projections by Country, 2023 to 2033

Figure 44: Latin America Market Value (US$ Million) Analysis by Vehicle Type, 2018 & 2033

Figure 45: Latin America Market Volume (Unit) Analysis by Vehicle Type, 2018 & 2033

Figure 46: Latin America Market Value Share (%) and BPS Analysis by Vehicle Type, 2023 & 2033

Figure 47: Latin America Market Y-o-Y Growth (%) Projections by Vehicle Type, 2023 to 2033

Figure 48: Latin America Market Value (US$ Million) Analysis by Sales Channel Type, 2018 & 2033

Figure 49: Latin America Market Volume (Unit) Analysis by Sales Channel Type, 2018 & 2033

Figure 50: Latin America Market Value Share (%) and BPS Analysis by Sales Channel Type, 2023 & 2033

Figure 51: Latin America Market Y-o-Y Growth (%) Projections by Sales Channel Type, 2023 to 2033

Figure 52: Latin America Market Attractiveness by Vehicle Type, 2023 to 2033

Figure 53: Latin America Market Attractiveness by Sales Channel Type, 2023 to 2033

Figure 54: Latin America Market Attractiveness by Country, 2023 to 2033

Figure 55: Western Europe Market Value (US$ Million) by Vehicle Type, 2023 & 2033

Figure 56: Western Europe Market Value (US$ Million) by Sales Channel Type, 2023 & 2033

Figure 57: Western Europe Market Value (US$ Million) by Country, 2023 & 2033

Figure 58: Western Europe Market Value (US$ Million) Analysis by Country, 2018 & 2033

Figure 59: Western Europe Market Volume (Unit) Analysis by Country, 2018 & 2033

Figure 60: Western Europe Market Value Share (%) and BPS Analysis by Country, 2023 & 2033

Figure 61: Western Europe Market Y-o-Y Growth (%) Projections by Country, 2023 to 2033

Figure 62: Western Europe Market Value (US$ Million) Analysis by Vehicle Type, 2018 & 2033

Figure 63: Western Europe Market Volume (Unit) Analysis by Vehicle Type, 2018 & 2033

Figure 64: Western Europe Market Value Share (%) and BPS Analysis by Vehicle Type, 2023 & 2033

Figure 65: Western Europe Market Y-o-Y Growth (%) Projections by Vehicle Type, 2023 to 2033

Figure 66: Western Europe Market Value (US$ Million) Analysis by Sales Channel Type, 2018 & 2033

Figure 67: Western Europe Market Volume (Unit) Analysis by Sales Channel Type, 2018 & 2033

Figure 68: Western Europe Market Value Share (%) and BPS Analysis by Sales Channel Type, 2023 & 2033

Figure 69: Western Europe Market Y-o-Y Growth (%) Projections by Sales Channel Type, 2023 to 2033

Figure 70: Western Europe Market Attractiveness by Vehicle Type, 2023 to 2033

Figure 71: Western Europe Market Attractiveness by Sales Channel Type, 2023 to 2033

Figure 72: Western Europe Market Attractiveness by Country, 2023 to 2033

Figure 73: Eastern Europe Market Value (US$ Million) by Vehicle Type, 2023 & 2033

Figure 74: Eastern Europe Market Value (US$ Million) by Sales Channel Type, 2023 & 2033

Figure 75: Eastern Europe Market Value (US$ Million) by Country, 2023 & 2033

Figure 76: Eastern Europe Market Value (US$ Million) Analysis by Country, 2018 & 2033

Figure 77: Eastern Europe Market Volume (Unit) Analysis by Country, 2018 & 2033

Figure 78: Eastern Europe Market Value Share (%) and BPS Analysis by Country, 2023 & 2033

Figure 79: Eastern Europe Market Y-o-Y Growth (%) Projections by Country, 2023 to 2033

Figure 80: Eastern Europe Market Value (US$ Million) Analysis by Vehicle Type, 2018 & 2033

Figure 81: Eastern Europe Market Volume (Unit) Analysis by Vehicle Type, 2018 & 2033

Figure 82: Eastern Europe Market Value Share (%) and BPS Analysis by Vehicle Type, 2023 & 2033

Figure 83: Eastern Europe Market Y-o-Y Growth (%) Projections by Vehicle Type, 2023 to 2033

Figure 84: Eastern Europe Market Value (US$ Million) Analysis by Sales Channel Type, 2018 & 2033

Figure 85: Eastern Europe Market Volume (Unit) Analysis by Sales Channel Type, 2018 & 2033

Figure 86: Eastern Europe Market Value Share (%) and BPS Analysis by Sales Channel Type, 2023 & 2033

Figure 87: Eastern Europe Market Y-o-Y Growth (%) Projections by Sales Channel Type, 2023 to 2033

Figure 88: Eastern Europe Market Attractiveness by Vehicle Type, 2023 to 2033

Figure 89: Eastern Europe Market Attractiveness by Sales Channel Type, 2023 to 2033

Figure 90: Eastern Europe Market Attractiveness by Country, 2023 to 2033

Figure 91: East Asia Market Value (US$ Million) by Vehicle Type, 2023 & 2033

Figure 92: East Asia Market Value (US$ Million) by Sales Channel Type, 2023 & 2033

Figure 93: East Asia Market Value (US$ Million) by Country, 2023 & 2033

Figure 94: East Asia Market Value (US$ Million) Analysis by Country, 2018 & 2033

Figure 95: East Asia Market Volume (Unit) Analysis by Country, 2018 & 2033

Figure 96: East Asia Market Value Share (%) and BPS Analysis by Country, 2023 & 2033

Figure 97: East Asia Market Y-o-Y Growth (%) Projections by Country, 2023 to 2033

Figure 98: East Asia Market Value (US$ Million) Analysis by Vehicle Type, 2018 & 2033

Figure 99: East Asia Market Volume (Unit) Analysis by Vehicle Type, 2018 & 2033

Figure 100: East Asia Market Value Share (%) and BPS Analysis by Vehicle Type, 2023 & 2033

Figure 101: East Asia Market Y-o-Y Growth (%) Projections by Vehicle Type, 2023 to 2033

Figure 102: East Asia Market Value (US$ Million) Analysis by Sales Channel Type, 2018 & 2033

Figure 103: East Asia Market Volume (Unit) Analysis by Sales Channel Type, 2018 & 2033

Figure 104: East Asia Market Value Share (%) and BPS Analysis by Sales Channel Type, 2023 & 2033

Figure 105: East Asia Market Y-o-Y Growth (%) Projections by Sales Channel Type, 2023 to 2033

Figure 106: East Asia Market Attractiveness by Vehicle Type, 2023 to 2033

Figure 107: East Asia Market Attractiveness by Sales Channel Type, 2023 to 2033

Figure 108: East Asia Market Attractiveness by Country, 2023 to 2033

Figure 109: South Asia Pacific Market Value (US$ Million) by Vehicle Type, 2023 & 2033

Figure 110: South Asia Pacific Market Value (US$ Million) by Sales Channel Type, 2023 & 2033

Figure 111: South Asia Pacific Market Value (US$ Million) by Country, 2023 & 2033

Figure 112: South Asia Pacific Market Value (US$ Million) Analysis by Country, 2018 & 2033

Figure 113: South Asia Pacific Market Volume (Unit) Analysis by Country, 2018 & 2033

Figure 114: South Asia Pacific Market Value Share (%) and BPS Analysis by Country, 2023 & 2033

Figure 115: South Asia Pacific Market Y-o-Y Growth (%) Projections by Country, 2023 to 2033

Figure 116: South Asia Pacific Market Value (US$ Million) Analysis by Vehicle Type, 2018 & 2033

Figure 117: South Asia Pacific Market Volume (Unit) Analysis by Vehicle Type, 2018 & 2033

Figure 118: South Asia Pacific Market Value Share (%) and BPS Analysis by Vehicle Type, 2023 & 2033

Figure 119: South Asia Pacific Market Y-o-Y Growth (%) Projections by Vehicle Type, 2023 to 2033

Figure 120: South Asia Pacific Market Value (US$ Million) Analysis by Sales Channel Type, 2018 & 2033

Figure 121: South Asia Pacific Market Volume (Unit) Analysis by Sales Channel Type, 2018 & 2033

Figure 122: South Asia Pacific Market Value Share (%) and BPS Analysis by Sales Channel Type, 2023 & 2033

Figure 123: South Asia Pacific Market Y-o-Y Growth (%) Projections by Sales Channel Type, 2023 to 2033

Figure 124: South Asia Pacific Market Attractiveness by Vehicle Type, 2023 to 2033

Figure 125: South Asia Pacific Market Attractiveness by Sales Channel Type, 2023 to 2033

Figure 126: South Asia Pacific Market Attractiveness by Country, 2023 to 2033

Figure 127: Middle East & Africa Market Value (US$ Million) by Vehicle Type, 2023 & 2033

Figure 128: Middle East & Africa Market Value (US$ Million) by Sales Channel Type, 2023 & 2033

Figure 129: Middle East & Africa Market Value (US$ Million) by Country, 2023 & 2033

Figure 130: Middle East & Africa Market Value (US$ Million) Analysis by Country, 2018 & 2033

Figure 131: Middle East & Africa Market Volume (Unit) Analysis by Country, 2018 & 2033

Figure 132: Middle East & Africa Market Value Share (%) and BPS Analysis by Country, 2023 & 2033

Figure 133: Middle East & Africa Market Y-o-Y Growth (%) Projections by Country, 2023 to 2033

Figure 134: Middle East & Africa Market Value (US$ Million) Analysis by Vehicle Type, 2018 & 2033

Figure 135: Middle East & Africa Market Volume (Unit) Analysis by Vehicle Type, 2018 & 2033

Figure 136: Middle East & Africa Market Value Share (%) and BPS Analysis by Vehicle Type, 2023 & 2033

Figure 137: Middle East & Africa Market Y-o-Y Growth (%) Projections by Vehicle Type, 2023 to 2033

Figure 138: Middle East & Africa Market Value (US$ Million) Analysis by Sales Channel Type, 2018 & 2033

Figure 139: Middle East & Africa Market Volume (Unit) Analysis by Sales Channel Type, 2018 & 2033

Figure 140: Middle East & Africa Market Value Share (%) and BPS Analysis by Sales Channel Type, 2023 & 2033

Figure 141: Middle East & Africa Market Y-o-Y Growth (%) Projections by Sales Channel Type, 2023 to 2033

Figure 142: Middle East & Africa Market Attractiveness by Vehicle Type, 2023 to 2033

Figure 143: Middle East & Africa Market Attractiveness by Sales Channel Type, 2023 to 2033

Figure 144: Middle East & Africa Market Attractiveness by Country, 2023 to 2033

Recommendations

Technology

Indoor Air Quality Monitor Market

Published : August 2023

Automotive

Aircraft Cabin Interior Market

Published : June 2023

Explore Automotive Insights

View Reports

Automotive Cabin Air Quality Sensors Market