Automotive Ignition Coil Market Forecast and Outlook from 2025 to 2035

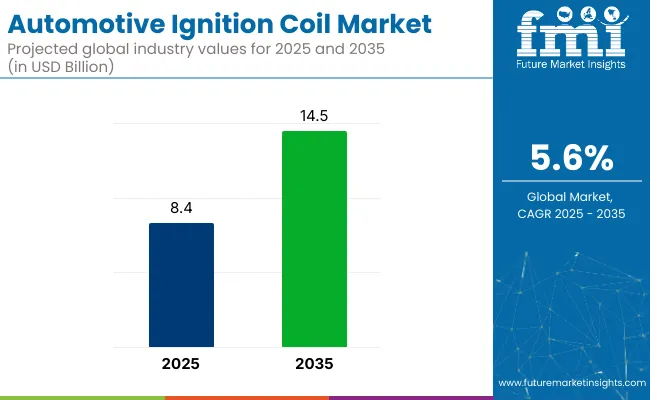
The global automotive ignition coil market is forecast to grow from USD 8.4 billion in 2025 to USD 14.5 billion by 2035, reflecting a compound annual growth rate (CAGR) of 5.6%. This expansion is being driven by rising vehicle production, stringent emissions standards, and growing demand for ignition system efficiency.

In Q1 2025, Standard Motor Products (SMP) released 170 new ignition coil part numbers, increasing coverage for late-model import and domestic vehicles. SMP’s ignition coil range now exceeds 800 SKUs, delivering near-complete coverage and extended service life. All of its coils are manufactured and validated in its IATF 16949-certified plant in Poland. Eric Sills, SMP’s CEO, confirmed that product expansion is aligned with rising demand for reliable ignition across powertrain types.

In 2023, Niterra (formerly NGK Spark Plug) introduced 29 new ignition coil references, increasing compatibility with key platforms such as Ford EcoBoost, Mazda, and Renault. The upgrade focused on emissions-compliant engines and covered over 2 million vehicles in the EMEA market. Michael Burchi, General Manager at Niterra North America, stated that the new “MOD Performance” coils were introduced to meet demand in the performance segment.

Growth in electric and hybrid vehicle output has prompted rising interest in ignition system maintenance and aftermarket readiness. Although EVs do not use traditional ignition coils, hybrids combine EFI systems with motors, increasing coil usage in certain segments. Regulatory tightening under Euro 7 and USA Tier 3 standards is also reinforcing market dynamics by mandating precise ignition timing and stable combustion profiles across vehicle lines.
Automotive Ignition Coil Market

Metric Value
Industry Size (2025E) USD 8.4 billion
Industry Value (2035F) USD 14.5 billion
CAGR (2025 to 2035) 5.6%

Supply chain digitalisation is improving coil design and traceability. Both SMP and Niterra have deployed traceability codes and QC protocols across their production lines. These controls are being used to identify defective coils early and ensure compliance with OEM specifications during engine assembly.

Emerging markets in Southeast Asia and Latin America are contributing to volume growth. Local manufacturers are ramping up production to support increasing vehicle platforms, especially in regional hatchbacks, sedans, and compact SUVs.

Through the forecast decade, emphasis on combustion engine refinement, emissions reduction, and vehicle reliability is anticipated to sustain ignition coil demand. Technological advancements in coil durability, thermal resistance, and corrosion protection will be critical. Both OEM and aftermarket players are expected to pursue greater material enhancements and validation protocols to meet evolving requirements and support the market growth.

Analyzing Automotive Ignition Coil Market by Top Investment Segments

Electronic distributor coils are projected to maintain a strong position with continued use in entry-level and economy vehicle ignition systems

Electronic distributor coils are estimated to account for approximately 18.5% of the global automotive ignition coil market share in 2025 and are projected to grow at a CAGR of 5.4% through 2035. These coils are primarily used in distributor-based ignition systems and offer a cost-effective solution for multi-cylinder engine configurations.

While coil-on-plug (COP) and pencil coil systems dominate modern passenger vehicles, electronic distributor coils remain relevant in emerging markets where legacy vehicle architectures persist. Their integration into budget-oriented platforms, especially in regions with high two-wheeler and small car density, ensures sustained demand. Manufacturers continue to improve winding materials, housing durability, and thermal performance to extend lifecycle and reduce misfire rates under varying load conditions.

Two-wheelers are expected to contribute significantly to ignition coil demand with strong production volumes across Asia-Pacific

Two-wheelers are projected to account for nearly 22% of the global ignition coil market share in 2025 and are expected to grow at a CAGR of 5.7% through 2035. High ownership rates, expanding urban mobility, and frequent ignition cycling support steady demand for compact, reliable ignition coil systems in motorcycles, scooters, and mopeds.

In markets like India, Indonesia, and Vietnam-where two-wheeler production accounts for a significant share of total vehicle output-ignition coil replacement and OEM fitment remain critical for both performance and emissions compliance.

Suppliers are focused on delivering moisture-resistant, vibration-dampened ignition coils optimized for small displacement engines and variable ignition timing control, particularly in fuel-injected and BS-VI/Euro 5 compliant models. As electrification gradually influences the two-wheeler segment, ignition coil demand continues to remain robust in the ICE-dominated short-term landscape.

Challenges

Electrification of Powertrains and the Decline of ICE in the Long Run

Pure electrification of battery vehicles (BEVs) and the easier decline of the ignition coil market is pure electric vehicles no longer need igniters. Governments across Europe, China, and North America are offering incentive packages and introducing regulations to push the EV market which could start the decay of the reach of ignition coil producers step by step.

The effect will be delayed but in the medium course, hybrids will play it back, for instance, the plug-in and mild ones which require ignition coils. They have to make innovations in application hybrids and to hedge their bets against this transition, they need to diversify into EV thermal and electronic systems.

Fakes and Low-Quality Parts in the Aftermarket

In some up-and-coming economies, the aftermarket is troubled with counterfeit ignition coils and substandard products. Many of these items fail too early or do not do their jobs well leading to damaged spark plugs, poor gas mileage, and pollution. For OEMs and branded suppliers, it also affects their brand reputation and consumer trust.

Manufacturers are combating this challenge through technology as they are investing in track-and-trace technology, tamper-proof packaging, and educational campaigns to differentiate genuine parts from counterfeit. Theƒ enlargement of authenticated service centers and e-commerce channels can also ensure that certified ignition systems are easily accessed.

Opportunities

Amp in Hybrid and Turbocharged Engine Applications

The increasing appropriation of hybrid powertrains and turbocharged machines is opening up a whole new area of implantation for high-performance ignition coils. Sterling gas engines must fully swallow ignition during the moment of fission, thus their advanced capacity overload and multi-spark systems are immensely helpful.

Original Equipment Manufacturers have now come up with technical strategies like integrating low-resistance windings, epoxy-filled housings, and high-dielectric-strength materials in ignition systems for the sake of fuel efficiency and emission standards.With this, they proof that they are environmentally friendly. The suppliers of the special coils available for hybrid engines can secure a leading position on the market.

Fast and Performance Upgrades in the Aftermarket

The existing car segment is getting transformed into a real forced beater in which many people demand increased car performance, especially in North America and Europe; this, in turn, is leading to the development of aftermarket performance kits such as high-voltage ignition coils for sports.

We offer a wide range of goods from premium coil packs to race-grade components and plug-and-play upgrade kits that are fitted into cars easily and quickly with the goal of making cars more performant.

On top of that, the burgeon of DIY vehicle maintenance cultures and online retail shops is making it easier and far cheaper to acquire branded ignition coils worldwide. Suppliers, in collaboration with aftermarket distributors, auto workshops, and e-retailers will benefit from the linking of supply to the fast-growing segment.
Country-Wise Analysis

Automotive Ignition Coil Market Country Wise Analysis

United States

The territory of the automotive ignition coil imperium of the United States is flourishing unstoppably, owing to the large vehicle park, solid demand in the aftermarket, and continuation of gasoline car models, especially in the light truck and SUV segments. Absorbing the impact of increased adoption of electric vehicles, on the other hand, the internal combustion engine (ICE) vehicles maintain the upper hand, thus, inauguration of new ignition coils still remains a regular thing.

The combination of turbocharged/high-performance engines, along with people's demand for more dependable and fuel-efficient cars leads the manufacturers to devise high-energy and multi-spark coil systems.

  • High levels of ICE vehicles on roads and significant aftermarket replacement demand..
  • Increase of turbo engine usage needing a higher level of spark energy.
  • Use of coil-on-plug (COP) systems increased for better ignition efficiency.
  • Light commercial vehicles and SUVs are expanding.
  • The OEM's choice is a design that is compact and durable.
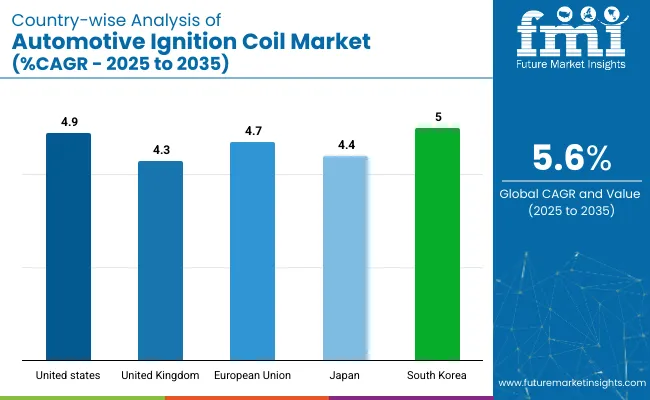
Country CAGR (2025 to 2035)
United States 4.9%

United Kingdom

The automotive ignition coil market in the United Kingdom is experiencing fair growth spurred on by the increasing aftermarket sales, the sale of mild hybrid and ICE vehicles, and the need for periodic maintenance for cars that are aging. However even though electric vehicles are taking off, most cars on UK roads still run on traditional spark ignition systems.

The growing consciousness of engine misfire and emissions is resulting in prompt changing of the ignition components, thus the demand for coil is upheld especially in the fleets and shared vehicles.

  • Fleet of aging vehicles that require regular coil replacements
  • Moderate demand for coil-on-plug and waste spark systems
  • Growth in fleet and ride-hailing vehicle maintenance needs
  • Transition to mild hybrids still retaining internal combustion functionality
  • OEM and aftermarket innovations in fail-safe coil designs.
Country CAGR (2025 to 2035)
United Kingdom 4.3%

European Union

The ignition coil sector of the European Union which includes automotive is steadily increasing owing to the high amount of ICE and hybrid vehicles being produced, most of which are in Germany, France and Italy. Even though the growth of EVs is strong, the large share of gasoline vehicles that are still on the road supports the continuous need for OEMs and aftermarket ignition coils.

The OEMs belonging to the EU are prioritizing the introduction of low-emission and fuel-efficient combustion engines that will be compatible with multi-spark discharge ignition systems. New technologies have been introduced such as multi-spark discharge, and advanced heat-resistant materials which have been making a mark on the product market.

  • ICE and hybrid vehicles mainly consume fuel efficiently.
  • Due to severe emission regulations, the replacement rates are high.
  • For turbocharged petrol engines, multi-spark coils are in demand.
  • Compact, high-voltage coil-on-plug systems are the subject of innovation.
  • The regulatory technically-kick start for low-emission components and diagnostics.
Region CAGR (2025 to 2035)
European Union 4.7%

Japan

The market for automotive ignition coils in Japan is growing at a very slow rate due to the increasing share of EVs; however, the dominance of the hybrid electric vehicles (HEVs) utilizing ignition coils proves that the demand stays steady. Toyota Enterprises and others are utilizing their long-standing technologies for high-efficiency ignition systems which are not only cutting down carbons but also improving gasoline learning.

The focus on kei cars, hybrids, and a compact car line drives even higher demand for pon-space full-life ignition technology, especially in the OEM segment. The fiscal car emission targets in Japan represent international trade as most of the vehicles are exported while the emission output is cut down.

  • High level of hybrid vehicles in market needing ignition systems.
  • Preference for compact, integrated coil-pack units.
  • Strong domestic demand for engine-efficient technologies.
  • Vehicle exports retaining ICE and hybrid configurations.
  • Innovations in lightweight coil design for space-constrained areas.
CAGR (2025 to 2035)
Japan 4.4%

South Korea

The automotive ignition coil in South Korea is hitting a new high as a result of the strong production of gasoline and hybrid vehicles coupled with the technological advancements made by the leading OEMs, such as Hyundai and Kia. The thermal durability, extending the coil winding technology, and vehicle-specific coil pack designs, are the factors that the ignition coil segment benefits from.

Both domestic as well as export-driven manufacturing have contributed to the sustained demand for ignition modules, coil-on-plug as well as coil-near-plug systems, particularly in compact sedans, SUVs, and hybrid models.

  • The OEM putting in money on top-notch ignition parts.
  • The continuous presence of gasoline and hybrid drivetrains.
  • R&D efforts in developing coil designs that are high heat and vibration resistant.
  • Growing in the market of compact crossover and SUV segments.
  • The expansion of sales channels across Asia-Pacific.
Country CAGR (2025 to 2035)
South Korea 5.0%

Competitive Outlook

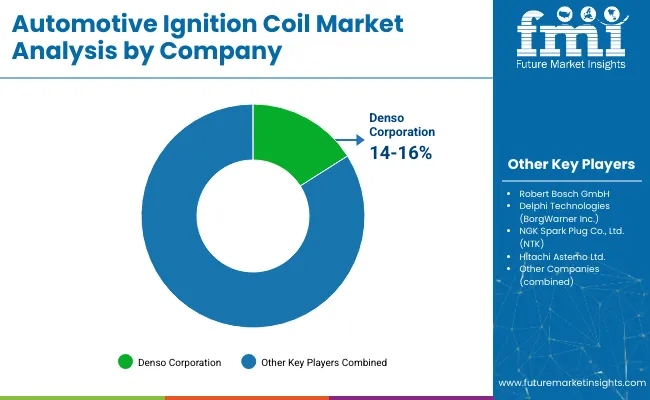
Automotive Ignition Coil Market Analysis By Company

The global automotive ignition coil market is on a roll with the support of the increasing passenger and commercial vehicle production, the growing aftermarket replacement needs, as well as the many fuel-efficient and low-emission engines manufactured. Ignition coils feed the battery voltage into the high-voltage sparks that are needed to mix with the air and fuel for gasoline internal combustion engines (ICEs) and some hybrid vehicles to function.

The trend of OEMs' gradual takeoff to multi-spark systems, coil-on-plug (COP) styles, and smart ignition technologies will speed up the search for compact ignition coils that operate at high-efficiency, and are thermally resistant. In terms of market structure, the industry is somewhat consolidated, with the top five firms covering about 48%-52% of the total global market. These companies are based on their capabilities such as long-lasting OE partnerships, technology licensing, and global manufacturing networks.

Key Players

  • Mitsubishi Electric Corporation
  • Yura Corporation
  • Diamond Electric Mfg. Co., Ltd.
  • Federal-Mogul (DRiV, Tenneco)
  • BERU AG (BorgWarner)
  • Hella GmbH & Co. KGaA
  • Valeo SA
  • Walker Products Inc.
  • Prestolite Electric Inc.
  • MSD Ignition (Holley Performance)

Key Segments

By Product Type:

  • Can-type Ignition Coil
  • Electronic Distributor Coil
  • Double Spark Coil
  • Pencil Ignition Coil
  • Ignition Coil Rail
  • Others

By Vehicle Type:

  • Two Wheelers
  • Passenger Cars
  • Light Commercial Vehicles
  • Heavy Commercial Vehicles

By Sales Channel:

  • First fit
  • Aftermarket

By Region:

  • North America
  • Latin America
  • South Asia & Pacific
  • East Asia
  • Western Europe
  • Eastern Europe
  • Middle East and Africa

Table of Content

  1. Executive Summary
  2. Industry Introduction, including Taxonomy and Market Definition
  3. Market Trends and Success Factors, including Macro-economic Factors, Market Dynamics, and Recent Industry Developments
  4. Global Market Demand Analysis 2020 to 2024 and Forecast 2025 to 2035, including Historical Analysis and Future Projections
  5. Pricing Analysis
  6. Global Market Analysis 2020 to 2024 and Forecast 2025 to 2035
    • Product Type
    • Vehicle Type
    • Sales Channel
  7. Global Market Analysis 2020 to 2024 and Forecast 2025 to 2035, By Product Type
    • Can-Type Ignition Coil
    • Electronic Distributor Coil
    • Double Spark Coil
    • Pencil Ignition Coil
    • Ignition Coil Rail
    • Others
  8. Global Market Analysis 2020 to 2024 and Forecast 2025 to 2035, By Vehicle Type
    • Passenger Cars
    • LCV
    • HCV
  9. Global Market Analysis 2020 to 2024 and Forecast 2025 to 2035, By Sales Channel
    • Original Equipment Manufacturers (OEM)
    • Aftermarket
  10. Global Market Analysis 2020 to 2024 and Forecast 2025 to 2035, By Region
    • North America
    • Latin America
    • Western Europe
    • South Asia
    • East Asia
    • Eastern Europe
    • Middle East & Africa
  11. North America Sales Analysis 2020 to 2024 and Forecast 2025 to 2035, by Key Segments and Countries
  12. Latin America Sales Analysis 2020 to 2024 and Forecast 2025 to 2035, by Key Segments and Countries
  13. Western Europe Sales Analysis 2020 to 2024 and Forecast 2025 to 2035, by Key Segments and Countries
  14. South Asia Sales Analysis 2020 to 2024 and Forecast 2025 to 2035, by Key Segments and Countries
  15. East Asia Sales Analysis 2020 to 2024 and Forecast 2025 to 2035, by Key Segments and Countries
  16. Eastern Europe Sales Analysis 2020 to 2024 and Forecast 2025 to 2035, by Key Segments and Countries
  17. Middle East & Africa Sales Analysis 2020 to 2024 and Forecast 2025 to 2035, by Key Segments and Countries
  18. Sales Forecast 2025 to 2035 by Product Type, Vehicle Type, and Sales Channel for 30 Countries
  19. Competition Outlook, including Market Structure Analysis, Company Share Analysis by Key Players, and Competition Dashboard
  20. Company Profile
    • Mitsubishi Electric Corporation
    • Yura Corporation
    • Diamond Electric Mfg. Co., Ltd.
    • Federal-Mogul (DRiV, Tenneco)
    • BERU AG (BorgWarner)
    • Hella GmbH & Co. KGaA
    • Valeo SA
    • Walker Products Inc.
    • Prestolite Electric Inc.
    • MSD Ignition (Holley Performance)

List of Tables

  • Table 1: Global Market Value (USD Million) Forecast by Region, 2020 to 2035
  • Table 2: Global Market Volume (Units) Forecast by Region, 2020 to 2035
  • Table 3: Global Market Value (USD Million) Forecast by Product Type, 2020 to 2035
  • Table 4: Global Market Volume (Units) Forecast by Product Type, 2020 to 2035
  • Table 5: Global Market Value (USD Million) Forecast by Vehicle Type, 2020 to 2035
  • Table 6: Global Market Volume (Units) Forecast by Vehicle Type, 2020 to 2035
  • Table 7: Global Market Value (USD Million) Forecast by Sales Channel, 2020 to 2035
  • Table 8: Global Market Volume (Units) Forecast by Sales Channel, 2020 to 2035
  • Table 9: North America Market Value (USD Million) Forecast by Country, 2020 to 2035
  • Table 10: North America Market Volume (Units) Forecast by Country, 2020 to 2035
  • Table 11: North America Market Value (USD Million) Forecast by Product Type, 2020 to 2035
  • Table 12: North America Market Volume (Units) Forecast by Product Type, 2020 to 2035
  • Table 13: North America Market Value (USD Million) Forecast by Vehicle Type, 2020 to 2035
  • Table 14: North America Market Volume (Units) Forecast by Vehicle Type, 2020 to 2035
  • Table 15: North America Market Value (USD Million) Forecast by Sales Channel, 2020 to 2035
  • Table 16: North America Market Volume (Units) Forecast by Sales Channel, 2020 to 2035
  • Table 17: Latin America Market Value (USD Million) Forecast by Country, 2020 to 2035
  • Table 18: Latin America Market Volume (Units) Forecast by Country, 2020 to 2035
  • Table 19: Latin America Market Value (USD Million) Forecast by Product Type, 2020 to 2035
  • Table 20: Latin America Market Volume (Units) Forecast by Product Type, 2020 to 2035
  • Table 21: Latin America Market Value (USD Million) Forecast by Vehicle Type, 2020 to 2035
  • Table 22: Latin America Market Volume (Units) Forecast by Vehicle Type, 2020 to 2035
  • Table 23: Latin America Market Value (USD Million) Forecast by Sales Channel, 2020 to 2035
  • Table 24: Latin America Market Volume (Units) Forecast by Sales Channel, 2020 to 2035
  • Table 25: Western Europe Market Value (USD Million) Forecast by Country, 2020 to 2035
  • Table 26: Western Europe Market Volume (Units) Forecast by Country, 2020 to 2035
  • Table 27: Western Europe Market Value (USD Million) Forecast by Product Type, 2020 to 2035
  • Table 28: Western Europe Market Volume (Units) Forecast by Product Type, 2020 to 2035
  • Table 29: Western Europe Market Value (USD Million) Forecast by Vehicle Type, 2020 to 2035
  • Table 30: Western Europe Market Volume (Units) Forecast by Vehicle Type, 2020 to 2035
  • Table 31: Western Europe Market Value (USD Million) Forecast by Sales Channel, 2020 to 2035
  • Table 32: Western Europe Market Volume (Units) Forecast by Sales Channel, 2020 to 2035
  • Table 33: Eastern Europe Market Value (USD Million) Forecast by Country, 2020 to 2035
  • Table 34: Eastern Europe Market Volume (Units) Forecast by Country, 2020 to 2035
  • Table 35: Eastern Europe Market Value (USD Million) Forecast by Product Type, 2020 to 2035
  • Table 36: Eastern Europe Market Volume (Units) Forecast by Product Type, 2020 to 2035
  • Table 37: Eastern Europe Market Value (USD Million) Forecast by Vehicle Type, 2020 to 2035
  • Table 38: Eastern Europe Market Volume (Units) Forecast by Vehicle Type, 2020 to 2035
  • Table 39: Eastern Europe Market Value (USD Million) Forecast by Sales Channel, 2020 to 2035
  • Table 40: Eastern Europe Market Volume (Units) Forecast by Sales Channel, 2020 to 2035
  • Table 41: South Asia and Pacific Market Value (USD Million) Forecast by Country, 2020 to 2035
  • Table 42: South Asia and Pacific Market Volume (Units) Forecast by Country, 2020 to 2035
  • Table 43: South Asia and Pacific Market Value (USD Million) Forecast by Product Type, 2020 to 2035
  • Table 44: South Asia and Pacific Market Volume (Units) Forecast by Product Type, 2020 to 2035
  • Table 45: South Asia and Pacific Market Value (USD Million) Forecast by Vehicle Type, 2020 to 2035
  • Table 46: South Asia and Pacific Market Volume (Units) Forecast by Vehicle Type, 2020 to 2035
  • Table 47: South Asia and Pacific Market Value (USD Million) Forecast by Sales Channel, 2020 to 2035
  • Table 48: South Asia and Pacific Market Volume (Units) Forecast by Sales Channel, 2020 to 2035
  • Table 49: East Asia Market Value (USD Million) Forecast by Country, 2020 to 2035
  • Table 50: East Asia Market Volume (Units) Forecast by Country, 2020 to 2035
  • Table 51: East Asia Market Value (USD Million) Forecast by Product Type, 2020 to 2035
  • Table 52: East Asia Market Volume (Units) Forecast by Product Type, 2020 to 2035
  • Table 53: East Asia Market Value (USD Million) Forecast by Vehicle Type, 2020 to 2035
  • Table 54: East Asia Market Volume (Units) Forecast by Vehicle Type, 2020 to 2035
  • Table 55: East Asia Market Value (USD Million) Forecast by Sales Channel, 2020 to 2035
  • Table 56: East Asia Market Volume (Units) Forecast by Sales Channel, 2020 to 2035
  • Table 57: Middle East and Africa Market Value (USD Million) Forecast by Country, 2020 to 2035
  • Table 58: Middle East and Africa Market Volume (Units) Forecast by Country, 2020 to 2035
  • Table 59: Middle East and Africa Market Value (USD Million) Forecast by Product Type, 2020 to 2035
  • Table 60: Middle East and Africa Market Volume (Units) Forecast by Product Type, 2020 to 2035
  • Table 61: Middle East and Africa Market Value (USD Million) Forecast by Vehicle Type, 2020 to 2035
  • Table 62: Middle East and Africa Market Volume (Units) Forecast by Vehicle Type, 2020 to 2035
  • Table 63: Middle East and Africa Market Value (USD Million) Forecast by Sales Channel, 2020 to 2035
  • Table 64: Middle East and Africa Market Volume (Units) Forecast by Sales Channel, 2020 to 2035

List of Figures

  • Figure 1: Global Market Value (USD Million) by Product Type, 2025 to 2035
  • Figure 2: Global Market Value (USD Million) by Vehicle Type, 2025 to 2035
  • Figure 3: Global Market Value (USD Million) by Sales Channel, 2025 to 2035
  • Figure 4: Global Market Value (USD Million) by Region, 2025 to 2035
  • Figure 5: Global Market Value (USD Million) Analysis by Region, 2020 to 2035
  • Figure 6: Global Market Volume (Units) Analysis by Region, 2020 to 2035
  • Figure 7: Global Market Value Share (%) and BPS Analysis by Region, 2025 to 2035
  • Figure 8: Global Market Y-o-Y Growth (%) Projections by Region, 2025 to 2035
  • Figure 9: Global Market Value (USD Million) Analysis by Product Type, 2020 to 2035
  • Figure 10: Global Market Volume (Units) Analysis by Product Type, 2020 to 2035
  • Figure 11: Global Market Value Share (%) and BPS Analysis by Product Type, 2025 to 2035
  • Figure 12: Global Market Y-o-Y Growth (%) Projections by Product Type, 2025 to 2035
  • Figure 13: Global Market Value (USD Million) Analysis by Vehicle Type, 2020 to 2035
  • Figure 14: Global Market Volume (Units) Analysis by Vehicle Type, 2020 to 2035
  • Figure 15: Global Market Value Share (%) and BPS Analysis by Vehicle Type, 2025 to 2035
  • Figure 16: Global Market Y-o-Y Growth (%) Projections by Vehicle Type, 2025 to 2035
  • Figure 17: Global Market Value (USD Million) Analysis by Sales Channel, 2020 to 2035
  • Figure 18: Global Market Volume (Units) Analysis by Sales Channel, 2020 to 2035
  • Figure 19: Global Market Value Share (%) and BPS Analysis by Sales Channel, 2025 to 2035
  • Figure 20: Global Market Y-o-Y Growth (%) Projections by Sales Channel, 2025 to 2035
  • Figure 21: Global Market Attractiveness by Product Type, 2025 to 2035
  • Figure 22: Global Market Attractiveness by Vehicle Type, 2025 to 2035
  • Figure 23: Global Market Attractiveness by Sales Channel, 2025 to 2035
  • Figure 24: Global Market Attractiveness by Region, 2025 to 2035
  • Figure 25: North America Market Value (USD Million) by Product Type, 2025 to 2035
  • Figure 26: North America Market Value (USD Million) by Vehicle Type, 2025 to 2035
  • Figure 27: North America Market Value (USD Million) by Sales Channel, 2025 to 2035
  • Figure 28: North America Market Value (USD Million) by Country, 2025 to 2035
  • Figure 29: North America Market Value (USD Million) Analysis by Country, 2020 to 2035
  • Figure 30: North America Market Volume (Units) Analysis by Country, 2020 to 2035
  • Figure 31: North America Market Value Share (%) and BPS Analysis by Country, 2025 to 2035
  • Figure 32: North America Market Y-o-Y Growth (%) Projections by Country, 2025 to 2035
  • Figure 33: North America Market Value (USD Million) Analysis by Product Type, 2020 to 2035
  • Figure 34: North America Market Volume (Units) Analysis by Product Type, 2020 to 2035
  • Figure 35: North America Market Value Share (%) and BPS Analysis by Product Type, 2025 to 2035
  • Figure 36: North America Market Y-o-Y Growth (%) Projections by Product Type, 2025 to 2035
  • Figure 37: North America Market Value (USD Million) Analysis by Vehicle Type, 2020 to 2035
  • Figure 38: North America Market Volume (Units) Analysis by Vehicle Type, 2020 to 2035
  • Figure 39: North America Market Value Share (%) and BPS Analysis by Vehicle Type, 2025 to 2035
  • Figure 40: North America Market Y-o-Y Growth (%) Projections by Vehicle Type, 2025 to 2035
  • Figure 41: North America Market Value (USD Million) Analysis by Sales Channel, 2020 to 2035
  • Figure 42: North America Market Volume (Units) Analysis by Sales Channel, 2020 to 2035
  • Figure 43: North America Market Value Share (%) and BPS Analysis by Sales Channel, 2025 to 2035
  • Figure 44: North America Market Y-o-Y Growth (%) Projections by Sales Channel, 2025 to 2035
  • Figure 45: North America Market Attractiveness by Product Type, 2025 to 2035
  • Figure 46: North America Market Attractiveness by Vehicle Type, 2025 to 2035
  • Figure 47: North America Market Attractiveness by Sales Channel, 2025 to 2035
  • Figure 48: North America Market Attractiveness by Country, 2025 to 2035
  • Figure 49: Latin America Market Value (USD Million) by Product Type, 2025 to 2035
  • Figure 50: Latin America Market Value (USD Million) by Vehicle Type, 2025 to 2035
  • Figure 51: Latin America Market Value (USD Million) by Sales Channel, 2025 to 2035
  • Figure 52: Latin America Market Value (USD Million) by Country, 2025 to 2035
  • Figure 53: Latin America Market Value (USD Million) Analysis by Country, 2020 to 2035
  • Figure 54: Latin America Market Volume (Units) Analysis by Country, 2020 to 2035
  • Figure 55: Latin America Market Value Share (%) and BPS Analysis by Country, 2025 to 2035
  • Figure 56: Latin America Market Y-o-Y Growth (%) Projections by Country, 2025 to 2035
  • Figure 57: Latin America Market Value (USD Million) Analysis by Product Type, 2020 to 2035
  • Figure 58: Latin America Market Volume (Units) Analysis by Product Type, 2020 to 2035
  • Figure 59: Latin America Market Value Share (%) and BPS Analysis by Product Type, 2025 to 2035
  • Figure 60: Latin America Market Y-o-Y Growth (%) Projections by Product Type, 2025 to 2035
  • Figure 61: Latin America Market Value (USD Million) Analysis by Vehicle Type, 2020 to 2035
  • Figure 62: Latin America Market Volume (Units) Analysis by Vehicle Type, 2020 to 2035
  • Figure 63: Latin America Market Value Share (%) and BPS Analysis by Vehicle Type, 2025 to 2035
  • Figure 64: Latin America Market Y-o-Y Growth (%) Projections by Vehicle Type, 2025 to 2035
  • Figure 65: Latin America Market Value (USD Million) Analysis by Sales Channel, 2020 to 2035
  • Figure 66: Latin America Market Volume (Units) Analysis by Sales Channel, 2020 to 2035
  • Figure 67: Latin America Market Value Share (%) and BPS Analysis by Sales Channel, 2025 to 2035
  • Figure 68: Latin America Market Y-o-Y Growth (%) Projections by Sales Channel, 2025 to 2035
  • Figure 69: Latin America Market Attractiveness by Product Type, 2025 to 2035
  • Figure 70: Latin America Market Attractiveness by Vehicle Type, 2025 to 2035
  • Figure 71: Latin America Market Attractiveness by Sales Channel, 2025 to 2035
  • Figure 72: Latin America Market Attractiveness by Country, 2025 to 2035
  • Figure 73: Western Europe Market Value (USD Million) by Product Type, 2025 to 2035
  • Figure 74: Western Europe Market Value (USD Million) by Vehicle Type, 2025 to 2035
  • Figure 75: Western Europe Market Value (USD Million) by Sales Channel, 2025 to 2035
  • Figure 76: Western Europe Market Value (USD Million) by Country, 2025 to 2035
  • Figure 77: Western Europe Market Value (USD Million) Analysis by Country, 2020 to 2035
  • Figure 78: Western Europe Market Volume (Units) Analysis by Country, 2020 to 2035
  • Figure 79: Western Europe Market Value Share (%) and BPS Analysis by Country, 2025 to 2035
  • Figure 80: Western Europe Market Y-o-Y Growth (%) Projections by Country, 2025 to 2035
  • Figure 81: Western Europe Market Value (USD Million) Analysis by Product Type, 2020 to 2035
  • Figure 82: Western Europe Market Volume (Units) Analysis by Product Type, 2020 to 2035
  • Figure 83: Western Europe Market Value Share (%) and BPS Analysis by Product Type, 2025 to 2035
  • Figure 84: Western Europe Market Y-o-Y Growth (%) Projections by Product Type, 2025 to 2035
  • Figure 85: Western Europe Market Value (USD Million) Analysis by Vehicle Type, 2020 to 2035
  • Figure 86: Western Europe Market Volume (Units) Analysis by Vehicle Type, 2020 to 2035
  • Figure 87: Western Europe Market Value Share (%) and BPS Analysis by Vehicle Type, 2025 to 2035
  • Figure 88: Western Europe Market Y-o-Y Growth (%) Projections by Vehicle Type, 2025 to 2035
  • Figure 89: Western Europe Market Value (USD Million) Analysis by Sales Channel, 2020 to 2035
  • Figure 90: Western Europe Market Volume (Units) Analysis by Sales Channel, 2020 to 2035
  • Figure 91: Western Europe Market Value Share (%) and BPS Analysis by Sales Channel, 2025 to 2035
  • Figure 92: Western Europe Market Y-o-Y Growth (%) Projections by Sales Channel, 2025 to 2035
  • Figure 93: Western Europe Market Attractiveness by Product Type, 2025 to 2035
  • Figure 94: Western Europe Market Attractiveness by Vehicle Type, 2025 to 2035
  • Figure 95: Western Europe Market Attractiveness by Sales Channel, 2025 to 2035
  • Figure 96: Western Europe Market Attractiveness by Country, 2025 to 2035
  • Figure 97: Eastern Europe Market Value (USD Million) by Product Type, 2025 to 2035
  • Figure 98: Eastern Europe Market Value (USD Million) by Vehicle Type, 2025 to 2035
  • Figure 99: Eastern Europe Market Value (USD Million) by Sales Channel, 2025 to 2035
  • Figure 100: Eastern Europe Market Value (USD Million) by Country, 2025 to 2035
  • Figure 101: Eastern Europe Market Value (USD Million) Analysis by Country, 2020 to 2035
  • Figure 102: Eastern Europe Market Volume (Units) Analysis by Country, 2020 to 2035
  • Figure 103: Eastern Europe Market Value Share (%) and BPS Analysis by Country, 2025 to 2035
  • Figure 104: Eastern Europe Market Y-o-Y Growth (%) Projections by Country, 2025 to 2035
  • Figure 105: Eastern Europe Market Value (USD Million) Analysis by Product Type, 2020 to 2035
  • Figure 106: Eastern Europe Market Volume (Units) Analysis by Product Type, 2020 to 2035
  • Figure 107: Eastern Europe Market Value Share (%) and BPS Analysis by Product Type, 2025 to 2035
  • Figure 108: Eastern Europe Market Y-o-Y Growth (%) Projections by Product Type, 2025 to 2035
  • Figure 109: Eastern Europe Market Value (USD Million) Analysis by Vehicle Type, 2020 to 2035
  • Figure 110: Eastern Europe Market Volume (Units) Analysis by Vehicle Type, 2020 to 2035
  • Figure 111: Eastern Europe Market Value Share (%) and BPS Analysis by Vehicle Type, 2025 to 2035
  • Figure 112: Eastern Europe Market Y-o-Y Growth (%) Projections by Vehicle Type, 2025 to 2035
  • Figure 113: Eastern Europe Market Value (USD Million) Analysis by Sales Channel, 2020 to 2035
  • Figure 114: Eastern Europe Market Volume (Units) Analysis by Sales Channel, 2020 to 2035
  • Figure 115: Eastern Europe Market Value Share (%) and BPS Analysis by Sales Channel, 2025 to 2035
  • Figure 116: Eastern Europe Market Y-o-Y Growth (%) Projections by Sales Channel, 2025 to 2035
  • Figure 117: Eastern Europe Market Attractiveness by Product Type, 2025 to 2035
  • Figure 118: Eastern Europe Market Attractiveness by Vehicle Type, 2025 to 2035
  • Figure 119: Eastern Europe Market Attractiveness by Sales Channel, 2025 to 2035
  • Figure 120: Eastern Europe Market Attractiveness by Country, 2025 to 2035
  • Figure 121: South Asia and Pacific Market Value (USD Million) by Product Type, 2025 to 2035
  • Figure 122: South Asia and Pacific Market Value (USD Million) by Vehicle Type, 2025 to 2035
  • Figure 123: South Asia and Pacific Market Value (USD Million) by Sales Channel, 2025 to 2035
  • Figure 124: South Asia and Pacific Market Value (USD Million) by Country, 2025 to 2035
  • Figure 125: South Asia and Pacific Market Value (USD Million) Analysis by Country, 2020 to 2035
  • Figure 126: South Asia and Pacific Market Volume (Units) Analysis by Country, 2020 to 2035
  • Figure 127: South Asia and Pacific Market Value Share (%) and BPS Analysis by Country, 2025 to 2035
  • Figure 128: South Asia and Pacific Market Y-o-Y Growth (%) Projections by Country, 2025 to 2035
  • Figure 129: South Asia and Pacific Market Value (USD Million) Analysis by Product Type, 2020 to 2035
  • Figure 130: South Asia and Pacific Market Volume (Units) Analysis by Product Type, 2020 to 2035
  • Figure 131: South Asia and Pacific Market Value Share (%) and BPS Analysis by Product Type, 2025 to 2035
  • Figure 132: South Asia and Pacific Market Y-o-Y Growth (%) Projections by Product Type, 2025 to 2035
  • Figure 133: South Asia and Pacific Market Value (USD Million) Analysis by Vehicle Type, 2020 to 2035
  • Figure 134: South Asia and Pacific Market Volume (Units) Analysis by Vehicle Type, 2020 to 2035
  • Figure 135: South Asia and Pacific Market Value Share (%) and BPS Analysis by Vehicle Type, 2025 to 2035
  • Figure 136: South Asia and Pacific Market Y-o-Y Growth (%) Projections by Vehicle Type, 2025 to 2035
  • Figure 137: South Asia and Pacific Market Value (USD Million) Analysis by Sales Channel, 2020 to 2035
  • Figure 138: South Asia and Pacific Market Volume (Units) Analysis by Sales Channel, 2020 to 2035
  • Figure 139: South Asia and Pacific Market Value Share (%) and BPS Analysis by Sales Channel, 2025 to 2035
  • Figure 140: South Asia and Pacific Market Y-o-Y Growth (%) Projections by Sales Channel, 2025 to 2035
  • Figure 141: South Asia and Pacific Market Attractiveness by Product Type, 2025 to 2035
  • Figure 142: South Asia and Pacific Market Attractiveness by Vehicle Type, 2025 to 2035
  • Figure 143: South Asia and Pacific Market Attractiveness by Sales Channel, 2025 to 2035
  • Figure 144: South Asia and Pacific Market Attractiveness by Country, 2025 to 2035
  • Figure 145: East Asia Market Value (USD Million) by Product Type, 2025 to 2035
  • Figure 146: East Asia Market Value (USD Million) by Vehicle Type, 2025 to 2035
  • Figure 147: East Asia Market Value (USD Million) by Sales Channel, 2025 to 2035
  • Figure 148: East Asia Market Value (USD Million) by Country, 2025 to 2035
  • Figure 149: East Asia Market Value (USD Million) Analysis by Country, 2020 to 2035
  • Figure 150: East Asia Market Volume (Units) Analysis by Country, 2020 to 2035
  • Figure 151: East Asia Market Value Share (%) and BPS Analysis by Country, 2025 to 2035
  • Figure 152: East Asia Market Y-o-Y Growth (%) Projections by Country, 2025 to 2035
  • Figure 153: East Asia Market Value (USD Million) Analysis by Product Type, 2020 to 2035
  • Figure 154: East Asia Market Volume (Units) Analysis by Product Type, 2020 to 2035
  • Figure 155: East Asia Market Value Share (%) and BPS Analysis by Product Type, 2025 to 2035
  • Figure 156: East Asia Market Y-o-Y Growth (%) Projections by Product Type, 2025 to 2035
  • Figure 157: East Asia Market Value (USD Million) Analysis by Vehicle Type, 2020 to 2035
  • Figure 158: East Asia Market Volume (Units) Analysis by Vehicle Type, 2020 to 2035
  • Figure 159: East Asia Market Value Share (%) and BPS Analysis by Vehicle Type, 2025 to 2035
  • Figure 160: East Asia Market Y-o-Y Growth (%) Projections by Vehicle Type, 2025 to 2035
  • Figure 161: East Asia Market Value (USD Million) Analysis by Sales Channel, 2020 to 2035
  • Figure 162: East Asia Market Volume (Units) Analysis by Sales Channel, 2020 to 2035
  • Figure 163: East Asia Market Value Share (%) and BPS Analysis by Sales Channel, 2025 to 2035
  • Figure 164: East Asia Market Y-o-Y Growth (%) Projections by Sales Channel, 2025 to 2035
  • Figure 165: East Asia Market Attractiveness by Product Type, 2025 to 2035
  • Figure 166: East Asia Market Attractiveness by Vehicle Type, 2025 to 2035
  • Figure 167: East Asia Market Attractiveness by Sales Channel, 2025 to 2035
  • Figure 168: East Asia Market Attractiveness by Country, 2025 to 2035
  • Figure 169: Middle East and Africa Market Value (USD Million) by Product Type, 2025 to 2035
  • Figure 170: Middle East and Africa Market Value (USD Million) by Vehicle Type, 2025 to 2035
  • Figure 171: Middle East and Africa Market Value (USD Million) by Sales Channel, 2025 to 2035
  • Figure 172: Middle East and Africa Market Value (USD Million) by Country, 2025 to 2035
  • Figure 173: Middle East and Africa Market Value (USD Million) Analysis by Country, 2020 to 2035
  • Figure 174: Middle East and Africa Market Volume (Units) Analysis by Country, 2020 to 2035
  • Figure 175: Middle East and Africa Market Value Share (%) and BPS Analysis by Country, 2025 to 2035
  • Figure 176: Middle East and Africa Market Y-o-Y Growth (%) Projections by Country, 2025 to 2035
  • Figure 177: Middle East and Africa Market Value (USD Million) Analysis by Product Type, 2020 to 2035
  • Figure 178: Middle East and Africa Market Volume (Units) Analysis by Product Type, 2020 to 2035
  • Figure 179: Middle East and Africa Market Value Share (%) and BPS Analysis by Product Type, 2025 to 2035
  • Figure 180: Middle East and Africa Market Y-o-Y Growth (%) Projections by Product Type, 2025 to 2035
  • Figure 181: Middle East and Africa Market Value (USD Million) Analysis by Vehicle Type, 2020 to 2035
  • Figure 182: Middle East and Africa Market Volume (Units) Analysis by Vehicle Type, 2020 to 2035
  • Figure 183: Middle East and Africa Market Value Share (%) and BPS Analysis by Vehicle Type, 2025 to 2035
  • Figure 184: Middle East and Africa Market Y-o-Y Growth (%) Projections by Vehicle Type, 2025 to 2035
  • Figure 185: Middle East and Africa Market Value (USD Million) Analysis by Sales Channel, 2020 to 2035
  • Figure 186: Middle East and Africa Market Volume (Units) Analysis by Sales Channel, 2020 to 2035
  • Figure 187: Middle East and Africa Market Value Share (%) and BPS Analysis by Sales Channel, 2025 to 2035
  • Figure 188: Middle East and Africa Market Y-o-Y Growth (%) Projections by Sales Channel, 2025 to 2035
  • Figure 189: Middle East and Africa Market Attractiveness by Product Type, 2025 to 2035
  • Figure 190: Middle East and Africa Market Attractiveness by Vehicle Type, 2025 to 2035
  • Figure 191: Middle East and Africa Market Attractiveness by Sales Channel, 2025 to 2035
  • Figure 192: Middle East and Africa Market Attractiveness by Country, 2025 to 2035

Frequently Asked Questions

What is the estimated market size of the global Automotive Ignition Coil market for 2025?

The global Automotive Ignition Coil market is projected to reach USD 8.4 billion by the end of 2025.

At what rate is the market expected to grow during the forecast period?

The market is anticipated to grow at a CAGR of 5.6% over the forecast period.

What is the projected market worth by 2035?

By 2035, the Automotive Ignition Coil market is expected to reach USD 14.5 billion.

Which segment is expected to dominate the market?

The Can-Type Ignition Coil segment is expected to dominate the market, owing to its robust design, high energy output, cost-effectiveness, and widespread adoption in both passenger and commercial vehicles.

Who are the key players in the Automotive Ignition Coil market?

Key players in the Automotive Ignition Coil market include Mitsubishi Electric Corporation, Yura Corporation, Diamond Electric Mfg. Co., Ltd., Federal-Mogul (DRiV, Tenneco).

Explore Automotive Fuel Systems Insights

Future Market Insights

Automotive Ignition Coil Market