

- Market Size (2026)
- USD 1.5 Bn
- Forecast (2036)
- USD 7.2 Bn
- CAGR (2026 to 2036)
- 16.6%
How big is AI-Powered Whole-Body Imaging Market in 2026?
USD 1.5 billion in 2026 and USD 7.2 billion by 2036 at a 16.6% CAGR.
Demand for AI-powered whole-body imaging is projected to rise at 16.6% CAGR from 2026 to 2036, taking valuation from USD 1.5 billion to USD 7.2 billion. Radiology departments purchase these systems to shorten scan preparation and reconstruction while preserving diagnostic quality across multiple anatomical regions. NHS England reported in November 2025 that providers completed 49.9 million imaging tests during 2024/25, representing annual growth of 5.9%. Rising workload strengthens the economic case for diagnostic imaging services that standardize acquisition and reporting without expanding specialist staffing at the same pace. Software that reduces repeat scans and reporting delays creates commercial value; dependable service agreements must also protect scanner availability across demanding schedules.
National adoption routes differ according to equipment density and the purchasing role assigned to preventive imaging within each health system. United States providers can combine private-pay screening with large hospital networks, whereas United Kingdom deployment faces stronger evidence and public-capacity scrutiny. Japan's exceptionally dense scanner base supports technical availability, although staffing and interpretation capacity can remain restrictive across routine clinical services. Germany and South Korea offer substantial imaging infrastructure through different financing and service models that shape deployment economics. Providers therefore compare medical imaging software compatibility with local reimbursement and maintenance coverage rather than treating scanner access as sufficient proof of adoption. A credible purchase case connects multi-region imaging performance with a defined care pathway and a budget owner responsible for incidental findings.
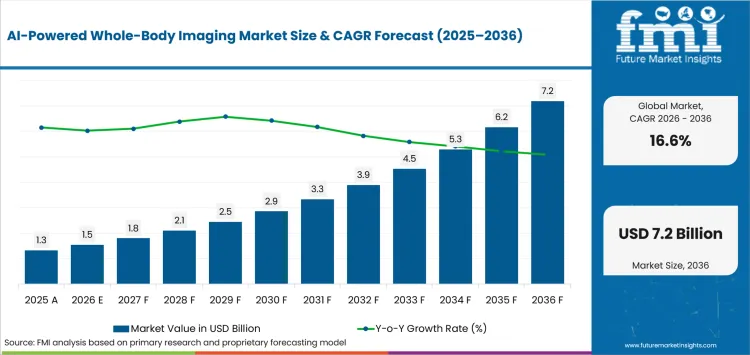
Key Takeaways of AI-Powered Whole-Body Imaging Market
- Demand for AI-powered whole-body imaging is driven by organizations seeking shorter examination preparation and reconstruction without weakening clinical confidence across complex multi-region protocols.
- By imaging modality, MRI holds the leading share at 33.2% in 2026, supported by radiation-free soft-tissue coverage across several body regions.
- Preventive health screening is the dominant application segment, holding 41.5% share in 2026, driven by private-pay access and structured multi-organ review within one scheduled visit.
- Hospitals lead end-user spending at 31.5% share in 2026, owing to installed equipment and specialist interpretation capacity for managing unexpected findings.
- Deep learning algorithms capture 35.7% technology share in 2026, supported by reconstruction speed and image-consistency improvements across accelerated acquisitions.
- The USA, South Korea, and Japan record CAGRs of 19.7%, 18.8%, and 16.2% respectively through 2036, while Germany and the UK require market entry plans aligned with different public purchasing structures.
- Competition centers on Siemens Healthineers, GE HealthCare, Royal Philips, Canon Medical Systems, United Imaging Healthcare, Fujifilm Healthcare, Prenuvo, and Function Health, with vendors differentiating through MRI portfolio breadth, AI reconstruction upgrade paths, and managed consumer screening pathways.
Analyst Perspective
Faster acquisition only pays off commercially if referral pathways can absorb the incidental findings it surfaces; a scanner reconstructing images quicker doesn't reduce downstream specialist workload, it can increase it unless preventive-screening operators build accountable follow-up routes alongside the speed gains.
-Anurag Sharma, Principal Analyst at Future Market Insights
Source: FMI's proprietary forecasting model and primary research
How is the AI-Powered Whole-Body Imaging Market segmented?
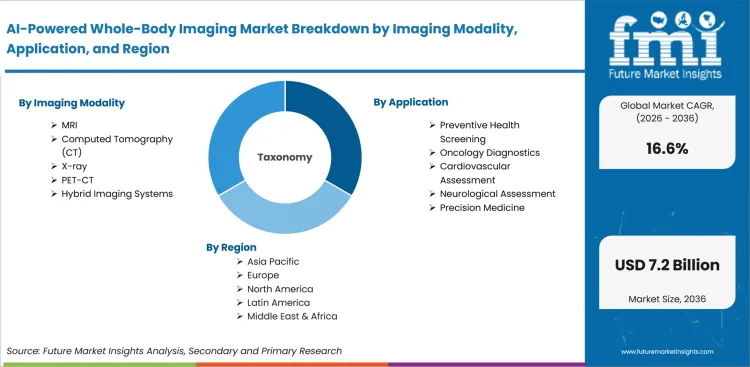
The AI-powered whole-body imaging market is segmented by Imaging Modality, Application, End User, Technology, and Region.
The segmentation framework separates imaging equipment from clinical use and operating ownership across the defined revenue boundary. Imaging modality distinguishes MRI from CT and other systems that support commercially observable multi-region acquisition workflows. Application separates preventive screening from disease-focused assessment pathways that create different referral and interpretation requirements. End user separates hospitals from imaging centers and specialist clinics that control equipment or service spending. Technology distinguishes deep learning algorithms from computer vision and deployment architectures that support image reconstruction and interpretation. Regional analysis compares adoption conditions across health systems with different equipment density and purchasing models.
What supports demand for MRI within the Imaging modality category?
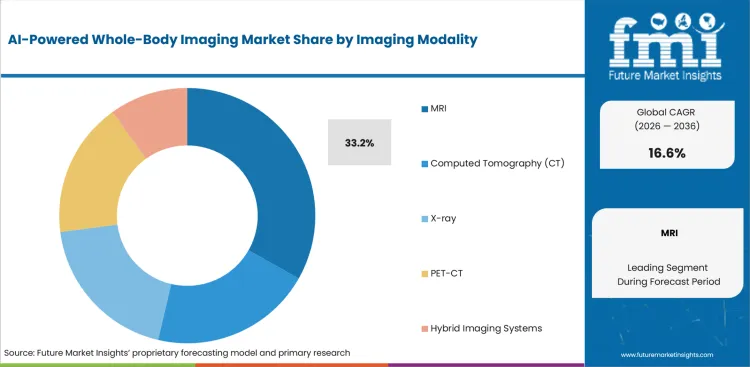
Whole-body MRI must capture several anatomical regions during a session that patients and radiology teams can complete reliably. The modality avoids ionizing radiation and supports repeated soft-tissue evaluation, but long protocols can restrict daily appointment capacity. NHS England reported in November 2025 that MRI activity reached 4.9 million tests during 2024/25, increasing 10.1% from the previous year. Demand therefore favors magnetic resonance imaging platforms that combine accelerated acquisition with consistent reconstruction across changing body regions.
- MRI is projected to account for 33.2% of imaging modality in 2026, supported by radiation-free soft-tissue coverage across several body regions. Its position also reflects installed scanner availability and established radiologist familiarity with complex multi-sequence examinations across routine clinical services.
- Hospital radiology departments select MRI protocols that reduce table time without compromising lesion visibility across diverse anatomical areas. Adoption depends on reliable coils and sequence automation together with service support that prevents longer examinations from disrupting daily schedules across busy departments.
How do preventive screening providers evaluate preventive health screening?
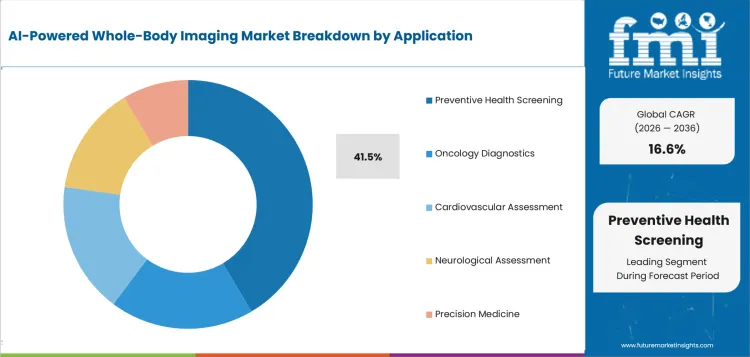
Preventive health screening converts broad imaging coverage into a private-pay service that must manage incidental findings and clinical follow-up responsibly. Prenuvo announced in April 2025 that its first Las Vegas clinic offered radiation-free whole-body MRI examinations lasting less than one hour. The operating model connects preventive medicine with standardized protocols and specialist interpretation outside symptom-led referral pathways. Commercial viability depends on transparent limitations and dependable referral routes rather than broad detection claims alone.
- Preventive health screening is estimated to hold 41.5% of application in 2026, attributable to structured multi-organ assessment within one scheduled visit. Private-pay channels also let operators package imaging and reporting with predictable scheduling without relying entirely on conventional referral reimbursement.
- Self-pay screening clinics use whole-body protocols to provide broad anatomical coverage for clients seeking an imaging baseline. Adoption strengthens through clear consent and referral pathways that address incidental findings with documented risk communication and accountable clinical review during subsequent follow-up.
What makes Hospitals central to the end user category?
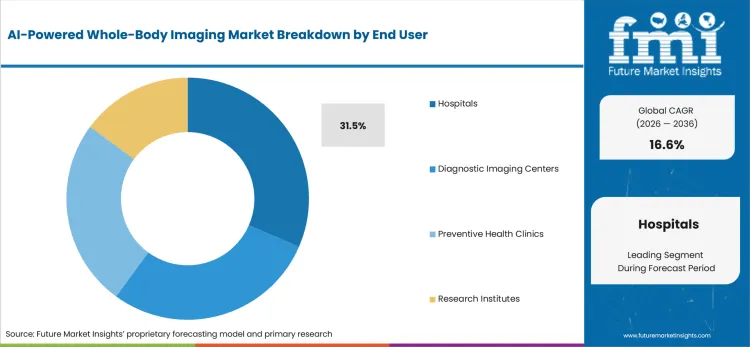
Hospitals combine scanners and radiologists with referral pathways that can manage unexpected findings from multi-region examinations. Royal Philips reported in February 2025 that SmartSpeed supported diagnostic-quality whole-body examinations lasting less than sixty minutes at a preventive imaging provider. Hospital investment also depends on radiology information systems that route images and findings across clinical departments. Integrated governance gives hospitals an advantage for complex cases that require rapid specialist review and additional testing.
- Hospitals are forecast to represent 31.5% of end user spending in 2026, due to installed imaging capacity and direct access to multidisciplinary specialists. Their capital budgets can support scanner upgrades together with software and enterprise integration across multiple service lines.
- Integrated delivery networks evaluate whole-body imaging against throughput and referral capacity across oncology and cardiovascular services. Adoption requires clear ownership of follow-up testing because faster acquisition can increase downstream work across connected hospital specialist departments if reporting standards remain inconsistent.
How do radiology teams assess deep learning algorithms within technology?
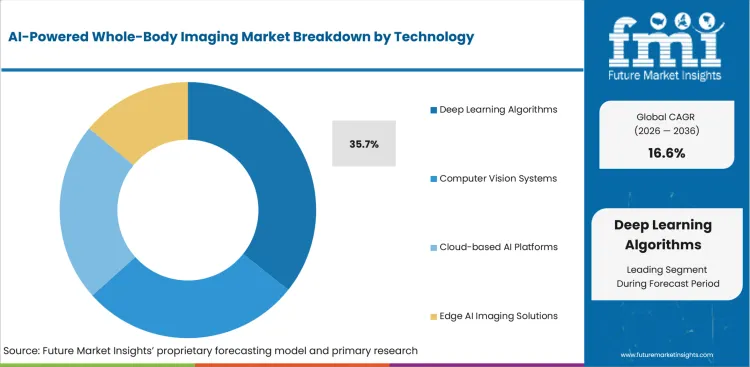
Deep learning algorithms improve whole-body imaging through reconstruction and protocol automation that reduce noise across accelerated acquisitions. Radiology teams must validate performance across body regions because an algorithm trained for one anatomy may not transfer safely to another. The FDA listed Canon Medical Systems AiCE reconstruction for Vantage Fortian and Orian MRI systems with a final decision dated March 2026. Broader AI-enabled medical devices adoption therefore depends on anatomy-specific evidence and controlled software change management.
- Deep learning algorithms are expected to capture 35.7% of technology in 2026, driven by their role in image reconstruction and protocol consistency. Software upgrades can improve existing scanner productivity across connected service networks without requiring every provider to replace the complete imaging platform.
- Radiology departments adopt deep learning reconstruction where validation confirms stable image quality across accelerated sequences and patient types. Purchasing teams also require cybersecurity and version controls that preserve performance evidence during software and infrastructure changes across connected clinical networks at multiple sites.
What are the drivers, restraints, and opportunities in the AI-Powered Whole-Body Imaging Market?
Diagnostic workload supports demand for faster multi-region imaging; uncertain screening benefit constrains routine adoption; governed remote workflows create a credible service opportunity.
- Driver: Diagnostic backlogs increase the value of faster acquisition and reconstruction across imaging departments with limited specialist capacity.
- Restraint: Incidental findings and uncertain population benefit restrict routine screening without clear consent and follow-up governance.
- Opportunity: Remote protocol support can extend specialist expertise across imaging sites while preserving documented safety responsibilities.
Radiology backlogs create direct purchasing pressure for systems that increase appointment capacity without reducing diagnostic confidence. NHS England reported in November 2025 that the median MRI request-to-test interval reached twenty-one days during 2024/25. The workload supports investment in autonomous imaging functions that standardize preparation and reconstruction for technologists working across varied protocols. Hospital finance teams still need measured throughput gains because faster software creates limited value if reporting or follow-up remains congested.
Uncertain clinical benefit limits preventive deployment among asymptomatic people even where whole-body MRI avoids ionizing radiation. The Royal College of Radiologists stated in June 2025 that elective MRI screening can produce overdiagnosis and unnecessary treatment while adding pressure to NHS services. Screening operators must therefore explain examination limitations and maintain clinically governed referral pathways for incidental findings. Wider adoption requires evidence that defined populations gain useful outcomes without transferring unmanaged work into public diagnostic systems.
Remote scanning creates a practical opening for imaging networks that have scanners available but uneven technologist expertise across locations. The American College of Radiology updated its position in March 2025 and supported remote CT and MRI scanning with explicit supervision safeguards. Networks can combine remote acquisition support with structured reporting automation to improve consistency across distributed sites. Service providers must define local emergency coverage and credentialing responsibilities before centralized support can expand safely.
Which country CAGRs are profiled in the AI-Powered Whole-Body Imaging Market?
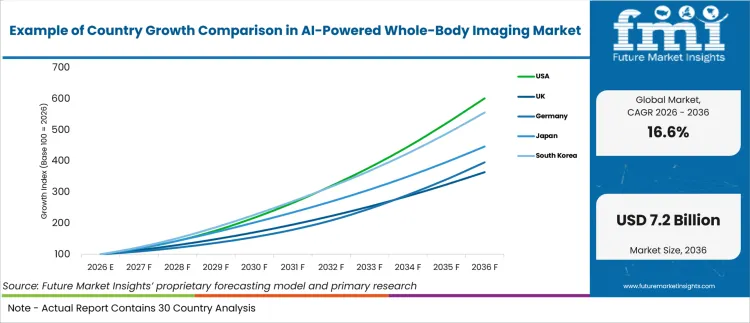
| Country | CAGR |
|---|---|
| USA | 19.7% |
| UK | 13.8% |
| Germany | 14.8% |
| Japan | 16.2% |
| South Korea | 18.8% |
How do country-level CAGRs compare in the AI-Powered Whole-Body Imaging Market?
The country comparison spans 5.9 percentage points and separates two upper positions from a more moderate European pair. USA and South Korea are divided by 0.9 percentage points despite different reimbursement and provider structures. Japan sits 2.6 percentage points below the USA while retaining a broad imaging equipment base. Germany and the UK form a closer European pair with a measured 1.0-percentage-point separation between their forecasts. Similar forecast rates can therefore reflect different combinations of scanner availability and service readiness rather than comparable market size.
- The USA position reflects private-pay screening channels and integrated hospital networks that can fund software upgrades through several budget routes.
- South Korea remains close to the USA through dense tertiary infrastructure and rapid evaluation of digitally integrated clinical technologies.
- Japan occupies the middle of the comparison because extensive equipment availability coexists with workforce and interpretation constraints.
- Germany records a moderate position through strong hospital infrastructure and formal purchasing processes that can extend implementation schedules.
- The UK sits outside the central cluster as public capacity pressures increase scrutiny of evidence and downstream service consequences.
Comparable CAGRs create different entry conditions because regulatory evidence and maintenance coverage influence usable capacity more directly than equipment counts alone. Commercial plans must therefore align financing and training with each country’s referral pathway rather than applying one deployment model across all five locations. The full report provides country-level CAGR analysis across North America, Latin America, Europe, East Asia, South Asia, Oceania and the Middle East and Africa.
Country-wise Analysis
- United States imaging networks combine large hospital systems with private diagnostic centers and direct-pay preventive services. Demand for the AI-powered whole-body imaging market in the USA is forecast to rise at 19.7% CAGR over the forecast period, supported by several purchasing routes. OECD data published in November 2025 placed combined CT and MRI equipment at eighty-six units per million residents while hospital beds stood at 2.8 per thousand. The installed base enables computed tomography systems and MRI software upgrades across diverse provider settings. Reimbursement uncertainty and state-level privacy requirements remain material frictions for preventive services that generate incidental findings. Commercial contracts should define referral ownership and maintenance response standards before deployment expands across additional imaging locations.
- United Kingdom imaging purchasing is concentrated in public pathways that face long queues and formal data-standard requirements. NHS England published Diagnostic Imaging Data Set version 2.0 in October 2025 for implementation across England’s radiology departments and independent NHS providers. The UK AI-powered whole-body imaging market is estimated to expand at 13.8% CAGR by 2036, shaped by capacity pressure and evidence scrutiny. Standardized imaging records can support workflow integration and stronger auditability across public and independent diagnostic service settings. Public procurement remains a material friction because preventive examinations can add downstream referrals without a funded clinical pathway. Market entry requires clear information-system integration and a service model that does not displace urgent diagnostic capacity.
- German hospitals operate within a dense provider network that supports complex imaging through formal regional purchasing and reimbursement processes. Existing scanner fleets create an upgrade route, although technical approval and funding decisions remain institution-specific across federal states. Germany’s AI-powered whole-body imaging market is projected to record 14.8% CAGR during the assessment period, underpinned by established imaging infrastructure. OECD figures released in November 2025 recorded seventy-four combined CT and MRI units per million residents and 7.7 hospital beds per thousand. Equipment density enables software upgrades, yet fragmented decision authority can separate technical validation from funding approval across hospital groups. Manufacturers need regional service coverage and documented interoperability evidence to shorten procurement review across German hospital networks.
- Japanese providers have exceptional scanner availability across hospitals and diagnostic facilities with strict expectations for protocol consistency. OECD data published in November 2025 reported 184 combined CT and MRI units per million residents together with 12.5 hospital beds per thousand. Adoption of AI-powered whole-body imaging in Japan is anticipated to advance at 16.2% CAGR through 2036, reflecting technical readiness. The equipment base enables broad access to multi-region imaging and creates upgrade opportunities across existing systems. Radiologist and technologist capacity remains a practical friction because higher scanner density does not guarantee timely interpretation. Japanese providers should prioritize automation that reduces setup variation and supports local-language workflow integration across established imaging systems.
- South Korean tertiary hospitals combine advanced imaging departments with digital infrastructure that supports rapid software evaluation. South Korea’s AI-powered whole-body imaging market is predicted to post 18.8% CAGR over the assessment period, reinforced by concentrated clinical technology capacity. OECD country data issued in November 2025 placed combined CT and MRI equipment at eighty-seven units per million residents and hospital beds at 12.6 per thousand. Dense tertiary capacity creates an enabler for AI reconstruction and enterprise deployment across major urban systems. A material friction remains the concentration of specialist resources because smaller providers may lack training and local application support. Commercial expansion therefore requires distributor-led technical service and validated Korean-language interfaces across smaller provider organizations.
Who are the notable companies in the AI-Powered Whole-Body Imaging Market?
Siemens Healthineers, GE HealthCare, Royal Philips, Canon Medical Systems, Fujifilm Healthcare, United Imaging Healthcare, Prenuvo, and Function Health are notable companies in this market.
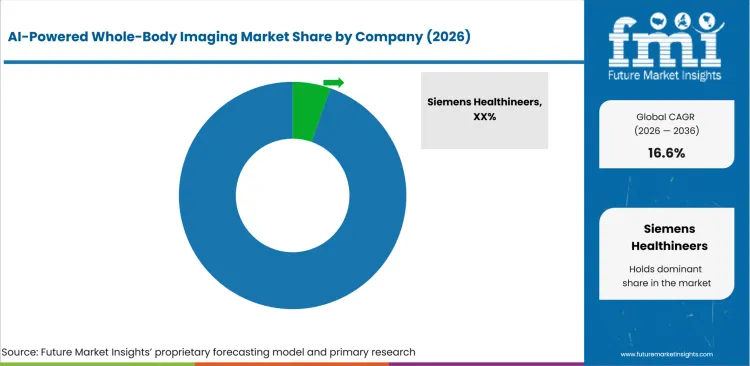
Competition combines global modality manufacturers with preventive-screening operators that control different stages of acquisition and patient follow-up. United Imaging Healthcare reported in April 2025 that its commercial network covered more than eighty-five countries with seven regional spare-parts hubs and thirty-two national warehouses. Comparable algorithm validation platforms matter because reconstruction claims need evidence across scanners and anatomical regions. Manufacturers compete through installed-base upgrades and service depth while screening operators compete through protocol design and access. Provider selection depends on current regulatory status and accountable workflow ownership rather than corporate scale or parent-market reputation.
- Siemens Healthineers and GE HealthCare provide broad MRI portfolios with AI reconstruction and workflow tools across international service organizations. Royal Philips adds portfolio-wide acceleration software that supports installed systems and multi-anatomy protocols across several clinical applications.
- Canon Medical Systems and Fujifilm Healthcare provide MRI platforms with deep learning reconstruction and workflow automation. United Imaging Healthcare adds dedicated whole-body systems and a global imaging portfolio supported by regional service infrastructure.
- Prenuvo operates managed whole-body MRI screening clinics that combine standardized protocols with specialist reporting and defined patient access pathways. Function Health owns Ezra and combines fast MRI access with AI-supported image quality and reporting across partner locations.
Competitive Benchmarking: AI-Powered Whole-Body Imaging Market
| Company | Whole-Body Imaging | AI Reconstruction and Analysis | Workflow Integration | Geographic Reach |
|---|---|---|---|---|
| Siemens Healthineers | High | High | High | Global |
| GE HealthCare | High | High | High | Global |
| Royal Philips | High | High | High | Global |
| Canon Medical Systems | Medium | High | Medium | Global |
| Fujifilm Healthcare | Medium | Medium | Medium | North America, Europe, and Asia |
| United Imaging Healthcare | High | High | High | Global |
| Prenuvo | High | Medium | High | North America, Europe, and Australia |
| Function Health (Ezra) | High | Medium | Medium | United States |
Key Developments in the AI-Powered Whole-Body Imaging Market
- In June 2025, Siemens Healthineers received FDA clearance for the MAGNETOM Flow.Ace 1.5T MRI platform. The system uses AI reconstruction and automated workflow across the complete MR application range while requiring 0.7 liters of helium. The clearance expands a commercially available pathway for facilities seeking lower installation requirements and broad anatomical coverage.
- In February 2026, GE HealthCare announced FDA clearances for SIGNA Sprint and SIGNA Bolt together with the SIGNA One workflow ecosystem. The integrated platform supports examinations from protocol planning through image acquisition and downstream review across connected radiology workflows. The development gives imaging departments an upgrade route that combines new magnet designs with AI-driven workflow controls.
- In June 2025, United Imaging Healthcare introduced the CE-marked uMR Ultra as a 3T system for real-time whole-body diagnostics. Its uAIFI.LIVE platform combines AI algorithms with motion-optimized acquisition across structural and functional imaging. The launch broadens competition among hospitals evaluating advanced whole-body MRI systems with dynamic visualization and clinically responsive motion-sensitive acquisition capabilities.
- In November 2025, Prenuvo opened its first European clinic in London and extended its preventive whole-body MRI service beyond North America and Australia. Prenuvo reported more than 150,000 completed scans across twenty-seven clinics at the announcement date. The opening establishes a local screening and specialist reporting route for clients across the United Kingdom and continental Europe.
Key Players in the AI-Powered Whole-Body Imaging Market
Global Imaging System Providers
- Siemens Healthineers
- GE HealthCare
- Royal Philips
- Canon Medical Systems
Multi-Anatomy Imaging Providers
- Fujifilm Healthcare
- United Imaging Healthcare
Preventive Imaging Service Providers
- Prenuvo
- Function Health (Ezra)
AI-Powered Whole-Body Imaging Market - Report Scope
| Report scope | Coverage field |
|---|---|
| Market breakdown | Imaging modality, application, end user, technology, and region. |
| Quantitative Units | Revenue in USD Million, CAGR in %. |
| Market Definition | AI-enabled imaging systems, reconstruction software, analysis tools, and managed services used directly for multi-region or whole-body diagnostic imaging. |
| Regions Covered | North America, Latin America, Western Europe, Eastern Europe, East Asia, South Asia and Pacific, and Middle East and Africa. |
| Countries Covered | USA, UK, Germany, Japan, and South Korea. |
| Key Companies Profiled | Siemens Healthineers, GE HealthCare, Royal Philips, Canon Medical Systems, Fujifilm Healthcare, United Imaging Healthcare, Prenuvo, and Function Health. |
| Forecast Period | 2026 to 2036. |
| Approach | Hybrid bottom-up and top-down market sizing supported by primary interviews and official desk research. |
AI-Powered Whole-Body Imaging Market - Research Methodology
| Method | Approach |
|---|---|
| Primary Research | FMI analysts gathered input from manufacturers, service providers, technology developers, distributors, end users, procurement teams, and subject-matter experts. Interviews examined purchasing decisions, product or service evaluation, adoption barriers, approval requirements, pricing considerations, and expectations for technical or commercial support. Respondents were also asked what evidence is required before a trial, pilot, or initial order develops into regular purchasing. |
| Desk Research | Desk research covered government statistics, regulatory publications, trade data, industry associations, technical literature, standards, company filings, product information, and official corporate announcements. Sources were reviewed for relevance, publication date, geographic coverage, and consistency with the defined market scope. Claims relating to performance, applications, approvals, capacity, investment, and commercial activity were retained only when supported by credible public evidence. |
| Market Sizing and Forecasting | The market model combined the baseline value with historical performance, segment structure, pricing and volume indicators, adoption levels, company participation, and country-level demand conditions. Forecast assumptions considered economic activity, investment trends, regulatory developments, technology adoption, purchasing cycles, supply availability, and barriers to wider market use. Segment and regional estimates were reconciled before the final market total was calculated. |
| Data Validation | Estimates were checked against multiple independent indicators, including public data, company activity, trade patterns, industry developments, and findings from primary interviews. Validation also tested whether products, services, applications, and company revenues fell within the defined market boundaries. Adjacent categories, unsupported claims, overlapping revenues, and activities without direct market relevance were excluded to reduce double counting and maintain consistency across segments and countries. |
AI-Powered Whole-Body Imaging Market by Segments
AI-Powered Whole-Body Imaging Market segmented by Imaging Modality:
- MRI
- Computed Tomography (CT)
- X-ray
- PET-CT
- Hybrid Imaging Systems
AI-Powered Whole-Body Imaging Market segmented by Application:
- Preventive Health Screening
- Oncology Diagnostics
- Cardiovascular Assessment
- Neurological Assessment
- Precision Medicine
AI-Powered Whole-Body Imaging Market segmented by End User:
- Hospitals
- Diagnostic Imaging Centers
- Preventive Health Clinics
- Research Institutes
AI-Powered Whole-Body Imaging Market segmented by Technology:
- Deep Learning Algorithms
- Computer Vision Systems
- Cloud-based AI Platforms
- Edge AI Imaging Solutions
AI-Powered Whole-Body Imaging Market by Region:
- North America
- United States
- Canada
- Latin America
- Brazil
- Mexico
- Argentina
- Chile
- Western Europe
- Germany
- France
- United Kingdom
- Italy
- Spain
- Benelux
- Nordics
- Eastern Europe
- Poland
- Czech Republic
- Romania
- Hungary
- East Asia
- China
- Japan
- South Korea
- South Asia and Pacific
- India
- ASEAN
- Australia and New Zealand
- Middle East and Africa
- GCC Countries
- South Africa
- Türkiye
- Israel
Research Sources and Bibliography
- NHS England. (2025, November 27). Diagnostic Imaging Dataset Annual Statistical Release 2024/25.
- NHS England. (2025, October 23). Diagnostic Imaging Data Set.
- Organisation for Economic Co-operation and Development. (2025, November 13). Health at a Glance 2025: United States.
- Organisation for Economic Co-operation and Development. (2025, November 13). Health at a Glance 2025: Germany.
- Organisation for Economic Co-operation and Development. (2025, November 13). Health at a Glance 2025: Japan.
- Organisation for Economic Co-operation and Development. (2025, November 13). Health at a Glance 2025: Korea.
- Royal College of Radiologists. (2025, June 12). RCR statement on elective MRI health screening.
- American College of Radiology. (2025, March 20). ACR Position Statement on Remote Scanning.
- Prenuvo. (2025, April 7). Prenuvo Launches First Whole-Body MRI Clinic in Las Vegas, Ushering in a New Era of Preventative Health.
- Royal Philips. (2025, February 26). Philips accelerates precise imaging with unique AI technologies in MRI to improve patient outcomes.
- USA Food and Drug Administration. (2026). Artificial Intelligence-Enabled Medical Devices.
- United Imaging Healthcare. (2025, April 28). United Imaging Healthcare Releases 2024 Annual and Q1 2025 Results, Highlights Strong Global Expansion and AI Innovation.
- Siemens Healthineers. (2025, June 26). Siemens Healthineers Receives FDA Clearance for Magnetom Flow.Ace, Company’s First Helium-Free 1.5 Tesla Magnetic Resonance Scanner.
- GE HealthCare. (2026, February 19). GE HealthCare achieves MRI portfolio milestone with FDA clearances for next-generation SIGNA MRI technology designed to enhance precision imaging and clinical efficiency.
- United Imaging Healthcare. (2025, June 6). United Imaging Introduces Two Groundbreaking CE-Marked Systems: uMI Panvivo and uMR Ultra.
- Prenuvo. (2025, November 24). Prenuvo opens first European clinic, bringing advanced whole body MRI screening to London.
- Ezra. (2025, May 5). Function Health Acquires Ezra, Introduces $499 MRI Scan.
This bibliography is provided for reader reference and is not exhaustive. The full report contains the complete reference list and detailed citations.
This Report Answers
- How large is the AI-powered whole-body imaging market in 2026 and 2036?
- Which operating pressures support investment in AI-assisted multi-region imaging workflows?
- Why does MRI account for the largest imaging modality share in 2026?
- How does preventive health screening influence service design and clinical follow-up?
- Why do hospitals represent a major end user for AI-powered whole-body imaging?
- How do country growth conditions differ across the USA, UK, Germany, Japan, and South Korea?
- Which companies provide imaging systems, reconstruction software, or managed whole-body screening services?
- What limits routine preventive adoption among people without symptoms?
Frequently Asked Questions
How big is the AI-Powered Whole-Body Imaging Market in 2026?
The AI-powered whole-body imaging market is valued at USD 1.5 billion in 2026 and is forecast to reach USD 7.2 billion by 2036. Growth reflects radiology departments purchasing these systems to shorten scan preparation and reconstruction while preserving diagnostic quality across multiple anatomical regions.
What is the CAGR of the AI-Powered Whole-Body Imaging Market from 2026 to 2036?
The AI-powered whole-body imaging market grows at a CAGR of 16.6% between 2026 and 2036, supported by diagnostic backlogs that increase the value of faster acquisition and reconstruction across imaging departments with limited specialist capacity.
Which application leads the AI-Powered Whole-Body Imaging Market?
Preventive health screening accounts for 41.5% of the AI-powered whole-body imaging market by application in 2026, attributable to structured multi-organ assessment within one scheduled visit that private-pay channels package with predictable specialist scheduling.
How much will the AI-Powered Whole-Body Imaging Market add between 2026 and 2036?
The AI-powered whole-body imaging market is set to add USD 5.7 billion between 2026 and 2036, growing from USD 1.5 billion to USD 7.2 billion as accelerated reconstruction and multi-region protocols extend across a widening base of hospital and preventive-screening providers.
Who are the leading companies in the AI-Powered Whole-Body Imaging Market?
Five companies lead the AI-powered whole-body imaging market, including Siemens Healthineers, GE HealthCare, Royal Philips, Canon Medical Systems, and Fujifilm Healthcare, competing through AI reconstruction, workflow tools, and multi-anatomy imaging platforms across global service networks.
Preview the report firsthand - request a free sample
Get SampleGet the brochure for pricing and purchase details.
Get PDFTable of Content
- Key Takeaways
- Market Size and CAGR
- Top Growth Driver
- Fastest Growing Segment
- Leading Region
- Key Companies
- Emerging Opportunities
- Executive Summary
- Global Market Outlook
- Demand-side Trends
- Supply-side Trends
- Technology Roadmap Analysis
- Analysis and Recommendations
- Analyst Perspective (What is happening? Why now? What should investors know?)
- Key Questions Answered
- How large is the market?
- What is the CAGR?
- What are key trends?
- Which region dominates?
- Who are the leaders?
- Market Overview
- Market Coverage / Taxonomy
- Market Definition / Scope / Limitations
- Research Methodology
- Chapter Orientation
- Analytical Lens and Working Hypotheses
- Market Structure, Signals, and Trend Drivers
- Benchmarking and Cross-market Comparability
- Market Sizing, Forecasting, and Opportunity Mapping
- Research Design and Evidence Framework
- Desk Research Programme (Secondary Evidence)
- Expert Input and Fieldwork (Primary Evidence)
- Tooling, Models, and Reference Databases
- Data Engineering and Model Build
- Quality Assurance and Audit Trail
- Market Background
- Market Dynamics (Drivers, Restraints, Opportunity, Trends)
- Scenario Forecast (Optimistic, Likely, Conservative)
- Impact Analysis
- AI Impact
- Sustainability Impact
- Regulatory Impact
- Technology Impact
- Consumer / Buyer Analysis
- Purchase Drivers
- Adoption Barriers
- Buyer Journey
- Opportunity Map Analysis
- Product Life Cycle Analysis
- Supply Chain Analysis
- Investment Feasibility Matrix
- Value Chain Analysis
- PESTLE and Porter's Analysis
- Regulatory Landscape
- Regional Parent Market Outlook
- Production and Consumption Statistics
- Import and Export Statistics
- Global Market Analysis and Forecast, 2021 to 2036
- Historical Market Size Value (USD Billion) Analysis, 2021 to 2025
- Current and Future Market Size Value (USD Billion) Projections, 2026 to 2036
- Y-o-Y Growth Trend Analysis
- Absolute $ Opportunity Analysis
- Global Market Pricing Analysis, 2021 to 2036
- Global Market Analysis and Forecast, By Imaging Modality, 2021 to 2036
- Introduction / Key Findings
- Historical Market Size Value (USD Billion) Analysis By Imaging Modality, 2021 to 2025
- Current and Future Market Size Value (USD Billion) Analysis and Forecast By Imaging Modality, 2026 to 2036
- MRI
- Computed Tomography (CT)
- X-ray
- PET-CT
- Hybrid Imaging Systems
- MRI
- Y-o-Y Growth Trend Analysis By Imaging Modality, 2021 to 2025
- Absolute $ Opportunity Analysis By Imaging Modality, 2026 to 2036
- Global Market Analysis and Forecast, By Application, 2021 to 2036
- Introduction / Key Findings
- Historical Market Size Value (USD Billion) Analysis By Application, 2021 to 2025
- Current and Future Market Size Value (USD Billion) Analysis and Forecast By Application, 2026 to 2036
- Preventive Health Screening
- Oncology Diagnostics
- Cardiovascular Assessment
- Neurological Assessment
- Precision Medicine
- Preventive Health Screening
- Y-o-Y Growth Trend Analysis By Application, 2021 to 2025
- Absolute $ Opportunity Analysis By Application, 2026 to 2036
- Global Market Analysis and Forecast, By End User, 2021 to 2036
- Introduction / Key Findings
- Historical Market Size Value (USD Billion) Analysis By End User, 2021 to 2025
- Current and Future Market Size Value (USD Billion) Analysis and Forecast By End User, 2026 to 2036
- Hospitals
- Diagnostic Imaging Centers
- Preventive Health Clinics
- Research Institutes
- Hospitals
- Y-o-Y Growth Trend Analysis By End User, 2021 to 2025
- Absolute $ Opportunity Analysis By End User, 2026 to 2036
- Global Market Analysis and Forecast, By Technology, 2021 to 2036
- Introduction / Key Findings
- Historical Market Size Value (USD Billion) Analysis By Technology, 2021 to 2025
- Current and Future Market Size Value (USD Billion) Analysis and Forecast By Technology, 2026 to 2036
- Deep Learning Algorithms
- Computer Vision Systems
- Cloud-based AI Platforms
- Edge AI Imaging Solutions
- Deep Learning Algorithms
- Y-o-Y Growth Trend Analysis By Technology, 2021 to 2025
- Absolute $ Opportunity Analysis By Technology, 2026 to 2036
- Global Market Analysis and Forecast, By Region, 2021 to 2036
- Introduction
- Historical Market Size Value (USD Billion) Analysis By Region, 2021 to 2025
- Current Market Size Value (USD Billion) Analysis and Forecast By Region, 2026 to 2036
- North America
- Latin America
- Western Europe
- Eastern Europe
- East Asia
- South Asia and Pacific
- Middle East & Africa
- Market Attractiveness Analysis By Region
- North America Market Analysis and Forecast, By Country, 2021 to 2036
- Historical Market Size Value (USD Billion) Trend Analysis By Market Taxonomy, 2021 to 2025
- Market Size Value (USD Billion) Forecast By Market Taxonomy, 2026 to 2036
- By Country
- USA
- Canada
- By Imaging Modality
- By Application
- By End User
- By Technology
- By Country
- Market Attractiveness Analysis
- By Country
- By Imaging Modality
- By Application
- By End User
- By Technology
- Key Takeaways
- Latin America Market Analysis and Forecast, By Country
- Historical Market Size Value (USD Billion) Trend Analysis By Market Taxonomy, 2021 to 2025
- Market Size Value (USD Billion) Forecast By Market Taxonomy, 2026 to 2036
- By Country
- Brazil
- Mexico
- Chile
- Rest of Latin America
- By Imaging Modality
- By Application
- By End User
- By Technology
- By Country
- Market Attractiveness Analysis
- By Country
- By Imaging Modality
- By Application
- By End User
- By Technology
- Key Takeaways
- Western Europe Market Analysis and Forecast, By Country
- Historical Market Size Value (USD Billion) Trend Analysis By Market Taxonomy, 2021 to 2025
- Market Size Value (USD Billion) Forecast By Market Taxonomy, 2026 to 2036
- By Country
- Germany
- UK
- Italy
- Spain
- France
- Nordic
- BENELUX
- Rest of Western Europe
- By Imaging Modality
- By Application
- By End User
- By Technology
- By Country
- Market Attractiveness Analysis
- By Country
- By Imaging Modality
- By Application
- By End User
- By Technology
- Key Takeaways
- Eastern Europe Market Analysis and Forecast, By Country
- Historical Market Size Value (USD Billion) Trend Analysis By Market Taxonomy, 2021 to 2025
- Market Size Value (USD Billion) Forecast By Market Taxonomy, 2026 to 2036
- By Country
- Russia
- Poland
- Hungary
- Balkan & Baltic
- Rest of Eastern Europe
- By Imaging Modality
- By Application
- By End User
- By Technology
- By Country
- Market Attractiveness Analysis
- By Country
- By Imaging Modality
- By Application
- By End User
- By Technology
- Key Takeaways
- East Asia Market Analysis and Forecast, By Country
- Historical Market Size Value (USD Billion) Trend Analysis By Market Taxonomy, 2021 to 2025
- Market Size Value (USD Billion) Forecast By Market Taxonomy, 2026 to 2036
- By Country
- China
- Japan
- South Korea
- By Imaging Modality
- By Application
- By End User
- By Technology
- By Country
- Market Attractiveness Analysis
- By Country
- By Imaging Modality
- By Application
- By End User
- By Technology
- Key Takeaways
- South Asia and Pacific Market Analysis and Forecast, By Country
- Historical Market Size Value (USD Billion) Trend Analysis By Market Taxonomy, 2021 to 2025
- Market Size Value (USD Billion) Forecast By Market Taxonomy, 2026 to 2036
- By Country
- India
- ASEAN
- Australia & New Zealand
- Rest of South Asia and Pacific
- By Imaging Modality
- By Application
- By End User
- By Technology
- By Country
- Market Attractiveness Analysis
- By Country
- By Imaging Modality
- By Application
- By End User
- By Technology
- Key Takeaways
- Middle East & Africa Market Analysis and Forecast, By Country
- Historical Market Size Value (USD Billion) Trend Analysis By Market Taxonomy, 2021 to 2025
- Market Size Value (USD Billion) Forecast By Market Taxonomy, 2026 to 2036
- By Country
- Kingdom of Saudi Arabia
- Other GCC Countries
- Türkiye
- South Africa
- Other African Union
- Rest of Middle East & Africa
- By Imaging Modality
- By Application
- By End User
- By Technology
- By Country
- Market Attractiveness Analysis
- By Country
- By Imaging Modality
- By Application
- By End User
- By Technology
- Key Takeaways
- Key Countries Market Analysis
- USA
- Pricing Analysis
- Market Share Analysis, 2025
- By Imaging Modality
- By Application
- By End User
- By Technology
- Canada
- Pricing Analysis
- Market Share Analysis, 2025
- By Imaging Modality
- By Application
- By End User
- By Technology
- Mexico
- Pricing Analysis
- Market Share Analysis, 2025
- By Imaging Modality
- By Application
- By End User
- By Technology
- Brazil
- Pricing Analysis
- Market Share Analysis, 2025
- By Imaging Modality
- By Application
- By End User
- By Technology
- Chile
- Pricing Analysis
- Market Share Analysis, 2025
- By Imaging Modality
- By Application
- By End User
- By Technology
- Germany
- Pricing Analysis
- Market Share Analysis, 2025
- By Imaging Modality
- By Application
- By End User
- By Technology
- UK
- Pricing Analysis
- Market Share Analysis, 2025
- By Imaging Modality
- By Application
- By End User
- By Technology
- Italy
- Pricing Analysis
- Market Share Analysis, 2025
- By Imaging Modality
- By Application
- By End User
- By Technology
- Spain
- Pricing Analysis
- Market Share Analysis, 2025
- By Imaging Modality
- By Application
- By End User
- By Technology
- France
- Pricing Analysis
- Market Share Analysis, 2025
- By Imaging Modality
- By Application
- By End User
- By Technology
- India
- Pricing Analysis
- Market Share Analysis, 2025
- By Imaging Modality
- By Application
- By End User
- By Technology
- ASEAN
- Pricing Analysis
- Market Share Analysis, 2025
- By Imaging Modality
- By Application
- By End User
- By Technology
- Australia & New Zealand
- Pricing Analysis
- Market Share Analysis, 2025
- By Imaging Modality
- By Application
- By End User
- By Technology
- China
- Pricing Analysis
- Market Share Analysis, 2025
- By Imaging Modality
- By Application
- By End User
- By Technology
- Japan
- Pricing Analysis
- Market Share Analysis, 2025
- By Imaging Modality
- By Application
- By End User
- By Technology
- South Korea
- Pricing Analysis
- Market Share Analysis, 2025
- By Imaging Modality
- By Application
- By End User
- By Technology
- Russia
- Pricing Analysis
- Market Share Analysis, 2025
- By Imaging Modality
- By Application
- By End User
- By Technology
- Poland
- Pricing Analysis
- Market Share Analysis, 2025
- By Imaging Modality
- By Application
- By End User
- By Technology
- Hungary
- Pricing Analysis
- Market Share Analysis, 2025
- By Imaging Modality
- By Application
- By End User
- By Technology
- Kingdom of Saudi Arabia
- Pricing Analysis
- Market Share Analysis, 2025
- By Imaging Modality
- By Application
- By End User
- By Technology
- Türkiye
- Pricing Analysis
- Market Share Analysis, 2025
- By Imaging Modality
- By Application
- By End User
- By Technology
- South Africa
- Pricing Analysis
- Market Share Analysis, 2025
- By Imaging Modality
- By Application
- By End User
- By Technology
- USA
- Market Structure Analysis
- Competition Dashboard
- Competition Benchmarking
- Market Share Analysis of Top Players
- By Regional
- By Imaging Modality
- By Application
- By End User
- By Technology
- Emerging Startups
- Innovation Benchmarking
- Competition Analysis
- Competition Deep Dive
- Siemens Healthineers
- Overview
- Product Portfolio
- Profitability by Market Segments
- Sales Footprint
- Strategy Overview
- Marketing Strategy
- Product Strategy
- Channel Strategy
- GE HealthCare
- Koninklijke Philips
- Canon Medical Systems
- Fujifilm Holdings
- Aidoc
- Qure.ai
- Nanox Imaging
- Viz.ai
- Arterys
- Siemens Healthineers
- Case Studies
- Success Stories
- Recent Developments
- Competition Deep Dive
- Assumptions & Acronyms Used


