Air Entrainment Meters for Mortar Market Size and Share Forecast Outlook 2025 to 2035

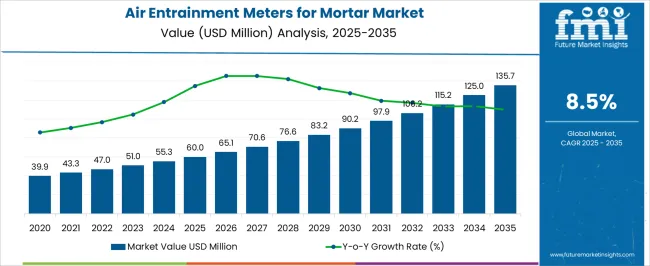
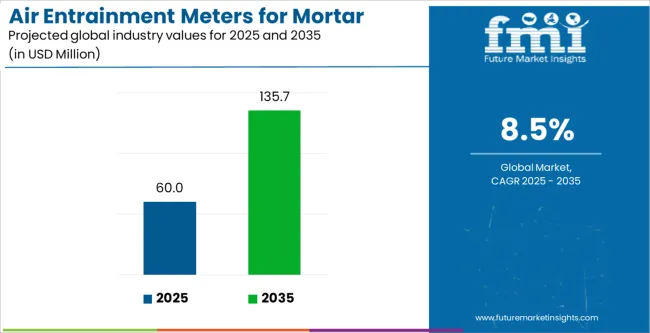
The Air Entrainment Meters for Mortar Market is estimated to be valued at USD 60.0 million in 2025 and is projected to reach USD 135.7 million by 2035, registering a compound annual growth rate (CAGR) of 8.5% over the forecast period.
Quick Stats for Air Entrainment Meters for Mortar Market

  • Air Entrainment Meters for Mortar Market Value (2025): USD 60.0 million
  • Air Entrainment Meters for Mortar Market Forecast Value (2035): USD 135.7 million
  • Air Entrainment Meters for Mortar Market Forecast CAGR: 8.5%
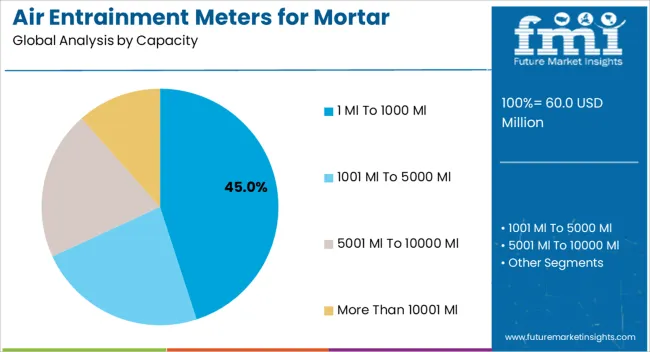
  • Leading Segment in Air Entrainment Meters for Mortar Market in 2025: 1 Ml To 1000 Ml (45.0%)
  • Key Growth Regions in Air Entrainment Meters for Mortar Market: North America, Asia-Pacific, Europe
  • Top Key Players in Air Entrainment Meters for Mortar Market: GEA Group, Trox, TSI Incorporated, Airflow Developments, Kanomax USA, Inc., Sensirion AG, KIMO Instruments, Testo SE & Co. KGaA

Air Entrainment Meters For Mortar Market Market Value Analysis

Air Entrainment Meters for Mortar Market Key Takeaways

Air Entrainment Meters For Mortar Market Industry Value Analysis

Metric Value
Air Entrainment Meters for Mortar Market Estimated Value in (2025 E) USD 60.0 million
Air Entrainment Meters for Mortar Market Forecast Value in (2035 F) USD 135.7 million
Forecast CAGR (2025 to 2035) 8.5%

Why is the Air Entrainment Meters for Mortar Market Growing?

The Air Entrainment Meters for Mortar market is being driven by increasing demand for quality assurance and performance testing in construction materials, particularly in mortar formulations. The current market scenario reflects heightened adoption across infrastructure projects, residential buildings, and commercial construction where consistent air content is essential for durability, workability, and resistance to freeze-thaw cycles. The growing emphasis on sustainable construction practices and improved material performance has further supported market expansion.

The outlook for the market remains positive as stricter regulations related to structural integrity and environmental factors are being enforced globally. The adoption of air entrainment testing is being encouraged by industry standards that aim to ensure long-term strength and resilience in mortar mixes.

Additionally, advancements in portable and easy-to-operate testing instruments have made it feasible for on-site monitoring, which is expected to expand usage among contractors and engineers As construction activity continues to rise in both developing and developed regions, the market for air entrainment meters is anticipated to grow steadily, driven by increasing awareness of material optimization and adherence to performance benchmarks.

Segmental Analysis

The air entrainment meters for mortar market is segmented by capacity, and geographic regions. By capacity, air entrainment meters for mortar market is divided into 1 Ml To 1000 Ml, 1001 Ml To 5000 Ml, 5001 Ml To 10000 Ml, and More Than 10001 Ml. Regionally, the air entrainment meters for mortar industry is classified into North America, Latin America, Western Europe, Eastern Europe, Balkan & Baltic Countries, Russia & Belarus, Central Asia, East Asia, South Asia & Pacific, and the Middle East & Africa.
Insights into the 1 Ml To 1000 Ml Capacity Segment

Air Entrainment Meters For Mortar Market Analysis By Capacity

The 1 Ml to 1000 Ml capacity segment is expected to account for 45.00% of the total Air Entrainment Meters for Mortar market revenue in 2025, making it the leading segment by capacity. This prominence has been attributed to its adaptability for a wide range of mortar testing applications, from small-scale laboratory experiments to larger field assessments. The segment’s popularity is being reinforced by its compatibility with standard testing protocols, which are required by construction professionals to verify air content levels across varying batch sizes.

The ease of operation and portability offered by this capacity range has made it a preferred choice for on-site testing, where efficiency and accuracy are essential. Additionally, the segment has benefitted from growing demand for quality assurance in both residential and commercial construction projects, where performance consistency is critical to structural longevity.

The availability of compact devices that can be recalibrated and used repeatedly without extensive technical support has further encouraged adoption As construction projects increasingly demand precise testing methods for improved safety and sustainability, this segment is expected to maintain its leadership in the market.

Market Overview

Air Entrainment Meters Market: Overview

Air entrainment meters measure the air content of freshly mixed mortar which is a vital test to check the quality of mortar. Air entrainment meters for mortar is used for making construction process more efficient and with better quality. The rising concerns related to poor quality mortar is resulting into high adoption of air entrainment meters for mortar in various regions.

Air entrainment meters for mortar is witnessing high demand in construction industry due to various accurate results provided by the equipment. Air entrainment meter for mortar is used in the process for determining the content of air in cement paste.
Analysis of Air Entrainment Meters for Mortar Market By Key Countries

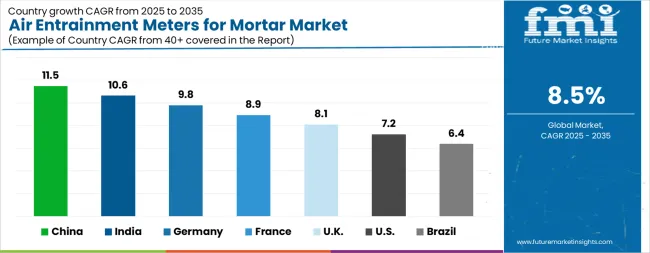
Air Entrainment Meters For Mortar Market Cagr Analysis By Country

Country CAGR
China 11.5%
India 10.6%
Germany 9.8%
France 8.9%
UK 8.1%
USA 7.2%
Brazil 6.4%

Country-wise Analysis

The Air Entrainment Meters for Mortar Market is expected to register a CAGR of 8.5% during the forecast period, exhibiting varied country level momentum. China leads with the highest CAGR of 11.5%, followed by India at 10.6%. Developed markets such as Germany, France, and the UK continue to expand steadily, while the USA is likely to grow at consistent rates. Brazil posts the lowest CAGR at 6.4%, yet still underscores a broadly positive trajectory for the global Air Entrainment Meters for Mortar Market. In 2024, Germany held a dominant revenue in the Western Europe market and is expected to grow with a CAGR of 9.8%. The USA Air Entrainment Meters for Mortar Market is estimated to be valued at USD 20.4 million in 2025 and is anticipated to reach a valuation of USD 41.0 million by 2035. Sales are projected to rise at a CAGR of 7.2% over the forecast period between 2025 and 2035. While Japan and South Korea markets are estimated to be valued at USD 3.3 million and USD 1.8 million respectively in 2025.
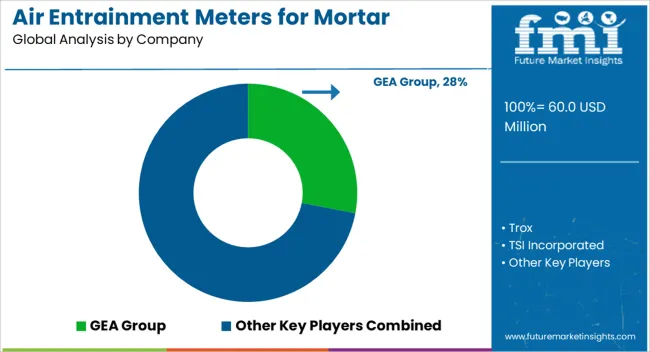
Key Players in the Air Entrainment Meters for Mortar Market

Air Entrainment Meters For Mortar Market Analysis By Company

  • GEA Group
  • Trox
  • TSI Incorporated
  • Airflow Developments
  • Kanomax USA, Inc.
  • Sensirion AG
  • KIMO Instruments
  • Testo SE & Co. KGaA

Scope of the Report

Item Value
Quantitative Units USD 60.0 Million
Capacity 1 Ml To 1000 Ml, 1001 Ml To 5000 Ml, 5001 Ml To 10000 Ml, and More Than 10001 Ml
Regions Covered North America, Europe, Asia-Pacific, Latin America, Middle East & Africa
Country Covered United States, Canada, Germany, France, United Kingdom, China, Japan, India, Brazil, South Africa
Key Companies Profiled GEA Group, Trox, TSI Incorporated, Airflow Developments, Kanomax USA, Inc., Sensirion AG, KIMO Instruments, and Testo SE & Co. KGaA

Air Entrainment Meters for Mortar Market by Segments

Capacity:

  • 1 Ml To 1000 Ml
  • 1001 Ml To 5000 Ml
  • 5001 Ml To 10000 Ml
  • More Than 10001 Ml

Region:

  • North America
    • USA
    • Canada
    • Mexico
  • Latin America
    • Brazil
    • Chile
    • Rest of Latin America
  • Western Europe
    • Germany
    • UK
    • Italy
    • Spain
    • France
    • Nordic
    • BENELUX
    • Rest of Western Europe
  • Eastern Europe
    • Russia
    • Poland
    • Hungary
    • Balkan & Baltic
    • Rest of Eastern Europe
  • East Asia
    • China
    • Japan
    • South Korea
  • South Asia and Pacific
    • India
    • ASEAN
    • Australia & New Zealand
    • Rest of South Asia and Pacific
  • Middle East & Africa
    • Kingdom of Saudi Arabia
    • Other GCC Countries
    • Turkiye
    • South Africa
    • Other African Union
    • Rest of Middle East & Africa

Table of Content

  1. Executive Summary
    • Global Market Outlook
    • Demand-side Trends
    • Supply-side Trends
    • Technology Roadmap Analysis
    • Analysis and Recommendations
  2. Market Overview
    • Market Coverage / Taxonomy
    • Market Definition / Scope / Limitations
  3. Market Background
    • Market Dynamics
      • Drivers
      • Restraints
      • Opportunity
      • Trends
    • Scenario Forecast
      • Demand in Optimistic Scenario
      • Demand in Likely Scenario
      • Demand in Conservative Scenario
    • Opportunity Map Analysis
    • Product Life Cycle Analysis
    • Supply Chain Analysis
    • Investment Feasibility Matrix
    • Value Chain Analysis
    • PESTLE and Porter’s Analysis
    • Regulatory Landscape
    • Regional Parent Market Outlook
    • Production and Consumption Statistics
    • Import and Export Statistics
  4. Global Market Analysis 2020 to 2024 and Forecast, 2025 to 2035
    • Historical Market Size Value (USD Million) Analysis, 2020 to 2024
    • Current and Future Market Size Value (USD Million) Projections, 2025 to 2035
      • Y-o-Y Growth Trend Analysis
      • Absolute $ Opportunity Analysis
  5. Global Market Pricing Analysis 2020 to 2024 and Forecast 2025 to 2035
  6. Global Market Analysis 2020 to 2024 and Forecast 2025 to 2035, By Capacity
    • Introduction / Key Findings
    • Historical Market Size Value (USD Million) Analysis By Capacity , 2020 to 2024
    • Current and Future Market Size Value (USD Million) Analysis and Forecast By Capacity , 2025 to 2035
      • 1 Ml To 1000 Ml
      • 1001 Ml To 5000 Ml
      • 5001 Ml To 10000 Ml
      • More Than 10001 Ml
    • Y-o-Y Growth Trend Analysis By Capacity , 2020 to 2024
    • Absolute $ Opportunity Analysis By Capacity , 2025 to 2035
  7. Global Market Analysis 2020 to 2024 and Forecast 2025 to 2035, By Region
    • Introduction
    • Historical Market Size Value (USD Million) Analysis By Region, 2020 to 2024
    • Current Market Size Value (USD Million) Analysis and Forecast By Region, 2025 to 2035
      • North America
      • Latin America
      • Western Europe
      • Eastern Europe
      • East Asia
      • South Asia and Pacific
      • Middle East & Africa
    • Market Attractiveness Analysis By Region
  8. North America Market Analysis 2020 to 2024 and Forecast 2025 to 2035, By Country
    • Historical Market Size Value (USD Million) Trend Analysis By Market Taxonomy, 2020 to 2024
    • Market Size Value (USD Million) Forecast By Market Taxonomy, 2025 to 2035
      • By Country
        • USA
        • Canada
        • Mexico
      • By Capacity
    • Market Attractiveness Analysis
      • By Country
      • By Capacity
    • Key Takeaways
  9. Latin America Market Analysis 2020 to 2024 and Forecast 2025 to 2035, By Country
    • Historical Market Size Value (USD Million) Trend Analysis By Market Taxonomy, 2020 to 2024
    • Market Size Value (USD Million) Forecast By Market Taxonomy, 2025 to 2035
      • By Country
        • Brazil
        • Chile
        • Rest of Latin America
      • By Capacity
    • Market Attractiveness Analysis
      • By Country
      • By Capacity
    • Key Takeaways
  10. Western Europe Market Analysis 2020 to 2024 and Forecast 2025 to 2035, By Country
    • Historical Market Size Value (USD Million) Trend Analysis By Market Taxonomy, 2020 to 2024
    • Market Size Value (USD Million) Forecast By Market Taxonomy, 2025 to 2035
      • By Country
        • Germany
        • UK
        • Italy
        • Spain
        • France
        • Nordic
        • BENELUX
        • Rest of Western Europe
      • By Capacity
    • Market Attractiveness Analysis
      • By Country
      • By Capacity
    • Key Takeaways
  11. Eastern Europe Market Analysis 2020 to 2024 and Forecast 2025 to 2035, By Country
    • Historical Market Size Value (USD Million) Trend Analysis By Market Taxonomy, 2020 to 2024
    • Market Size Value (USD Million) Forecast By Market Taxonomy, 2025 to 2035
      • By Country
        • Russia
        • Poland
        • Hungary
        • Balkan & Baltic
        • Rest of Eastern Europe
      • By Capacity
    • Market Attractiveness Analysis
      • By Country
      • By Capacity
    • Key Takeaways
  12. East Asia Market Analysis 2020 to 2024 and Forecast 2025 to 2035, By Country
    • Historical Market Size Value (USD Million) Trend Analysis By Market Taxonomy, 2020 to 2024
    • Market Size Value (USD Million) Forecast By Market Taxonomy, 2025 to 2035
      • By Country
        • China
        • Japan
        • South Korea
      • By Capacity
    • Market Attractiveness Analysis
      • By Country
      • By Capacity
    • Key Takeaways
  13. South Asia and Pacific Market Analysis 2020 to 2024 and Forecast 2025 to 2035, By Country
    • Historical Market Size Value (USD Million) Trend Analysis By Market Taxonomy, 2020 to 2024
    • Market Size Value (USD Million) Forecast By Market Taxonomy, 2025 to 2035
      • By Country
        • India
        • ASEAN
        • Australia & New Zealand
        • Rest of South Asia and Pacific
      • By Capacity
    • Market Attractiveness Analysis
      • By Country
      • By Capacity
    • Key Takeaways
  14. Middle East & Africa Market Analysis 2020 to 2024 and Forecast 2025 to 2035, By Country
    • Historical Market Size Value (USD Million) Trend Analysis By Market Taxonomy, 2020 to 2024
    • Market Size Value (USD Million) Forecast By Market Taxonomy, 2025 to 2035
      • By Country
        • Kingdom of Saudi Arabia
        • Other GCC Countries
        • Turkiye
        • South Africa
        • Other African Union
        • Rest of Middle East & Africa
      • By Capacity
    • Market Attractiveness Analysis
      • By Country
      • By Capacity
    • Key Takeaways
  15. Key Countries Market Analysis
    • USA
      • Pricing Analysis
      • Market Share Analysis, 2024
        • By Capacity
    • Canada
      • Pricing Analysis
      • Market Share Analysis, 2024
        • By Capacity
    • Mexico
      • Pricing Analysis
      • Market Share Analysis, 2024
        • By Capacity
    • Brazil
      • Pricing Analysis
      • Market Share Analysis, 2024
        • By Capacity
    • Chile
      • Pricing Analysis
      • Market Share Analysis, 2024
        • By Capacity
    • Germany
      • Pricing Analysis
      • Market Share Analysis, 2024
        • By Capacity
    • UK
      • Pricing Analysis
      • Market Share Analysis, 2024
        • By Capacity
    • Italy
      • Pricing Analysis
      • Market Share Analysis, 2024
        • By Capacity
    • Spain
      • Pricing Analysis
      • Market Share Analysis, 2024
        • By Capacity
    • France
      • Pricing Analysis
      • Market Share Analysis, 2024
        • By Capacity
    • India
      • Pricing Analysis
      • Market Share Analysis, 2024
        • By Capacity
    • ASEAN
      • Pricing Analysis
      • Market Share Analysis, 2024
        • By Capacity
    • Australia & New Zealand
      • Pricing Analysis
      • Market Share Analysis, 2024
        • By Capacity
    • China
      • Pricing Analysis
      • Market Share Analysis, 2024
        • By Capacity
    • Japan
      • Pricing Analysis
      • Market Share Analysis, 2024
        • By Capacity
    • South Korea
      • Pricing Analysis
      • Market Share Analysis, 2024
        • By Capacity
    • Russia
      • Pricing Analysis
      • Market Share Analysis, 2024
        • By Capacity
    • Poland
      • Pricing Analysis
      • Market Share Analysis, 2024
        • By Capacity
    • Hungary
      • Pricing Analysis
      • Market Share Analysis, 2024
        • By Capacity
    • Kingdom of Saudi Arabia
      • Pricing Analysis
      • Market Share Analysis, 2024
        • By Capacity
    • Turkiye
      • Pricing Analysis
      • Market Share Analysis, 2024
        • By Capacity
    • South Africa
      • Pricing Analysis
      • Market Share Analysis, 2024
        • By Capacity
  16. Market Structure Analysis
    • Competition Dashboard
    • Competition Benchmarking
    • Market Share Analysis of Top Players
      • By Regional
      • By Capacity
  17. Competition Analysis
    • Competition Deep Dive
      • GEA Group
        • Overview
        • Product Portfolio
        • Profitability by Market Segments (Product/Age /Sales Channel/Region)
        • Sales Footprint
        • Strategy Overview
          • Marketing Strategy
          • Product Strategy
          • Channel Strategy
      • Trox
      • TSI Incorporated
      • Airflow Developments
      • Kanomax USA, Inc.
      • Sensirion AG
      • KIMO Instruments
      • Testo SE & Co. KGaA
  18. Assumptions & Acronyms Used
  19. Research Methodology

List of Tables

  • Table 1: Global Market Value (USD Million) Forecast by Region, 2020 to 2035
  • Table 2: Global Market Value (USD Million) Forecast by Capacity , 2020 to 2035
  • Table 3: North America Market Value (USD Million) Forecast by Country, 2020 to 2035
  • Table 4: North America Market Value (USD Million) Forecast by Capacity , 2020 to 2035
  • Table 5: Latin America Market Value (USD Million) Forecast by Country, 2020 to 2035
  • Table 6: Latin America Market Value (USD Million) Forecast by Capacity , 2020 to 2035
  • Table 7: Western Europe Market Value (USD Million) Forecast by Country, 2020 to 2035
  • Table 8: Western Europe Market Value (USD Million) Forecast by Capacity , 2020 to 2035
  • Table 9: Eastern Europe Market Value (USD Million) Forecast by Country, 2020 to 2035
  • Table 10: Eastern Europe Market Value (USD Million) Forecast by Capacity , 2020 to 2035
  • Table 11: East Asia Market Value (USD Million) Forecast by Country, 2020 to 2035
  • Table 12: East Asia Market Value (USD Million) Forecast by Capacity , 2020 to 2035
  • Table 13: South Asia and Pacific Market Value (USD Million) Forecast by Country, 2020 to 2035
  • Table 14: South Asia and Pacific Market Value (USD Million) Forecast by Capacity , 2020 to 2035
  • Table 15: Middle East & Africa Market Value (USD Million) Forecast by Country, 2020 to 2035
  • Table 16: Middle East & Africa Market Value (USD Million) Forecast by Capacity , 2020 to 2035

List of Figures

  • Figure 1: Global Market Pricing Analysis
  • Figure 2: Global Market Value (USD Million) Forecast 2020-2035
  • Figure 3: Global Market Value Share and BPS Analysis by Capacity , 2025 and 2035
  • Figure 4: Global Market Y-o-Y Growth Comparison by Capacity , 2025-2035
  • Figure 5: Global Market Attractiveness Analysis by Capacity
  • Figure 6: Global Market Value (USD Million) Share and BPS Analysis by Region, 2025 and 2035
  • Figure 7: Global Market Y-o-Y Growth Comparison by Region, 2025-2035
  • Figure 8: Global Market Attractiveness Analysis by Region
  • Figure 9: North America Market Incremental Dollar Opportunity, 2025-2035
  • Figure 10: Latin America Market Incremental Dollar Opportunity, 2025-2035
  • Figure 11: Western Europe Market Incremental Dollar Opportunity, 2025-2035
  • Figure 12: Eastern Europe Market Incremental Dollar Opportunity, 2025-2035
  • Figure 13: East Asia Market Incremental Dollar Opportunity, 2025-2035
  • Figure 14: South Asia and Pacific Market Incremental Dollar Opportunity, 2025-2035
  • Figure 15: Middle East & Africa Market Incremental Dollar Opportunity, 2025-2035
  • Figure 16: North America Market Value Share and BPS Analysis by Country, 2025 and 2035
  • Figure 17: North America Market Value Share and BPS Analysis by Capacity , 2025 and 2035
  • Figure 18: North America Market Y-o-Y Growth Comparison by Capacity , 2025-2035
  • Figure 19: North America Market Attractiveness Analysis by Capacity
  • Figure 20: Latin America Market Value Share and BPS Analysis by Country, 2025 and 2035
  • Figure 21: Latin America Market Value Share and BPS Analysis by Capacity , 2025 and 2035
  • Figure 22: Latin America Market Y-o-Y Growth Comparison by Capacity , 2025-2035
  • Figure 23: Latin America Market Attractiveness Analysis by Capacity
  • Figure 24: Western Europe Market Value Share and BPS Analysis by Country, 2025 and 2035
  • Figure 25: Western Europe Market Value Share and BPS Analysis by Capacity , 2025 and 2035
  • Figure 26: Western Europe Market Y-o-Y Growth Comparison by Capacity , 2025-2035
  • Figure 27: Western Europe Market Attractiveness Analysis by Capacity
  • Figure 28: Eastern Europe Market Value Share and BPS Analysis by Country, 2025 and 2035
  • Figure 29: Eastern Europe Market Value Share and BPS Analysis by Capacity , 2025 and 2035
  • Figure 30: Eastern Europe Market Y-o-Y Growth Comparison by Capacity , 2025-2035
  • Figure 31: Eastern Europe Market Attractiveness Analysis by Capacity
  • Figure 32: East Asia Market Value Share and BPS Analysis by Country, 2025 and 2035
  • Figure 33: East Asia Market Value Share and BPS Analysis by Capacity , 2025 and 2035
  • Figure 34: East Asia Market Y-o-Y Growth Comparison by Capacity , 2025-2035
  • Figure 35: East Asia Market Attractiveness Analysis by Capacity
  • Figure 36: South Asia and Pacific Market Value Share and BPS Analysis by Country, 2025 and 2035
  • Figure 37: South Asia and Pacific Market Value Share and BPS Analysis by Capacity , 2025 and 2035
  • Figure 38: South Asia and Pacific Market Y-o-Y Growth Comparison by Capacity , 2025-2035
  • Figure 39: South Asia and Pacific Market Attractiveness Analysis by Capacity
  • Figure 40: Middle East & Africa Market Value Share and BPS Analysis by Country, 2025 and 2035
  • Figure 41: Middle East & Africa Market Value Share and BPS Analysis by Capacity , 2025 and 2035
  • Figure 42: Middle East & Africa Market Y-o-Y Growth Comparison by Capacity , 2025-2035
  • Figure 43: Middle East & Africa Market Attractiveness Analysis by Capacity
  • Figure 44: Global Market - Tier Structure Analysis
  • Figure 45: Global Market - Company Share Analysis

Frequently Asked Questions

How big is the air entrainment meters for mortar market in 2025?

The global air entrainment meters for mortar market is estimated to be valued at USD 60.0 million in 2025.

What will be the size of air entrainment meters for mortar market in 2035?

The market size for the air entrainment meters for mortar market is projected to reach USD 135.7 million by 2035.

How much will be the air entrainment meters for mortar market growth between 2025 and 2035?

The air entrainment meters for mortar market is expected to grow at a 8.5% CAGR between 2025 and 2035.

What are the key product types in the air entrainment meters for mortar market?

The key product types in air entrainment meters for mortar market are 1 ml to 1000 ml, 1001 ml to 5000 ml, 5001 ml to 10000 ml and more than 10001 ml.

Which segment to contribute significant share in the air entrainment meters for mortar market in 2025?

In terms of , segment to command 0.0% share in the air entrainment meters for mortar market in 2025.

Explore Similar Insights

Future Market Insights

Air Entrainment Meters for Mortar Market

Chat With

MaRIA

Hi There, I am MaRIA, Your Market Research Intelligence Assistant. How may I help you?