Airport Bus Market Size, Share, and Forecast Outlook (2025 to 2035)

The airport bus market is valued at 2.9 billion in 2025 and will reach 4.3 billion by 2035, growing at a CAGR of 4%. Market share erosion or gain analysis reflects how competitive dynamics are shaped by technology adoption, regulatory direction, and airport modernization efforts.
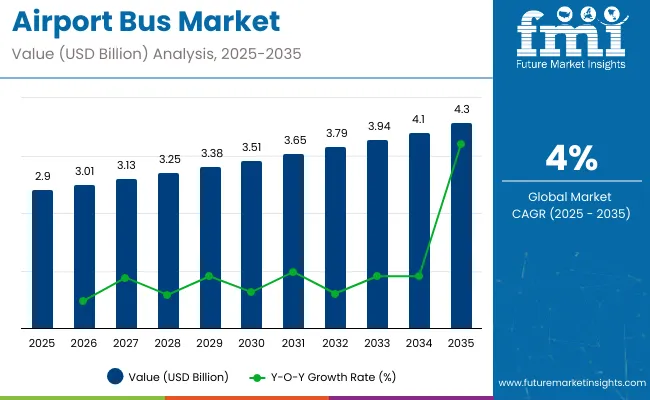
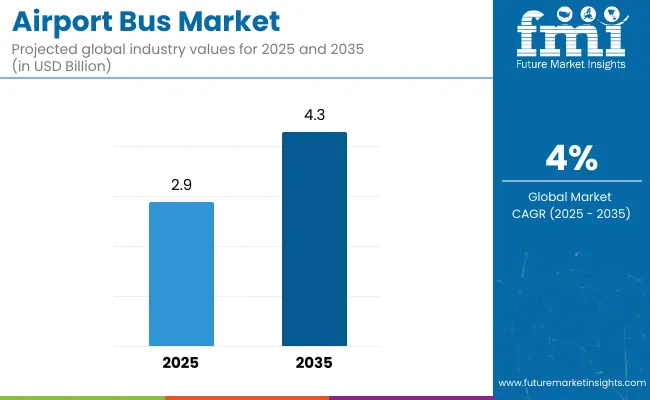
Airport Bus Market Value Analysis

Quick Stats of Airport Bus Market

  • Airport Bus Market Size (2025): USD 2.9 billion
  • Projected Airport Bus Market Size (2035): USD 4.3 billion
  • Forecast CAGR of Airport Bus Market (2025 to 2035): 4%
  • Leading Segment of Airport Bus Market (2025): Airport Transfers (45%)
  • Key Growth Regions of Airport Bus Market: North America, Europe, Asia Pacific
  • Top Key Players of Airport Bus Market: Zhongtong Bus, Stagecoachbus, Veolia Transport, Transdev Group, Keolis

Airport Bus Market

Metric Value
Airport Bus Market Estimated Value in (2025 E) USD 2.9 billion
Airport Bus Market Forecast Value in (2035 F) USD 4.3 billion
Forecast CAGR (2025 to 2035) 4%

Established manufacturers relying on conventional diesel models face gradual share loss as procurement policies increasingly prioritize low-emission and energy-efficient fleets. The pressure to align with evolving environmental standards is likely to reshape demand patterns in developed aviation hubs.

Manufacturers introducing battery-electric and hybrid airport buses, along with digital fleet management systems and flexible cabin layouts, are positioned to capture share as airports invest in operational efficiency and improved passenger handling. Regional conditions also play a decisive role.

Airports in Europe and Asia Pacific are transitioning toward electric buses more quickly, benefiting producers with advanced platforms, while regions with limited infrastructure development may continue to support conventional buses for longer, offering incumbents some stability.

Over the forecast period, share gains are expected for companies that focus on innovation, adaptability, and compliance with stricter operational requirements, whereas supplier’s resistant to change may see gradual erosion despite the steady growth of the overall market.

The market is shaped by several related industries. Airport authorities and operators represent around 39%, as procurement of apron buses is directly tied to terminal expansion and passenger flow management. Bus and coach manufacturers contribute approximately 26%, producing low-floor, high-capacity, and electric variants tailored for airport use.

Ground handling service providers account for nearly 16%, deploying buses for passenger transfer and crew movement. Electric drivetrain and battery suppliers hold close to 11%, supporting the transition to zero-emission fleets. Maintenance and aftermarket service providers make up the remaining 8%, ensuring reliability, upgrades, and lifecycle efficiency.

The airport bus industry is transitioning toward electric and hybrid fleets in line with global airport modernization. More than 25% of new apron bus deliveries in 2024 were battery-electric models, reflecting growing adoption of sustainable transport solutions. High-capacity buses with seating for over 100 passengers are in demand at large international hubs to reduce transfer times.

Digital fleet management systems are being deployed, cutting operational delays by 10-12% through optimized scheduling and real-time monitoring. Retrofit programs for diesel-to-electric conversions are expanding, particularly in Europe and Asia. Airports are also piloting autonomous apron buses to improve efficiency and minimize ground traffic congestion.

Top Airport Bus Market Dynamics

Demand is being shaped by higher passenger throughput, which is expected to exceed 10 billion travelers annually by 2035, creating a need for efficient and flexible airport ground mobility solutions. Asia Pacific leads the market, supported by rapid airport expansions in China and India, while Europe and North America are advancing adoption of electric and hybrid buses to align with sustainability targets. Airport operators are investing in both high-capacity articulated buses and luxury transfer buses to enhance connectivity between terminals, parking zones, and aircraft stands.

Driving Force Expansion of Global Air Traffic and Airports

Growing passenger volumes and airport expansion are fueling demand for specialized buses designed for airside operations. Larger airports with multiple runways and terminals require extensive fleets to reduce turnaround times and manage passenger flows efficiently. Government funding for aviation infrastructure is also encouraging procurement of modern fleets with improved safety and accessibility features. From my perspective, as airlines add more routes and airports expand capacity, the reliance on dedicated airport buses will become more critical to seamless ground operations.

  • Asia Pacific records the highest new fleet orders due to large-scale expansions
  • Global airport investment in infrastructure projected to exceed USD 1 trillion by 2035
  • Shuttle buses contribute nearly 60% of airport bus demand globally

Growth Opportunity Adoption of Electric and Hybrid Buses

The shift toward sustainable ground operations are opening opportunities for electric and hybrid buses in airports. These buses reduce carbon emissions and improve cost efficiency for operators managing high-frequency services. Airports in Europe and Asia are introducing pilot projects for fully electric fleets, while hybrid buses offer transitional solutions for facilities with limited charging infrastructure. I believe suppliers providing scalable solutions tailored to airport operations will secure long-term contracts as green mobility becomes a strategic priority for global aviation hubs.

  • Europe expected to deploy over 4,500 electric airport buses by 2035
  • Hybrid buses estimated to save 20 million liters of fuel annually by 2035
  • Electric buses predicted to lower airport operating emissions by 18%

Emerging Trend Digital Fleet Management and Automation

Digitalization and automation are shaping future airport bus operations. Fleet management platforms now enable predictive scheduling, reducing passenger wait times and optimizing fuel use. Autonomous driving systems are being tested for fixed-route airport transfers, ensuring efficiency during peak hours. IoT-based monitoring of vehicle performance is allowing operators to minimize downtime and extend asset life cycles. In my opinion, airports adopting automation and digital fleet tracking will experience lower operating costs and improved service quality for passengers.

  • Asia Pacific expected to implement over 30% of new airport bus fleets with IoT features
  • Autonomous trials in European airports show efficiency gains of up to 12%
  • Predictive scheduling software reduces idle time by nearly 20%

Market Challenge High Costs and Infrastructure Limitations

Airport bus procurement faces challenges due to high upfront investment and limited infrastructure for new technologies. Electric buses cost substantially more than diesel alternatives, which restricts adoption at smaller airports. Charging and maintenance infrastructure is also underdeveloped in emerging markets, slowing transition to green fleets. Operational disruptions during fleet upgrades pose further concerns. In my view, collaboration between airports, governments, and technology providers will be vital to overcome these barriers and ensure sustainable deployment.

  • Electric airport buses are priced 25-35% higher than conventional models
  • Infrastructure costs for charging can reach USD 200,000 per station
  • Smaller airports account for less than 10% of electric bus adoption globally

Analyzing Airport Shuttle Bus Market by Top Segments

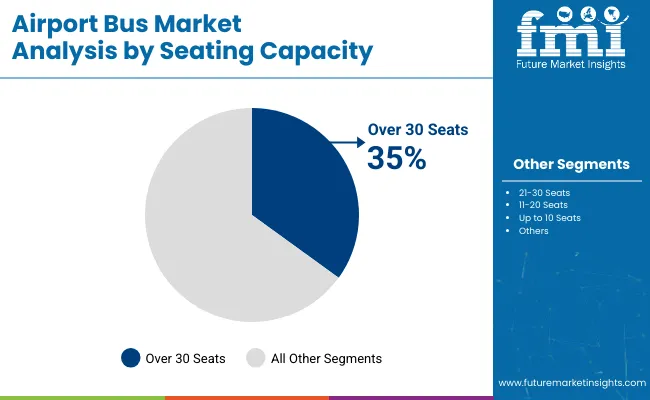
The airport shuttle bus market is shaped by vehicle size, seating capacity, propulsion preference, and application alignment. Standard buses account for 40% due to their dominance on terminal-to-parking links. Over 30-seat configurations lead capacity with 35% share, reflecting efficiency in high-traffic corridors.

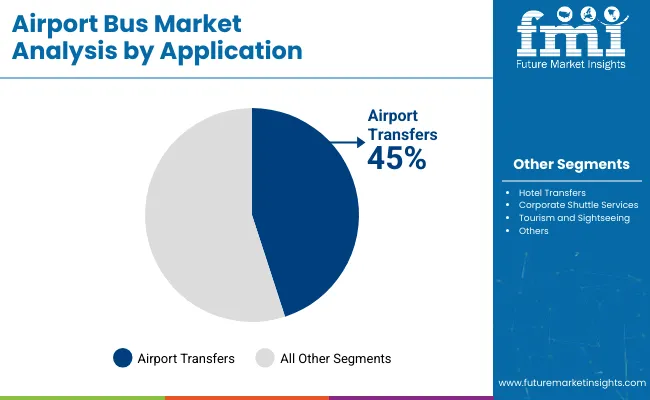
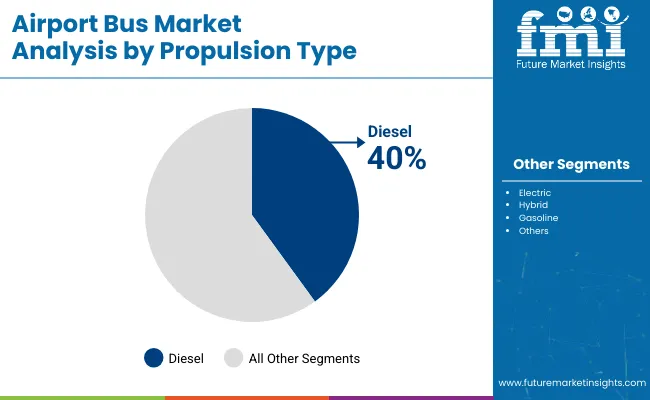
Airport transfers dominate applications at 45%, driven by predictable demand surges aligned with flight schedules. Diesel propulsion holds 40% share, though electric at 30% is expanding in replacement cycles. Fleet managers prioritize lifecycle cost, turnaround efficiency, and reliability under variable passenger throughput.
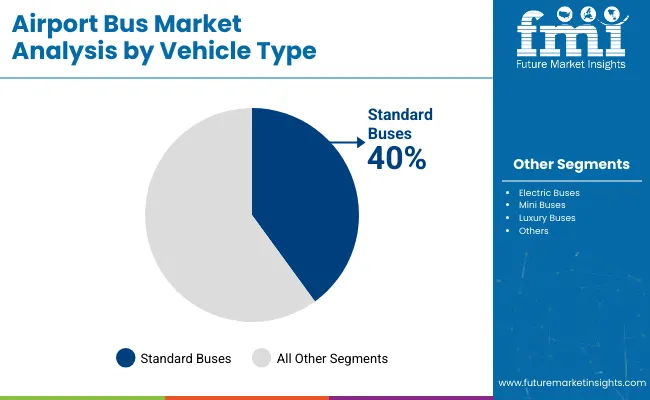
Standard Buses Lead Vehicle Type Mix in 2025

Airport Bus Market By Vehicle Type

Standard buses represent 40% of the market, reflecting their deployment on primary airport corridors such as terminal connections, parking loops, and remote stand access. These vehicles are often 12-meter platforms capable of handling more than 80 passengers per trip, with layouts combining seated and standing areas. Their higher floor strength accommodates luggage racks and integrated air-conditioning systems designed for continuous operation. While electric buses are growing at 30%, standard diesel and hybrid variants remain the core for long shifts. Maintenance teams benefit from common drivetrains, enabling higher fleet utilization.
  • Standard buses handle more than 80 passengers per full load.
  • 12-meter formats balance luggage space with boarding efficiency rates.
  • Parts interchangeability keeps average vehicle downtime below 6%.

Over 30 Seats Drive Seating Capacity Choices in 2025

Airport Bus Market By Seating Capacity

Over 30-seat buses command 35% share, meeting the needs of airports managing high-volume flows between terminals, car parks, and airside locations. Larger seating formats reduce dispatch frequency while supporting standees, achieving throughput of 100+ passengers per trip. This lowers driver hours and increases rotation efficiency compared to smaller units. Airports with seasonal peaks rely on these buses to prevent congestion at arrival gates. Medium-capacity formats (21-30 seats, 25% share) support hotel and corporate shuttle services but lack the surge absorption capacity of larger buses during high-traffic hours.
  • Large-seat buses reduce average trip frequency by 20% per route.
  • Throughput of 100+ passengers per journey reduces queuing times.
  • Seasonal peaks increase deployment of high-capacity buses by 15%.

Airport Transfers Anchor Demand by Application in 2025

Airport Bus Market By Application

Airport transfers dominate with 45% share, as terminals, car parks, and remote stands require constant shuttle circulation. Peak scheduling aligns with flight banks, requiring rapid boarding and turnaround efficiency. High-frequency airport transfer buses typically average 8-10 loops per hour, depending on distance. Dispatchers rely on these services to stabilize curbside congestion and maintain passenger flow. Hotel transfers hold 25% share but operate at lower frequencies, while corporate services and tourism remain secondary. Investments prioritize transfer corridors due to direct impact on terminal dwell times and passenger satisfaction levels.
  • Transfer buses complete up to 10 loops per peak hour.
  • Dedicated terminal loops reduce curbside congestion by nearly 30%.
  • Passenger flow stability increases on-time performance by 18% annually.

Diesel Propulsion Leads Current Operations by Propulsion in 2025

Airport Bus Market By Propulsion Type

Diesel buses lead with 40% share, reflecting legacy fleets and the presence of established fueling infrastructure at airports. Diesel vehicles typically cover long shifts of 300-350 km daily, with minimal downtime for refueling. Their torque characteristics ensure performance under heavy luggage loads and extended idling at curbs. Electric propulsion at 30% is gaining adoption, driven by tenders for new fleets, though limited charging infrastructure constrains overnight scaling. Hybrid and gasoline buses fill niche roles but are not yet competitive with diesel’s established cost-to-range balance in airport operations.
  • Diesel buses maintain daily operational range of 300-350 kilometers.
  • Idling capability supports continuous curbside dwell without power loss.
  • Established refueling lowers vehicle turnaround to under 12 minutes.

Top Countries Expanding, Producing, and Operating in the Airport Bus Market

Airport Bus Market Country Wise Analysis

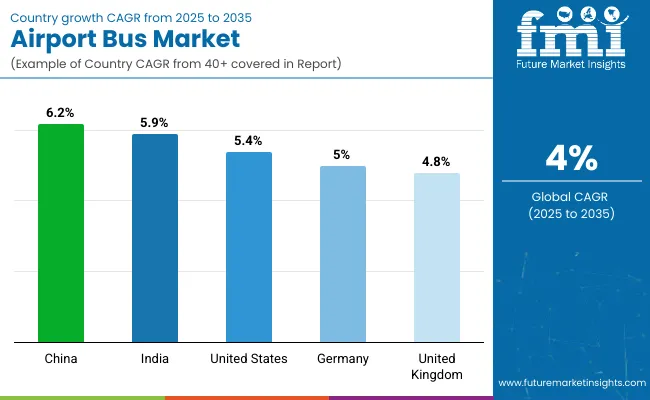
The airport bus market is set to grow steadily between 2025 and 2035, supported by rising passenger traffic, fleet modernization, and investments in airport infrastructure. China leads with a CAGR of 6.2%, outperforming the global average of 4% by +55%, driven by BRICS-led expansion of international airports and the adoption of energy-efficient bus fleets.

India follows at 5.9%, +48% above the global benchmark, supported by rapid growth in domestic aviation and government-backed programs to enhance ground transport systems. The United States records 5.4%, +35% above the global CAGR, reflecting OECD-focused investments in fleet electrification and passenger transfer efficiency.

Germany posts 5.0%, +25% over the global rate, shaped by gradual modernization of ground handling operations. The United Kingdom stands at 4.8%, +20% above global growth, reflecting selective adoption of low-emission buses and modernization of regional airports. BRICS economies are fueling demand through scale, while OECD nations emphasize sustainability, technology adoption, and operational efficiency.

Airport Bus Market Outlook in China

The airport bus industry in China is forecasted to expand at a CAGR of 6.2%, which is above the global average of 4%. Expansion is linked to construction of new airports under the Civil Aviation Administration of China, as well as rising passenger movement at major hubs like Beijing Capital and Shanghai Pudong. Yutong and BYD dominate with deliveries of low-emission apron buses. Airport modernization programs and the shift toward electric fleets strengthen demand. The relatively high CAGR is explained by large infrastructure investment and domestic manufacturing capacity.

  • Yutong delivered more than 300 apron buses to regional airports last year
  • Electric apron fleets at Shanghai Pudong reduce operating emissions by over 30%
  • China Southern Airlines’ base expansion triggers higher procurement of airside buses

Airport Bus Market Growth in India

The demand of airport bus in India is set to grow at a CAGR of 5.9%, supported by rising passenger throughput at hubs such as Delhi, Mumbai, and Bangalore. State-owned airports and private operators are investing in apron buses to improve connectivity between terminals and aircraft stands. Tata Motors and Ashok Leyland have introduced low-floor and CNG-based buses, aligning with energy efficiency goals. The market benefits from airport privatization and new terminal developments. The CAGR reflects steady adoption driven by higher passenger volumes and modernization projects across both metro and regional airports.

  • Tata Motors supplied apron buses for new terminals in Bangalore and Delhi
  • CNG-powered fleets at Mumbai airport reduce fuel costs by around 18%
  • Privatization of airports under Adani Group accelerates apron bus procurement

Airport Bus Market Dynamics in the United States

The United States airport bus market is anticipated to register a CAGR of 5.4%, reflecting steady demand from major hubs like Atlanta, Chicago O’Hare, and Dallas Fort Worth. Airport authorities are upgrading fleets with ADA-compliant low-floor buses and investing in electric apron vehicles. Gillig and New Flyer lead in deliveries, while federal funding through FAA modernization programs supports procurement. Passenger mobility requirements at large airports sustain demand, and electric bus integration aligns with long-term fleet replacement cycles. The CAGR captures steady adoption focused on accessibility and electrification.

  • Gillig delivered over 150 low-floor buses for US airport operations last year
  • FAA funding allocated USD 250 million for airside mobility infrastructure upgrades
  • Dallas Fort Worth introduced electric apron buses cutting annual fuel use by 25%

Airport Bus Market Trends in Germany

The airport bus market in Germany is projected to expand at a CAGR of 5.0%, backed by major airports such as Frankfurt, Munich, and Berlin Brandenburg. Daimler and MAN dominate apron bus supply, with models emphasizing durability and integration with automated docking systems. Investment in modern apron logistics under Fraport AG drives demand for advanced buses with passenger information systems. The CAGR reflects incremental adoption focused on modernization rather than large-scale fleet growth, driven by Europe’s high standards for passenger service and emissions reduction.

  • Daimler supplied over 100 apron buses for Munich and Frankfurt airport fleets
  • Automated docking integration improves passenger transfer efficiency by nearly 12%
  • Berlin Brandenburg expanded its apron fleet capacity with MAN low-emission buses

Airport Bus Market Outlook in the United Kingdom

The United Kingdom airport bus market is expected to grow at a CAGR of 4.8%, supported by upgrades at Heathrow, Gatwick, and Manchester airports. The market is driven by investments in fleet electrification and expansion of inter-terminal connectivity solutions. Companies like Wrightbus and Alexander Dennis supply low-emission and electric apron buses. The focus is on efficiency, passenger comfort, and reduced turnaround times. The CAGR reflects steady growth, influenced by infrastructure upgrades and replacement of older fleets with electric and hybrid vehicles.
  • Wrightbus delivered electric apron buses for Heathrow’s new fleet program
  • Gatwick upgraded passenger transfer efficiency with expanded bus fleet by 15%
  • Alexander Dennis deployed hybrid apron buses to Manchester airport operations

Leading Airport Bus Manufacturers, Suppliers, Distributors

Airport Bus Market By Company

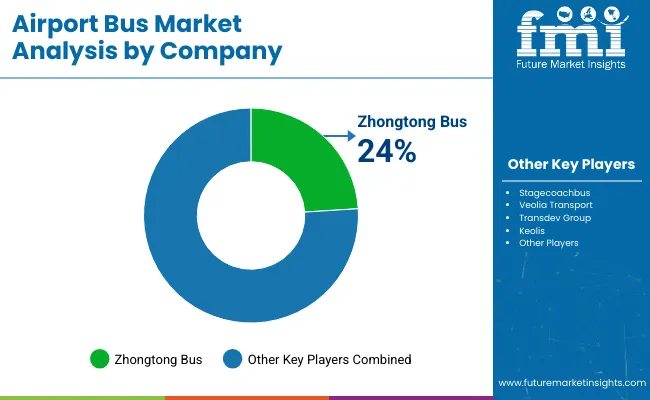
The airport bus market is driven by manufacturers and operators providing passenger transfer solutions for airports worldwide, focusing on efficiency, safety, and reliability. Zhongtong Bus is assumed to be the market leader, supported by a strong product line of low-floor and electric airport buses tailored for large passenger volumes.

Stagecoachbus and Veolia Transport maintain competitive positions through integrated transport services and fleet modernization programs aligned with airport infrastructure requirements. Transdev Group and Keolis strengthen their market presence with regional expansion strategies, focusing on optimizing passenger flow between terminals, parking areas, and aircraft stands.

Strategies across these companies are centered on delivering high-capacity, low-maintenance buses, improving passenger comfort, and aligning with airport operators to ensure smooth operations under time-critical conditions. Partnerships with airports and local authorities are being leveraged to secure long-term service contracts and enhance reliability across regional and international hubs.

Product brochures highlight low-floor airport buses, articulated passenger transfer vehicles, customizable seating layouts, luggage space optimization, and advanced air-conditioning systems. Safety features such as anti-lock braking, electronic stability control, and advanced driver assistance systems are emphasized.

Modular designs are promoted for easy customization, while extended service life and low total cost of ownership are underlined as key advantages for operators. Emphasis is placed on ease of maintenance, strong aftersales service, and adaptability to different airport sizes and operational requirements. Collectively, these companies compete on reliability, passenger handling efficiency, and integration of vehicles into wider airport logistics systems.

Leading Players

  • Zhongtong Bus
  • Stagecoachbus
  • Veolia Transport
  • Transdev Group
  • Keolis

Report Scope

Report Attributes Details
Market Size (2025) USD 2.9 billion
Projected Market Size (2035) USD 4.3 billion
CAGR (2025 to 2035) 4%
Base Year for Estimation 2024
Historical Period 2020 to 2024
Projection Period 2025 to 2035
Vehicle Type Segments Standard Buses, Mini Buses, Luxury Buses, Electric Buses
Seating Capacity Segments Up to 10 Seats, 11-20 Seats, 21-30 Seats, Over 30 Seats
Application Segments Airport Transfers, Hotel Transfers, Corporate Shuttle Services, Tourism and Sightseeing
Propulsion Type Segments Diesel, Gasoline, Electric, Hybrid
Regions Covered North America, Europe, South America, Asia Pacific, Middle East and Africa
Countries Covered United States, Canada, Brazil, Germany, United Kingdom, France, Italy, China, India, Japan, UAE, Saudi Arabia, South Africa
Leading Players Zhongtong Bus - 24%, Stagecoachbus , Veolia Transport, Transdev Group, Keolis
Additional Attributes Dollar sales by vehicle type and seating capacity, demand trends across airport transfers and tourism, adoption of electric and hybrid buses, regional fleet expansion strategies, airport infrastructure integration, environmental impact of propulsion choices, and rising role of luxury and premium buses for passenger comfort.

Airport Shuttle Bus Market Analyzed by Key Investment Segments 

By Vehicle Type

  • Standard Buses
  • Mini Buses
  • Luxury Buses
  • Electric Buses

By Seating Capacity

  • Up to 10 Seats
  • 11-20 Seats
  • 21-30 Seats
  • Over 30 Seats

By Application

  • Airport Transfers
  • Hotel Transfers
  • Corporate Shuttle Services
  • Tourism and Sightseeing

By Propulsion Type

  • Diesel
  • Gasoline
  • Electric
  • Hybrid

By Region

  • North America
  • Europe
  • South America
  • Asia Pacific
  • Middle East and Africa

Table of Content

  1. Executive Summary
    • Global Market Outlook
    • Demand-side Trends
    • Supply-side Trends
    • Technology Roadmap Analysis
    • Analysis and Recommendations
  2. Market Overview
    • Market Coverage / Taxonomy
    • Market Definition / Scope / Limitations
  3. Market Background
    • Market Dynamics
      • Drivers
      • Restraints
      • Opportunity
      • Trends
    • Scenario Forecast
      • Demand in Optimistic Scenario
      • Demand in Likely Scenario
      • Demand in Conservative Scenario
    • Opportunity Map Analysis
    • Product Life Cycle Analysis
    • Supply Chain Analysis
      • Supply Side Participants and their Roles
        • Producers
        • Mid-Level Participants (Traders/ Agents/ Brokers)
        • Wholesalers and Distributors
      • Value Added and Value Created at Node in the Supply Chain
      • List of Raw Material Suppliers
      • List of Existing and Potential Buyer’s
    • Investment Feasibility Matrix
    • Value Chain Analysis
      • Profit Margin Analysis
      • Wholesalers and Distributors
      • Retailers
    • PESTLE and Porter’s Analysis
    • Regulatory Landscape
      • By Key Regions
      • By Key Countries
    • Regional Parent Market Outlook
    • Production and Consumption Statistics
    • Import and Export Statistics
  4. Global Market Analysis 2020 to 2024 and Forecast, 2025 to 2035
    • Historical Market Size Value (USD Billion) & Volume (Thousand Units) Analysis, 2020 to 2024
    • Current and Future Market Size Value (USD Billion) & Volume (Thousand Units) Projections, 2025 to 2035
      • Y-o-Y Growth Trend Analysis
      • Absolute $ Opportunity Analysis
  5. Global Market Pricing Analysis 2020 to 2024 and Forecast 2025 to 2035
  6. Global Market Analysis 2020 to 2024 and Forecast 2025 to 2035, By Vehicle
    • Introduction / Key Findings
    • Historical Market Size Value (USD Billion) & Volume (Thousand Units) Analysis By Vehicle , 2020 to 2024
    • Current and Future Market Size Value (USD Billion) & Volume (Thousand Units) Analysis and Forecast By Vehicle , 2025 to 2035
      • Standard Buses
      • Electric Buses
      • Mini Buses
      • Luxury Buses
    • Y-o-Y Growth Trend Analysis By Vehicle , 2020 to 2024
    • Absolute $ Opportunity Analysis By Vehicle , 2025 to 2035
  7. Global Market Analysis 2020 to 2024 and Forecast 2025 to 2035, By Seating Capacity
    • Introduction / Key Findings
    • Historical Market Size Value (USD Billion) & Volume (Thousand Units) Analysis By Seating Capacity, 2020 to 2024
    • Current and Future Market Size Value (USD Billion) & Volume (Thousand Units) Analysis and Forecast By Seating Capacity, 2025 to 2035
      • Over 30 Seats
      • 21-30 Seats
      • 11 to 20 Seats
      • Up to 10 Seats
    • Y-o-Y Growth Trend Analysis By Seating Capacity, 2020 to 2024
    • Absolute $ Opportunity Analysis By Seating Capacity, 2025 to 2035
  8. Global Market Analysis 2020 to 2024 and Forecast 2025 to 2035, By Application
    • Introduction / Key Findings
    • Historical Market Size Value (USD Billion) & Volume (Thousand Units) Analysis By Application, 2020 to 2024
    • Current and Future Market Size Value (USD Billion) & Volume (Thousand Units) Analysis and Forecast By Application, 2025 to 2035
      • Airport Transfers
      • Hotel Transfers
      • Corporate Shuttle Services
      • Tourism and Sightseeing
    • Y-o-Y Growth Trend Analysis By Application, 2020 to 2024
    • Absolute $ Opportunity Analysis By Application, 2025 to 2035
  9. Global Market Analysis 2020 to 2024 and Forecast 2025 to 2035, By Propulsion
    • Introduction / Key Findings
    • Historical Market Size Value (USD Billion) & Volume (Thousand Units) Analysis By Propulsion , 2020 to 2024
    • Current and Future Market Size Value (USD Billion) & Volume (Thousand Units) Analysis and Forecast By Propulsion , 2025 to 2035
      • Diesel
      • Electric
      • Hybrid
      • Gasoline
    • Y-o-Y Growth Trend Analysis By Propulsion , 2020 to 2024
    • Absolute $ Opportunity Analysis By Propulsion , 2025 to 2035
  10. Global Market Analysis 2020 to 2024 and Forecast 2025 to 2035, By Region
    • Introduction
    • Historical Market Size Value (USD Billion) & Volume (Thousand Units) Analysis By Region, 2020 to 2024
    • Current Market Size Value (USD Billion) & Volume (Thousand Units) Analysis and Forecast By Region, 2025 to 2035
      • North America
      • Latin America
      • Western Europe
      • Eastern Europe
      • East Asia
      • South Asia & Pacific
      • Middle East and Africa
    • Market Attractiveness Analysis By Region
  11. North America Market Analysis 2020 to 2024 and Forecast 2025 to 2035, By Country
    • Historical Market Size Value (USD Billion) & Volume (Thousand Units) Trend Analysis By Market Taxonomy, 2020 to 2024
    • Market Size Value (USD Billion) & Volume (Thousand Units) Forecast By Market Taxonomy, 2025 to 2035
      • By Country
        • USA
        • Canada
        • Mexico
      • By Vehicle
      • By Seating Capacity
      • By Application
      • By Propulsion
    • Market Attractiveness Analysis
      • By Country
      • By Vehicle
      • By Seating Capacity
      • By Application
      • By Propulsion
    • Key Takeaways
  12. Latin America Market Analysis 2020 to 2024 and Forecast 2025 to 2035, By Country
    • Historical Market Size Value (USD Billion) & Volume (Thousand Units) Trend Analysis By Market Taxonomy, 2020 to 2024
    • Market Size Value (USD Billion) & Volume (Thousand Units) Forecast By Market Taxonomy, 2025 to 2035
      • By Country
        • Brazil
        • Argentina
        • Rest of LATAM
      • By Vehicle
      • By Seating Capacity
      • By Application
      • By Propulsion
    • Market Attractiveness Analysis
      • By Country
      • By Vehicle
      • By Seating Capacity
      • By Application
      • By Propulsion
    • Key Takeaways
  13. Western Europe Market Analysis 2020 to 2024 and Forecast 2025 to 2035, By Country
    • Historical Market Size Value (USD Billion) & Volume (Thousand Units) Trend Analysis By Market Taxonomy, 2020 to 2024
    • Market Size Value (USD Billion) & Volume (Thousand Units) Forecast By Market Taxonomy, 2025 to 2035
      • By Country
        • Germany
        • Italy
        • France
        • UK
        • Spain
        • BENELUX
        • Nordic
        • Rest of W.Europe
      • By Vehicle
      • By Seating Capacity
      • By Application
      • By Propulsion
    • Market Attractiveness Analysis
      • By Country
      • By Vehicle
      • By Seating Capacity
      • By Application
      • By Propulsion
    • Key Takeaways
  14. Eastern Europe Market Analysis 2020 to 2024 and Forecast 2025 to 2035, By Country
    • Historical Market Size Value (USD Billion) & Volume (Thousand Units) Trend Analysis By Market Taxonomy, 2020 to 2024
    • Market Size Value (USD Billion) & Volume (Thousand Units) Forecast By Market Taxonomy, 2025 to 2035
      • By Country
        • Russia
        • Hungary
        • Poland
        • Balkan & Baltics
        • Rest of E. Europe
      • By Vehicle
      • By Seating Capacity
      • By Application
      • By Propulsion
    • Market Attractiveness Analysis
      • By Country
      • By Vehicle
      • By Seating Capacity
      • By Application
      • By Propulsion
    • Key Takeaways
  15. East Asia Market Analysis 2020 to 2024 and Forecast 2025 to 2035, By Country
    • Historical Market Size Value (USD Billion) & Volume (Thousand Units) Trend Analysis By Market Taxonomy, 2020 to 2024
    • Market Size Value (USD Billion) & Volume (Thousand Units) Forecast By Market Taxonomy, 2025 to 2035
      • By Country
        • China
        • Japan
        • South Korea
      • By Vehicle
      • By Seating Capacity
      • By Application
      • By Propulsion
    • Market Attractiveness Analysis
      • By Country
      • By Vehicle
      • By Seating Capacity
      • By Application
      • By Propulsion
    • Key Takeaways
  16. South Asia & Pacific Market Analysis 2020 to 2024 and Forecast 2025 to 2035, By Country
    • Historical Market Size Value (USD Billion) & Volume (Thousand Units) Trend Analysis By Market Taxonomy, 2020 to 2024
    • Market Size Value (USD Billion) & Volume (Thousand Units) Forecast By Market Taxonomy, 2025 to 2035
      • By Country
        • India
        • Australia & New Zealand
        • ASEAN
        • Rest of SAP
      • By Vehicle
      • By Seating Capacity
      • By Application
      • By Propulsion
    • Market Attractiveness Analysis
      • By Country
      • By Vehicle
      • By Seating Capacity
      • By Application
      • By Propulsion
    • Key Takeaways
  17. Middle East and Africa Market Analysis 2020 to 2024 and Forecast 2025 to 2035, By Country
    • Historical Market Size Value (USD Billion) & Volume (Thousand Units) Trend Analysis By Market Taxonomy, 2020 to 2024
    • Market Size Value (USD Billion) & Volume (Thousand Units) Forecast By Market Taxonomy, 2025 to 2035
      • By Country
        • GCC Countries
        • Northern Africa
        • South Africa
        • Turkiye
        • Rest of MEA
      • By Vehicle
      • By Seating Capacity
      • By Application
      • By Propulsion
    • Market Attractiveness Analysis
      • By Country
      • By Vehicle
      • By Seating Capacity
      • By Application
      • By Propulsion
    • Key Takeaways
  18. Key Countries Market Analysis
    • USA
      • Pricing Analysis
      • Market Share Analysis, 2024
        • By Vehicle
        • By Seating Capacity
        • By Application
        • By Propulsion
    • Canada
      • Pricing Analysis
      • Market Share Analysis, 2024
        • By Vehicle
        • By Seating Capacity
        • By Application
        • By Propulsion
    • Brazil
      • Pricing Analysis
      • Market Share Analysis, 2024
        • By Vehicle
        • By Seating Capacity
        • By Application
        • By Propulsion
    • Mexico
      • Pricing Analysis
      • Market Share Analysis, 2024
        • By Vehicle
        • By Seating Capacity
        • By Application
        • By Propulsion
    • Argentina
      • Pricing Analysis
      • Market Share Analysis, 2024
        • By Vehicle
        • By Seating Capacity
        • By Application
        • By Propulsion
  19. Market Structure Analysis
    • Competition Dashboard
    • Competition Benchmarking
    • Market Share Analysis of Top Players
      • By Regional
      • By Vehicle
      • By Seating Capacity
      • By Application
      • By Propulsion
  20. Competition Analysis
    • Competition Deep Dive
      • Zhongtong Bus
        • Overview
        • Product Portfolio
        • Profitability by Market Segments (Product/Age /Sales Channel/Region)
        • Sales Footprint
        • Strategy Overview
          • Marketing Strategy
          • Product Strategy
          • Channel Strategy
      • Keolis
        • Overview
        • Product Portfolio
        • Profitability by Market Segments (Product/Age /Sales Channel/Region)
        • Sales Footprint
        • Strategy Overview
          • Marketing Strategy
          • Product Strategy
          • Channel Strategy
      • Stagecoachbus
        • Overview
        • Product Portfolio
        • Profitability by Market Segments (Product/Age /Sales Channel/Region)
        • Sales Footprint
        • Strategy Overview
          • Marketing Strategy
          • Product Strategy
          • Channel Strategy
      • Transdev Group
        • Overview
        • Product Portfolio
        • Profitability by Market Segments (Product/Age /Sales Channel/Region)
        • Sales Footprint
        • Strategy Overview
          • Marketing Strategy
          • Product Strategy
          • Channel Strategy
      • Veolia Transport
        • Overview
        • Product Portfolio
        • Profitability by Market Segments (Product/Age /Sales Channel/Region)
        • Sales Footprint
        • Strategy Overview
          • Marketing Strategy
          • Product Strategy
          • Channel Strategy
  21. Assumptions & Acronyms Used
  22. Research Methodology

List of Tables

  • Table 1: Global Market Value (USD Billion) Forecast by Region, 2020-2035
  • Table 2: Global Market Volume (Thousand Units) Forecast by Region, 2020-2035
  • Table 3: Global Market Value (USD Billion) Forecast by Vehicle , 2020-2035
  • Table 4: Global Market Volume (Thousand Units) Forecast by Vehicle , 2020-2035
  • Table 5: Global Market Value (USD Billion) Forecast by Seating Capacity, 2020-2035
  • Table 6: Global Market Volume (Thousand Units) Forecast by Seating Capacity, 2020-2035
  • Table 7: Global Market Value (USD Billion) Forecast by Application, 2020-2035
  • Table 8: Global Market Volume (Thousand Units) Forecast by Application, 2020-2035
  • Table 9: Global Market Value (USD Billion) Forecast by Propulsion , 2020-2035
  • Table 10: Global Market Volume (Thousand Units) Forecast by Propulsion , 2020-2035
  • Table 11: North America Market Value (USD Billion) Forecast by Country, 2020-2035
  • Table 12: North America Market Volume (Thousand Units) Forecast by Country, 2020-2035
  • Table 13: North America Market Value (USD Billion) Forecast by Vehicle , 2020-2035
  • Table 14: North America Market Volume (Thousand Units) Forecast by Vehicle , 2020-2035
  • Table 15: North America Market Value (USD Billion) Forecast by Seating Capacity, 2020-2035
  • Table 16: North America Market Volume (Thousand Units) Forecast by Seating Capacity, 2020-2035
  • Table 17: North America Market Value (USD Billion) Forecast by Application, 2020-2035
  • Table 18: North America Market Volume (Thousand Units) Forecast by Application, 2020-2035
  • Table 19: North America Market Value (USD Billion) Forecast by Propulsion , 2020-2035
  • Table 20: North America Market Volume (Thousand Units) Forecast by Propulsion , 2020-2035
  • Table 21: Latin America Market Value (USD Billion) Forecast by Country, 2020-2035
  • Table 22: Latin America Market Volume (Thousand Units) Forecast by Country, 2020-2035
  • Table 23: Latin America Market Value (USD Billion) Forecast by Vehicle , 2020-2035
  • Table 24: Latin America Market Volume (Thousand Units) Forecast by Vehicle , 2020-2035
  • Table 25: Latin America Market Value (USD Billion) Forecast by Seating Capacity, 2020-2035
  • Table 26: Latin America Market Volume (Thousand Units) Forecast by Seating Capacity, 2020-2035
  • Table 27: Latin America Market Value (USD Billion) Forecast by Application, 2020-2035
  • Table 28: Latin America Market Volume (Thousand Units) Forecast by Application, 2020-2035
  • Table 29: Latin America Market Value (USD Billion) Forecast by Propulsion , 2020-2035
  • Table 30: Latin America Market Volume (Thousand Units) Forecast by Propulsion , 2020-2035
  • Table 31: Western Europe Market Value (USD Billion) Forecast by Country, 2020-2035
  • Table 32: Western Europe Market Volume (Thousand Units) Forecast by Country, 2020-2035
  • Table 33: Western Europe Market Value (USD Billion) Forecast by Vehicle , 2020-2035
  • Table 34: Western Europe Market Volume (Thousand Units) Forecast by Vehicle , 2020-2035
  • Table 35: Western Europe Market Value (USD Billion) Forecast by Seating Capacity, 2020-2035
  • Table 36: Western Europe Market Volume (Thousand Units) Forecast by Seating Capacity, 2020-2035
  • Table 37: Western Europe Market Value (USD Billion) Forecast by Application, 2020-2035
  • Table 38: Western Europe Market Volume (Thousand Units) Forecast by Application, 2020-2035
  • Table 39: Western Europe Market Value (USD Billion) Forecast by Propulsion , 2020-2035
  • Table 40: Western Europe Market Volume (Thousand Units) Forecast by Propulsion , 2020-2035
  • Table 41: Eastern Europe Market Value (USD Billion) Forecast by Country, 2020-2035
  • Table 42: Eastern Europe Market Volume (Thousand Units) Forecast by Country, 2020-2035
  • Table 43: Eastern Europe Market Value (USD Billion) Forecast by Vehicle , 2020-2035
  • Table 44: Eastern Europe Market Volume (Thousand Units) Forecast by Vehicle , 2020-2035
  • Table 45: Eastern Europe Market Value (USD Billion) Forecast by Seating Capacity, 2020-2035
  • Table 46: Eastern Europe Market Volume (Thousand Units) Forecast by Seating Capacity, 2020-2035
  • Table 47: Eastern Europe Market Value (USD Billion) Forecast by Application, 2020-2035
  • Table 48: Eastern Europe Market Volume (Thousand Units) Forecast by Application, 2020-2035
  • Table 49: Eastern Europe Market Value (USD Billion) Forecast by Propulsion , 2020-2035
  • Table 50: Eastern Europe Market Volume (Thousand Units) Forecast by Propulsion , 2020-2035
  • Table 51: East Asia Market Value (USD Billion) Forecast by Country, 2020-2035
  • Table 52: East Asia Market Volume (Thousand Units) Forecast by Country, 2020-2035
  • Table 53: East Asia Market Value (USD Billion) Forecast by Vehicle , 2020-2035
  • Table 54: East Asia Market Volume (Thousand Units) Forecast by Vehicle , 2020-2035
  • Table 55: East Asia Market Value (USD Billion) Forecast by Seating Capacity, 2020-2035
  • Table 56: East Asia Market Volume (Thousand Units) Forecast by Seating Capacity, 2020-2035
  • Table 57: East Asia Market Value (USD Billion) Forecast by Application, 2020-2035
  • Table 58: East Asia Market Volume (Thousand Units) Forecast by Application, 2020-2035
  • Table 59: East Asia Market Value (USD Billion) Forecast by Propulsion , 2020-2035
  • Table 60: East Asia Market Volume (Thousand Units) Forecast by Propulsion , 2020-2035
  • Table 61: South Asia & Pacific Market Value (USD Billion) Forecast by Country, 2020-2035
  • Table 62: South Asia & Pacific Market Volume (Thousand Units) Forecast by Country, 2020-2035
  • Table 63: South Asia & Pacific Market Value (USD Billion) Forecast by Vehicle , 2020-2035
  • Table 64: South Asia & Pacific Market Volume (Thousand Units) Forecast by Vehicle , 2020-2035
  • Table 65: South Asia & Pacific Market Value (USD Billion) Forecast by Seating Capacity, 2020-2035
  • Table 66: South Asia & Pacific Market Volume (Thousand Units) Forecast by Seating Capacity, 2020-2035
  • Table 67: South Asia & Pacific Market Value (USD Billion) Forecast by Application, 2020-2035
  • Table 68: South Asia & Pacific Market Volume (Thousand Units) Forecast by Application, 2020-2035
  • Table 69: South Asia & Pacific Market Value (USD Billion) Forecast by Propulsion , 2020-2035
  • Table 70: South Asia & Pacific Market Volume (Thousand Units) Forecast by Propulsion , 2020-2035
  • Table 71: Middle East and Africa Market Value (USD Billion) Forecast by Country, 2020-2035
  • Table 72: Middle East and Africa Market Volume (Thousand Units) Forecast by Country, 2020-2035
  • Table 73: Middle East and Africa Market Value (USD Billion) Forecast by Vehicle , 2020-2035
  • Table 74: Middle East and Africa Market Volume (Thousand Units) Forecast by Vehicle , 2020-2035
  • Table 75: Middle East and Africa Market Value (USD Billion) Forecast by Seating Capacity, 2020-2035
  • Table 76: Middle East and Africa Market Volume (Thousand Units) Forecast by Seating Capacity, 2020-2035
  • Table 77: Middle East and Africa Market Value (USD Billion) Forecast by Application, 2020-2035
  • Table 78: Middle East and Africa Market Volume (Thousand Units) Forecast by Application, 2020-2035
  • Table 79: Middle East and Africa Market Value (USD Billion) Forecast by Propulsion , 2020-2035
  • Table 80: Middle East and Africa Market Volume (Thousand Units) Forecast by Propulsion , 2020-2035

List of Figures

  • Figure 1: Global Market Volume (Thousand Units) Forecast 2020-2035
  • Figure 2: Global Market Pricing Analysis
  • Figure 3: Global Market Value (USD Billion) Forecast 2020-2035
  • Figure 4: Global Market Value Share and BPS Analysis by Vehicle , 2025 and 2035
  • Figure 5: Global Market Y-o-Y Growth Comparison by Vehicle , 2025-2035
  • Figure 6: Global Market Attractiveness Analysis by Vehicle
  • Figure 7: Global Market Value Share and BPS Analysis by Seating Capacity, 2025 and 2035
  • Figure 8: Global Market Y-o-Y Growth Comparison by Seating Capacity, 2025-2035
  • Figure 9: Global Market Attractiveness Analysis by Seating Capacity
  • Figure 10: Global Market Value Share and BPS Analysis by Application, 2025 and 2035
  • Figure 11: Global Market Y-o-Y Growth Comparison by Application, 2025-2035
  • Figure 12: Global Market Attractiveness Analysis by Application
  • Figure 13: Global Market Value Share and BPS Analysis by Propulsion , 2025 and 2035
  • Figure 14: Global Market Y-o-Y Growth Comparison by Propulsion , 2025-2035
  • Figure 15: Global Market Attractiveness Analysis by Propulsion
  • Figure 16: Global Market Value (USD Billion) Share and BPS Analysis by Region, 2025 and 2035
  • Figure 17: Global Market Y-o-Y Growth Comparison by Region, 2025-2035
  • Figure 18: Global Market Attractiveness Analysis by Region
  • Figure 19: North America Market Incremental $ Opportunity, 2025-2035
  • Figure 20: Latin America Market Incremental $ Opportunity, 2025-2035
  • Figure 21: Western Europe Market Incremental $ Opportunity, 2025-2035
  • Figure 22: Eastern Europe Market Incremental $ Opportunity, 2025-2035
  • Figure 23: East Asia Market Incremental $ Opportunity, 2025-2035
  • Figure 24: South Asia & Pacific Market Incremental $ Opportunity, 2025-2035
  • Figure 25: Middle East and Africa Market Incremental $ Opportunity, 2025-2035
  • Figure 26: North America Market Value Share and BPS Analysis by Country, 2025 and 2035
  • Figure 27: North America Market Value Share and BPS Analysis by Vehicle , 2025 and 2035
  • Figure 28: North America Market Y-o-Y Growth Comparison by Vehicle , 2025-2035
  • Figure 29: North America Market Attractiveness Analysis by Vehicle
  • Figure 30: North America Market Value Share and BPS Analysis by Seating Capacity, 2025 and 2035
  • Figure 31: North America Market Y-o-Y Growth Comparison by Seating Capacity, 2025-2035
  • Figure 32: North America Market Attractiveness Analysis by Seating Capacity
  • Figure 33: North America Market Value Share and BPS Analysis by Application, 2025 and 2035
  • Figure 34: North America Market Y-o-Y Growth Comparison by Application, 2025-2035
  • Figure 35: North America Market Attractiveness Analysis by Application
  • Figure 36: North America Market Value Share and BPS Analysis by Propulsion , 2025 and 2035
  • Figure 37: North America Market Y-o-Y Growth Comparison by Propulsion , 2025-2035
  • Figure 38: North America Market Attractiveness Analysis by Propulsion
  • Figure 39: Latin America Market Value Share and BPS Analysis by Country, 2025 and 2035
  • Figure 40: Latin America Market Value Share and BPS Analysis by Vehicle , 2025 and 2035
  • Figure 41: Latin America Market Y-o-Y Growth Comparison by Vehicle , 2025-2035
  • Figure 42: Latin America Market Attractiveness Analysis by Vehicle
  • Figure 43: Latin America Market Value Share and BPS Analysis by Seating Capacity, 2025 and 2035
  • Figure 44: Latin America Market Y-o-Y Growth Comparison by Seating Capacity, 2025-2035
  • Figure 45: Latin America Market Attractiveness Analysis by Seating Capacity
  • Figure 46: Latin America Market Value Share and BPS Analysis by Application, 2025 and 2035
  • Figure 47: Latin America Market Y-o-Y Growth Comparison by Application, 2025-2035
  • Figure 48: Latin America Market Attractiveness Analysis by Application
  • Figure 49: Latin America Market Value Share and BPS Analysis by Propulsion , 2025 and 2035
  • Figure 50: Latin America Market Y-o-Y Growth Comparison by Propulsion , 2025-2035
  • Figure 51: Latin America Market Attractiveness Analysis by Propulsion
  • Figure 52: Western Europe Market Value Share and BPS Analysis by Country, 2025 and 2035
  • Figure 53: Western Europe Market Value Share and BPS Analysis by Vehicle , 2025 and 2035
  • Figure 54: Western Europe Market Y-o-Y Growth Comparison by Vehicle , 2025-2035
  • Figure 55: Western Europe Market Attractiveness Analysis by Vehicle
  • Figure 56: Western Europe Market Value Share and BPS Analysis by Seating Capacity, 2025 and 2035
  • Figure 57: Western Europe Market Y-o-Y Growth Comparison by Seating Capacity, 2025-2035
  • Figure 58: Western Europe Market Attractiveness Analysis by Seating Capacity
  • Figure 59: Western Europe Market Value Share and BPS Analysis by Application, 2025 and 2035
  • Figure 60: Western Europe Market Y-o-Y Growth Comparison by Application, 2025-2035
  • Figure 61: Western Europe Market Attractiveness Analysis by Application
  • Figure 62: Western Europe Market Value Share and BPS Analysis by Propulsion , 2025 and 2035
  • Figure 63: Western Europe Market Y-o-Y Growth Comparison by Propulsion , 2025-2035
  • Figure 64: Western Europe Market Attractiveness Analysis by Propulsion
  • Figure 65: Eastern Europe Market Value Share and BPS Analysis by Country, 2025 and 2035
  • Figure 66: Eastern Europe Market Value Share and BPS Analysis by Vehicle , 2025 and 2035
  • Figure 67: Eastern Europe Market Y-o-Y Growth Comparison by Vehicle , 2025-2035
  • Figure 68: Eastern Europe Market Attractiveness Analysis by Vehicle
  • Figure 69: Eastern Europe Market Value Share and BPS Analysis by Seating Capacity, 2025 and 2035
  • Figure 70: Eastern Europe Market Y-o-Y Growth Comparison by Seating Capacity, 2025-2035
  • Figure 71: Eastern Europe Market Attractiveness Analysis by Seating Capacity
  • Figure 72: Eastern Europe Market Value Share and BPS Analysis by Application, 2025 and 2035
  • Figure 73: Eastern Europe Market Y-o-Y Growth Comparison by Application, 2025-2035
  • Figure 74: Eastern Europe Market Attractiveness Analysis by Application
  • Figure 75: Eastern Europe Market Value Share and BPS Analysis by Propulsion , 2025 and 2035
  • Figure 76: Eastern Europe Market Y-o-Y Growth Comparison by Propulsion , 2025-2035
  • Figure 77: Eastern Europe Market Attractiveness Analysis by Propulsion
  • Figure 78: East Asia Market Value Share and BPS Analysis by Country, 2025 and 2035
  • Figure 79: East Asia Market Value Share and BPS Analysis by Vehicle , 2025 and 2035
  • Figure 80: East Asia Market Y-o-Y Growth Comparison by Vehicle , 2025-2035
  • Figure 81: East Asia Market Attractiveness Analysis by Vehicle
  • Figure 82: East Asia Market Value Share and BPS Analysis by Seating Capacity, 2025 and 2035
  • Figure 83: East Asia Market Y-o-Y Growth Comparison by Seating Capacity, 2025-2035
  • Figure 84: East Asia Market Attractiveness Analysis by Seating Capacity
  • Figure 85: East Asia Market Value Share and BPS Analysis by Application, 2025 and 2035
  • Figure 86: East Asia Market Y-o-Y Growth Comparison by Application, 2025-2035
  • Figure 87: East Asia Market Attractiveness Analysis by Application
  • Figure 88: East Asia Market Value Share and BPS Analysis by Propulsion , 2025 and 2035
  • Figure 89: East Asia Market Y-o-Y Growth Comparison by Propulsion , 2025-2035
  • Figure 90: East Asia Market Attractiveness Analysis by Propulsion
  • Figure 91: South Asia & Pacific Market Value Share and BPS Analysis by Country, 2025 and 2035
  • Figure 92: South Asia & Pacific Market Value Share and BPS Analysis by Vehicle , 2025 and 2035
  • Figure 93: South Asia & Pacific Market Y-o-Y Growth Comparison by Vehicle , 2025-2035
  • Figure 94: South Asia & Pacific Market Attractiveness Analysis by Vehicle
  • Figure 95: South Asia & Pacific Market Value Share and BPS Analysis by Seating Capacity, 2025 and 2035
  • Figure 96: South Asia & Pacific Market Y-o-Y Growth Comparison by Seating Capacity, 2025-2035
  • Figure 97: South Asia & Pacific Market Attractiveness Analysis by Seating Capacity
  • Figure 98: South Asia & Pacific Market Value Share and BPS Analysis by Application, 2025 and 2035
  • Figure 99: South Asia & Pacific Market Y-o-Y Growth Comparison by Application, 2025-2035
  • Figure 100: South Asia & Pacific Market Attractiveness Analysis by Application
  • Figure 101: South Asia & Pacific Market Value Share and BPS Analysis by Propulsion , 2025 and 2035
  • Figure 102: South Asia & Pacific Market Y-o-Y Growth Comparison by Propulsion , 2025-2035
  • Figure 103: South Asia & Pacific Market Attractiveness Analysis by Propulsion
  • Figure 104: Middle East and Africa Market Value Share and BPS Analysis by Country, 2025 and 2035
  • Figure 105: Middle East and Africa Market Value Share and BPS Analysis by Vehicle , 2025 and 2035
  • Figure 106: Middle East and Africa Market Y-o-Y Growth Comparison by Vehicle , 2025-2035
  • Figure 107: Middle East and Africa Market Attractiveness Analysis by Vehicle
  • Figure 108: Middle East and Africa Market Value Share and BPS Analysis by Seating Capacity, 2025 and 2035
  • Figure 109: Middle East and Africa Market Y-o-Y Growth Comparison by Seating Capacity, 2025-2035
  • Figure 110: Middle East and Africa Market Attractiveness Analysis by Seating Capacity
  • Figure 111: Middle East and Africa Market Value Share and BPS Analysis by Application, 2025 and 2035
  • Figure 112: Middle East and Africa Market Y-o-Y Growth Comparison by Application, 2025-2035
  • Figure 113: Middle East and Africa Market Attractiveness Analysis by Application
  • Figure 114: Middle East and Africa Market Value Share and BPS Analysis by Propulsion , 2025 and 2035
  • Figure 115: Middle East and Africa Market Y-o-Y Growth Comparison by Propulsion , 2025-2035
  • Figure 116: Middle East and Africa Market Attractiveness Analysis by Propulsion
  • Figure 117: Global Market - Tier Structure Analysis
  • Figure 118: Global Market - Company Share Analysis

Frequently Asked Questions

What is the size of the airport bus market in 2025?

The airport bus market size is valued at USD 2.9 billion in 2025.

How much will the airport bus market reach by 2035?

The market is projected to reach USD 4.3 billion by 2035.

What is the CAGR of the airport bus market from 2025 to 2035?

The market is expected to grow at a CAGR of 4% during the forecast period.

Which application segment dominates the airport bus market in 2025?

Airport transfers hold the largest share at 45%.

Who are the top players in the airport bus market?

Leading players include Zhongtong Bus, Stagecoachbus, Veolia Transport, Transdev Group, and Keolis.

Explore Similar Insights

Future Market Insights

Airport Bus Market

Chat With

MaRIA

Hi There, I am MaRIA, Your Market Research Intelligence Assistant. How may I help you?