Anti-Wrinkle Creams Market Size and Share Forecast Outlook 2025 to 2035

The global Anti-Wrinkle Creams Market is anticipated to be valued at USD 18,203.8 Million in 2025 and is forecast to reach USD 37,905.2 Million by 2035, reflecting an absolute gain of USD 19,701.4 Million during the period. This expansion equates to a near doubling of market value and a CAGR of 7.6% across the forecast horizon. Growth is expected to be supported by rising adoption of evidence-based skincare routines, a greater preference for clinically validated formulations, and increased awareness of proactive anti-aging practices across mature demographics.
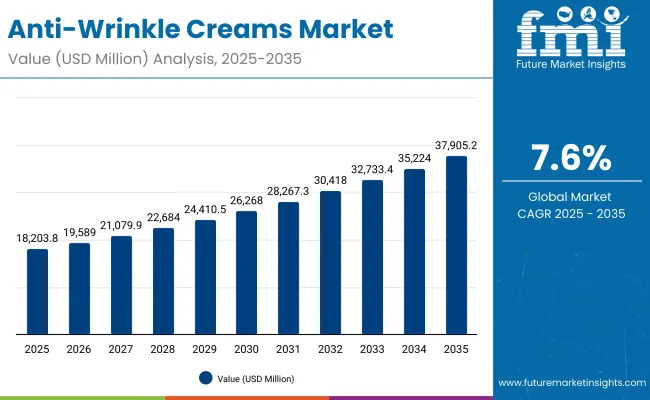
Anti Wrinkle Creams Market

Quick Stats for Anti-Wrinkle Creams Market

  • Anti-Wrinkle Creams Market Value (2025): USD 18,203.8 Million
  • Anti-Wrinkle Creams Market Forecast Value (2035): USD 37,905.2 Million
  • Anti-Wrinkle Creams Market Forecast CAGR (2025 to 2035): 7.6%
  • Leading Segment in 2025: Women 35+ (64.6%)
  • Key Growth Regions: China, India, Japan, USA, Europe
  • Top Key Players: Olay, Estée Lauder, L’Oréal Paris, Clinique, Lancôme, Shiseido, Neutrogena, SK-II, Elizabeth Arden, Kiehl’s

Anti-Wrinkle Creams Market Key Takeaways

Metric Value
Anti-Wrinkle Creams Market Estimated Value in (2025E) USD 18,203.8 Million
Anti-Wrinkle Creams Market Forecast Value in (2035F) USD 37,905.2 Million
Forecast CAGR (2025 to 2035) 7.6%

During the initial five-year span from 2025 to 2030, the market is projected to expand from USD 18,203.8 Million to USD 26,268.2 Million, contributing USD 8,064.4 Million to total growth. This phase is expected to reflect steady adoption as women aged 35+ continue to dominate usage patterns, holding 64.6% of spending in 2025, equivalent to USD 11,765.7 Million.

Clinically proven formulations are projected to account for nearly half the market, at 49.5% share in 2025, reflecting strong trust in substantiated claims. E-commerce penetration at 47.5% is also expected to anchor gains as consumers migrate toward digital channels for both convenience and access to dermatology-led assortments.

In the latter half of the decade, between 2030 and 2035, market growth is expected to accelerate by USD 11,637 Million, lifting total size from USD 26,268.2 Million to USD 37,905.2 Million. This phase is anticipated to be led by double-digit expansion in Asia, where China and India are projected to outpace mature Western markets. With clinical claim substantiation, digital-first distribution, and premiumization strategies at the forefront, the category is expected to consolidate into a high-value, evidence-driven segment by 2035.

From 2020 to 2024, the category was steadily expanded, largely influenced by premium skincare adoption and early entry of plant-based alternatives. By 2025, demand is projected to consolidate at USD 18,203.8 Million, with clinical claims and digital-first distribution establishing themselves as primary growth levers. Over the next decade, revenue is forecast to more than double, reaching USD 37,905.2 Million by 2035.

This trajectory is expected to be driven by accelerated adoption in Asia, especially China and India, where double-digit CAGRs are anticipated. Competitive dynamics are projected to remain fragmented, with the leading player accounting for only 8.1% share in 2025, reflecting intense rivalry.

Traditional leaders are expected to pivot toward clinically substantiated claims, dermatologist partnerships, and digital ecosystems, while emerging entrants are likely to compete through transparency, e-commerce penetration, and personalization strategies. By 2035, ecosystem strength, trust in clinical evidence, and ability to deliver premiumized digital journeys are expected to define the market winners.

Why the Anti-Wrinkle Creams Market is growing?

Growth in the Anti-Wrinkle Creams Market is being propelled by rising consumer awareness of preventative skincare and a strong preference for clinically validated solutions. Adoption has been supported by evidence-backed claims, dermatologist endorsements, and transparent ingredient communication, which are expected to continue building trust.

Digital commerce expansion has accelerated accessibility, while subscription models and virtual consultations have improved regimen adherence. Premiumization has been reinforced by advances in formulations such as retinoids, peptides, and plant-based alternatives that address both efficacy and sensitivity concerns.

Regional momentum is expected to remain strongest in Asia, where double-digit CAGRs in China and India highlight untapped demand potential. Increasing lifestyle stressors, higher pollution exposure, and aging demographics are anticipated to keep demand resilient. With innovation in formulation science and alignment with sensitive-skin safety, the market is projected to expand rapidly through 2035, consolidating into a high-value, evidence-driven skincare category.

Segmental Analysis

The Anti-Wrinkle Creams Market has been segmented by end user, claim, and distribution channel to capture the most influential demand patterns. The segmentation highlights how age-driven adoption, science-backed product validation, and purchasing convenience are shaping market expansion. Women above 35 years continue to represent the core consumer base, while clinically proven claims have gained prominence due to rising trust in dermatological substantiation.

E-commerce has emerged as a critical channel, reflecting digital-first purchasing behaviors and strong consumer preference for convenient access. These three segments together define the future trajectory of the market, with their relative shares expected to influence competitive strategy, product innovation, and channel investment over the coming decade.
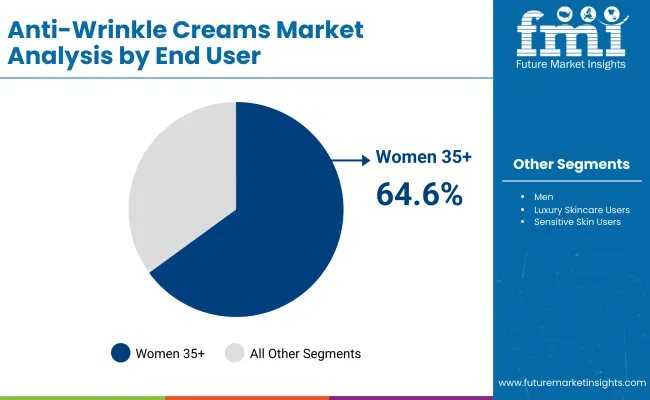
Insights into the End User Segment with Women 35+ Leading in Market Share

Anti Wrinkle Creams Market By End User

End User Market Value Share, 2025
Women 35+ 64.6%
Others 35.4%

The women 35+ segment is expected to dominate with a 64.6% share in 2025, valued at USD 11,765.7 Million. Growth in this group is being driven by heightened awareness of age-related skin concerns and greater adoption of preventative anti-aging routines. The segment’s expansion is supported by trust in clinically validated formulations and dermatologist-endorsed regimens.

Other consumer groups, including younger prevention seekers and men, are gradually increasing adoption but remain secondary in overall contribution. As brands enhance sensitivity-friendly solutions and tailor messaging for mature consumers, this segment is projected to retain its leadership throughout the forecast horizon.
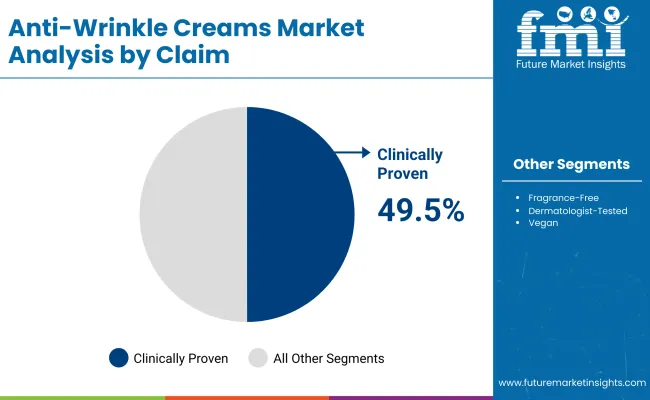
Insights into the Claim Segment with Clinically Proven Products Gaining Prominence

Anti Wrinkle Creams Market By Claim

Claim Market Value Share, 2025
Clinically proven 49.5%
Others 50.5%

Clinically proven formulations are projected to capture 49.5% share in 2025, equivalent to USD 9,008.1 Million, underscoring rising consumer reliance on evidence-based skincare. The segment’s growth is fueled by increasing demand for transparency, clinical trials, and safety certifications that validate product efficacy.

With dermatologists and regulatory authorities emphasizing proven outcomes, clinically backed offerings are expected to strengthen consumer trust and justify premium pricing. Other claims, including natural, vegan, and fragrance-free, hold marginally higher share but lack the same scale of clinical validation. Future growth is anticipated to concentrate around clinically proven claims, as data-driven communication becomes the cornerstone of competitive positioning.
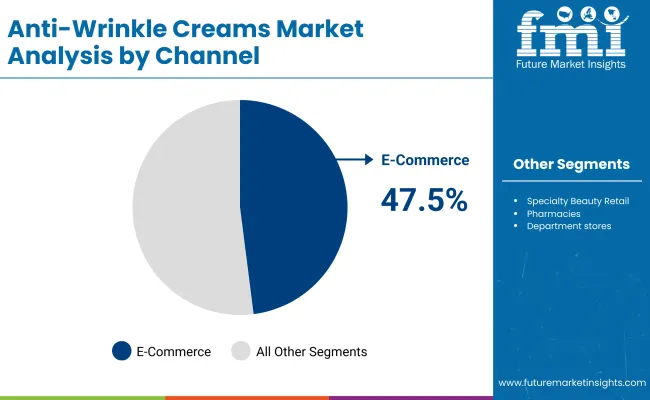
Insights into the Channel Segment with E-commerce Accelerating Growth

Anti Wrinkle Creams Market By Channel

Channel Market Value Share, 2025
E-commerce 47.5%
Others 52.5%

E-commerce is forecasted to represent 47.5% of the Anti-Wrinkle Creams Market in 2025, generating USD 8,640.4 Million in value. Growth in this channel is being accelerated by consumer preference for digital convenience, online reviews, and targeted marketing campaigns. Subscription models, virtual consultations, and personalized product recommendations are strengthening the digital path to purchase. While offline channels retain a slight majority, the momentum toward online platforms is expected to intensify over the decade. With greater integration of diagnostics, tele-dermatology, and influencer-driven education, e-commerce is projected to capture an even larger role in shaping consumer engagement and brand loyalty by 2035.

What are the Drivers, Restraints, and Key Trends of the Anti-Wrinkle Creams Market?

The Anti-Wrinkle Creams Market is shaped by scientific advancements, digital disruption, and demographic shifts, even as premium affordability and claim validation remain critical hurdles. Opportunities and risks are expected to converge around innovation credibility, regulatory standards, and digital-first consumer journeys.

Validation through Clinical Substantiation

Market growth is increasingly being reinforced by the integration of clinical trials, peer-reviewed publications, and dermatological partnerships that substantiate product efficacy. Consumers are anticipated to align purchasing decisions with brands demonstrating transparent testing protocols and verifiable outcomes.

This shift toward data-backed claims is expected to foster long-term loyalty and defend premium positioning. With regulators and consumer advocacy groups heightening scrutiny, companies that anchor innovation pipelines to evidence-based science are projected to consolidate credibility faster. Over the forecast period, clinically proven formulations are likely to capture incremental share, positioning the market as a science-driven category rather than one reliant solely on aspirational messaging.

Acceleration of Digital Dermocosmetics

A new dynamic is emerging as artificial intelligence and virtual dermatology consultations redefine the consumer journey. By 2035, anti-wrinkle creams are expected to be increasingly integrated with diagnostic apps, personalized regimens, and subscription-based services.

E-commerce ecosystems are anticipated to evolve into digital dermocosmetic platforms that analyze skin data and recommend tailored formulations in real time. This convergence of technology with skincare is projected to create recurring revenue opportunities while simultaneously lowering consumer hesitation through data-driven personalization. Companies leveraging AI-driven insights to deliver measurable progress tracking and adaptive product recommendations are likely to gain an edge, shifting competitive differentiation away from distribution reach alone toward digital trust ecosystems.
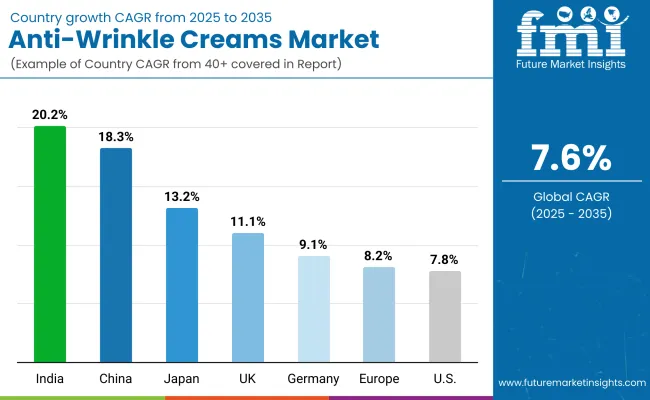
Analysis of Anti-Wrinkle Creams Market By Key Countries

Anti Wrinkle Creams Market Country Wise Analysis

Country CAGR
China 18.3%
USA 7.8%
India 20.2%
UK 11.1%
Germany 9.1%
Japan 13.2%
Europe 8.2%

The Anti-Wrinkle Creams Market is projected to demonstrate distinct growth trajectories across major economies, shaped by demographic dynamics, consumer sophistication, and digital adoption. India is anticipated to emerge as the fastest-growing market, with a 20.2% CAGR during 2025 to 2035, supported by rising urban incomes, evolving beauty routines, and accelerated online distribution. China is expected to follow closely with an 18.3% CAGR, fueled by premiumization trends, stronger regulatory oversight on product efficacy, and higher demand for clinically validated formulations. Japan’s market is forecast to grow at 13.2% CAGR, reflecting a balance between tradition-driven skincare rituals and rising acceptance of advanced anti-aging formulations.

The UK (11.1% CAGR) and Germany (9.1% CAGR) are projected to anchor Europe’s demand, with a regional average of 8.2%. Regulatory scrutiny, preference for dermatologist-tested products, and aging populations are expected to drive gradual but stable expansion across these markets. In contrast, the USA is expected to reflect maturity with a relatively moderate CAGR of 7.8%, as clinical claim credibility and premium pricing remain pivotal to sustaining growth. Collectively, Asia is projected to outperform Western markets by a wide margin, with its scale, speed of adoption, and digital-first ecosystems positioning the region as the critical growth engine for the anti-wrinkle category through 2035.
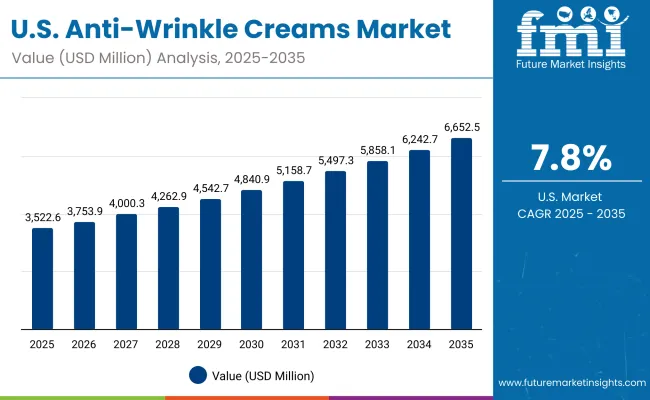
Sales Outlook for Anti-Wrinkle Creams in the United States

Usa Anti Wrinkle Creams Market

Year USA Anti-Wrinkle Creams Market (USD Million)
2025 3,522.67
2026 3,753.91
2027 4,000.32
2028 4,262.91
2029 4,542.74
2030 4,840.94
2031 5,158.71
2032 5,497.33
2033 5,858.19
2034 6,242.74
2035 6,652.52

The Anti-Wrinkle Creams Market in the United States is projected to grow at a CAGR of 7.1% from 2025 to 2035, increasing from USD 3,522.67 Million to USD 6,652.52 Million. Expansion is expected to be supported by stronger adoption of premium anti-aging formulations, heightened demand for clinically validated claims, and digital-first distribution strategies. Growing interest in dermatologist-backed regimens is anticipated to sustain product credibility, while subscription models and personalized digital consultations are projected to lift adherence rates.

  • Women aged 35+ are expected to maintain their dominant role, accounting for the majority of market spend.
  • Clinically proven claims are anticipated to secure higher traction, reinforcing consumer trust and premium positioning.
  • E-commerce platforms are projected to accelerate growth, enhancing access and driving long-term retention strategies.

Growth and Expansion Outlook for Anti-Wrinkle Creams Market in the United Kingdom

The Anti-Wrinkle Creams Market in the UK is projected to grow at a CAGR of 11.1% between 2025 and 2035, supported by a balanced mix of premium skincare adoption and sensitivity-focused innovations. Valuation is expected to rise steadily as consumers prioritize dermatology-endorsed and fragrance-free solutions. Digital engagement through online consultations and prescription-linked platforms is anticipated to deepen trust and conversion. A stable premium base is expected to support market resilience, even under economic pressures.

  • Dermatologist-tested and clinically proven claims are forecasted to gain further relevance in shaping consumer preference.
  • E-commerce penetration is projected to rise, supported by subscription models and loyalty programs.
  • Anti-aging awareness in both women and men is expected to drive broader category participation.
  • Premium heritage brands and science-driven entrants are anticipated to co-exist, each shaping unique value propositions.

Growth and Expansion Outlook for Anti-Wrinkle Creams Market in India

The Anti-Wrinkle Creams Market in India is forecasted to expand at the highest CAGR globally, reaching 20.2% from 2025 to 2035. Growth is expected to be accelerated by rising disposable incomes, increasing urbanization, and strong digital adoption in skincare purchases. Affordability combined with aspirational consumption is projected to create a dual market for both mass and premium brands. Social media and influencer-led education are anticipated to play a pivotal role in accelerating penetration among young prevention-focused cohorts.

  • Rapid e-commerce adoption is forecasted to become the strongest driver of accessibility.
  • Premiumization is expected to accelerate as higher-income urban consumers demand science-backed claims.
  • Strong growth potential is projected in tier-2 and tier-3 cities through mobile-first sales strategies.
  • Domestic and global brands are anticipated to compete aggressively, leveraging localized formulations.

Sales Outlook for Anti-Wrinkle Creams in China

The Anti-Wrinkle Creams Market in China is projected to record a CAGR of 18.3% from 2025 to 2035, positioning the country as one of the largest growth engines for the category. Expansion is anticipated to be driven by premium skincare adoption, clinical-proof demand, and digital-first purchasing behaviors. Regulatory tightening on product efficacy is expected to favor brands with transparent scientific substantiation. With livestream shopping and social commerce gaining scale, consumer education and regimen adoption are forecasted to accelerate further.
  • Clinically proven claims are projected to dominate, supported by regulatory oversight on advertising.
  • Strong growth is anticipated from digital-native platforms integrating consultations with e-commerce.
  • Urban consumers are expected to increasingly adopt subscription-based premium regimens.
  • Local brands with agile product innovation are projected to challenge global incumbents.

In-depth Analysis of Anti-Wrinkle Creams in Germany

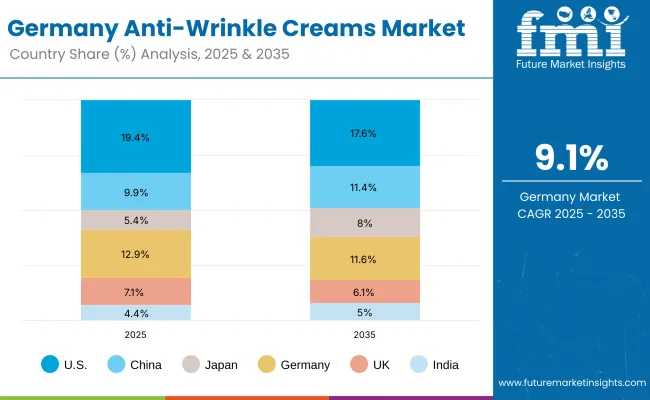
Germany Anti Wrinkle Creams Market

Country 2025
USA 19.4%
China 9.9%
Japan 5.4%
Germany 12.9%
UK 7.1%
India 4.4%
Country 2035
USA 17.6%
China 11.4%
Japan 8.0%
Germany 11.6%
UK 6.1%
India 5.0%

The Anti-Wrinkle Creams Market in Germany is forecasted to expand at a CAGR of 9.1% from 2025 to 2035, reflecting steady demand driven by aging demographics and strict quality compliance. Consumers are expected to prioritize dermatologist-tested, fragrance-free, and sensitive-skin formulations. Strong preference for clinical validation is anticipated to sustain premium segment dominance. Digital penetration is expected to grow gradually, as brick-and-mortar pharmacies and retail chains maintain their influence in distribution.
  • Clinical substantiation and dermatologist endorsements are forecasted to shape brand trust.
  • Growth in fragrance-free and sensitive-skin lines is expected to expand market breadth.
  • Hybrid channel strategies integrating online education with pharmacy-led sales are anticipated.
  • Regulatory frameworks are expected to continue reinforcing product safety and credibility.

Growth Outlook for Anti-Wrinkle Creams Market in USA

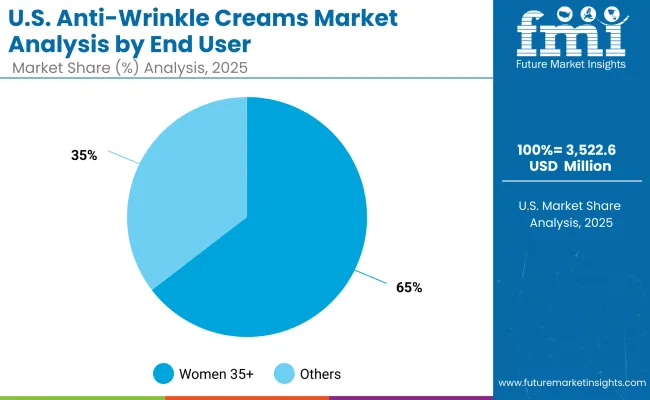
Usa Anti Wrinkle Creams Market By End User

USA by End User Market Value Share, 2025
Women 35+ 64.6%
Others 35.4%

The Anti-Wrinkle Creams Market in the United States is projected at USD 3,522.67 Million in 2025. Women aged 35+ contribute 64.6%, while other users account for 35.4%, which indicates a clear concentration of value among mature skincare consumers. This dominance is explained by the heightened need for efficacy-driven formulations that address visible signs of aging, supported by dermatologist endorsements and scientifically proven claims. Other consumer groups, including younger prevention adopters and men, are gradually increasing their share, but a slower pace of adoption is anticipated relative to the core female demographic. Subscription models and e-commerce engagement are expected to reinforce long-term retention among women aged 35+, consolidating their influence on product innovation pipelines.
  • The USA holds a 19.4% share of the global market in 2025.
  • Women 35+ dominate with 64.6% share versus 35.4% for other users.
  • Growth is supported by clinical substantiation, digital-first distribution, and premium formulations.

Opportunity Analysis of China Anti-Wrinkle Creams Market

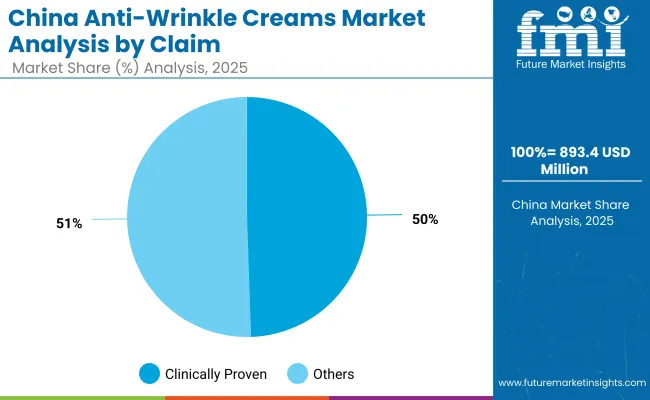
China Anti Wrinkle Creams Market By Claim

China by Claim Market Value Share, 2025
Clinically proven 49.5%
Others 50.5%

The Anti-Wrinkle Creams Market in China is projected to expand rapidly with a CAGR of 18.3% during 2025 to 2035, positioning it as one of the most dynamic global growth engines. In 2025, clinically proven formulations account for 49.5% of market value (USD 893.4 Million), while other claims represent 50.5% (USD 911.66 Million).

This near-equal split illustrates a competitive landscape where clinical validation is gaining momentum against traditional and natural positioning. Stronger regulatory oversight on product efficacy is expected to accelerate the transition toward clinically substantiated formulations. Digital-first channels, particularly social commerce and livestreaming, are projected to amplify consumer education and regimen adoption.
  • China holds a 9.9% share of the global market in 2025, projected to rise to 11.4% by 2035.
  • Clinically proven claims are anticipated to expand share due to stricter advertising regulations and consumer trust.
  • Social commerce ecosystems are expected to reinforce premium product adoption and recurring sales.
  • Domestic innovators are projected to challenge international leaders through faster product rollouts and localized claims.

Competitive Landscape of Anti-Wrinkle Creams Market

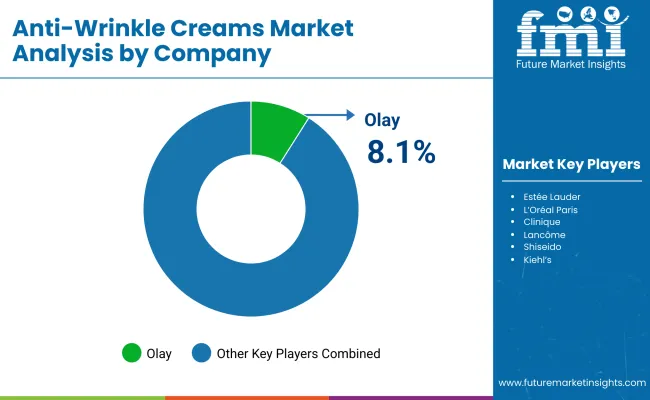
Anti Wrinkle Creams Market By Company

Company Global Value Share 2025
Olay 8.1%
Others 91.9%

The Anti-Wrinkle Creams Market is moderately fragmented, with global leaders, premium-focused innovators, and niche regional specialists competing across diverse consumer segments. Established leaders such as Olay (Procter & Gamble), L’Oréal Paris, Estée Lauder, Shiseido, and Lancôme hold significant visibility due to brand heritage, broad distribution, and strong dermatology affiliations. Olay dominated the global market in 2024, holding the largest individual share, which is reported at 8.1% in 2025, while the remaining 91.9% is distributed among other players.

Mid-sized innovators such as Clinique, Neutrogena, SK-II, Elizabeth Arden, and Kiehl’s have reinforced their positions by focusing on clinically validated claims, dermatologist-tested formulations, and expanding e-commerce presence. Their strategies emphasize customization, sensitive-skin compatibility, and science-led marketing, which appeal strongly to evidence-driven consumers.

Regional specialists and emerging entrants are competing through plant-based alternatives, vegan formulations, and cost-efficient products that resonate with younger prevention-focused demographics. These companies are leveraging agility and localized consumer insights rather than scale, strengthening competitiveness in Asia-Pacific and Europe.

Competitive differentiation is shifting away from product breadth alone toward integrated value ecosystems combining digital consultations, subscription-driven loyalty programs, and clinical substantiation. Over the forecast horizon, leaders that invest in scientific credibility, personalized digital pathways, and premium experience delivery are expected to consolidate share in this evolving market.

Key Developments in Anti-Wrinkle Creams Market

  • In March 2025, InnBeauty Project launched the Extreme Cream Eye Firming & Contouring Eye Cream, extending their core Extreme Cream line to an eye-specific formula. Deep hydration with innovative reverse emulsion creation was achieved, and clinical data revealed ~70% average wrinkle width reduction after 12 weeks.
  • In February 2025, Lubrizol disclosed new data for a 5% Argireline® Amplified peptide solution cream in clinical testing. Use twice daily over four months yielded measurable improvements in wrinkle visibility, roughness, and facial line depth under 2D/3D imaging. The peptide-enhanced formulation is anticipated to elevate demand for non-retinoid, peptide-driven alternatives.

Scope of the Report

Item Value
Quantitative Units USD 18,203.8 Million (2025); USD 37,905.2 Million (2035); CAGR 7.6% (2025 to 2035)
Component / Formulation Focus Retinol & retinoid blends; Peptides; Antioxidants (vitamin C/E, coenzyme Q10); Hyaluronic acid; Plant-based retinol alternatives (bakuchiol)
Product Type Day creams; Night creams; Eye/neck creams; All-in-one moisturizers
Claim Clinically proven; Fragrance-free; Dermatologist-tested; Vegan
Distribution Channel E-commerce; Specialty beauty retail; Pharmacies; Department stores
End User Women 35+; Men; Luxury skincare users; Sensitive skin users
Regions Covered North America; Europe; Asia-Pacific; Latin America; Middle East & Africa
Countries Covered United States; Canada; Germany; France; United Kingdom; China; Japan; India; Brazil; South Africa
Key Companies Profiled Olay; Estée Lauder; L’Oréal Paris; Clinique; Lancôme; Shiseido; Neutrogena; SK-II; Elizabeth Arden; Kiehl’s
Additional Attributes Dollar sales by end user, claim, and channel; share of clinically proven claims; e-commerce/subscription adoption; dermatologist partnerships and trial-backed efficacy; premiumization and sensitive-skin innovation; plant-based alternatives (bakuchiol); social-commerce scale in China; regional CAGRs (India 20.2%, China 18.3%, Japan 13.2%, UK 11.1%, Germany 9.1%, Europe 8.2%, USA 7.8%).

Key Segments

By Active Ingredient:

  • Retinol & retinoid blends
  • Peptides
  • Antioxidants (vitamin C/E, coenzyme Q10)
  • Hyaluronic acid
  • Plant-based retinol alternatives (bakuchiol)

By Product Type:

  • Day creams
  • Night creams
  • Eye/neck creams
  • All-in-one moisturizers

By Claim:

  • Clinically proven
  • Fragrance-free
  • Dermatologist-tested
  • Vegan

By Channel:

  • E-commerce
  • Specialty beauty retail
  • Pharmacies
  • Department stores

By End User:

  • Women 35+
  • Men
  • Luxury skincare users
  • Sensitive skin users

By Region:

  • North America
  • Latin America
  • Europe
  • East Asia
  • South Asia & Pacific
  • Middle East and Africa

Table of Content

  1. Executive Summary
    • Global Market Outlook
    • Demand-side Trends
    • Supply-side Trends
    • Technology Roadmap Analysis
    • Analysis and Recommendations
  2. Market Overview
    • Market Coverage / Taxonomy
    • Market Definition / Scope / Limitations
  3. Market Background
    • Market Dynamics
      • Drivers
      • Restraints
      • Opportunity
      • Trends
    • Scenario Forecast
      • Demand in Optimistic Scenario
      • Demand in Likely Scenario
      • Demand in Conservative Scenario
    • Opportunity Map Analysis
    • Product Life Cycle Analysis
    • Supply Chain Analysis
      • Supply Side Participants and their Roles
        • Producers
        • Mid-Level Participants (Traders/ Agents/ Brokers)
        • Wholesalers and Distributors
      • Value Added and Value Created at Node in the Supply Chain
      • List of Raw Material Suppliers
      • List of Existing and Potential Buyer’s
    • Investment Feasibility Matrix
    • Value Chain Analysis
      • Profit Margin Analysis
      • Wholesalers and Distributors
      • Retailers
    • PESTLE and Porter’s Analysis
    • Regulatory Landscape
      • By Key Regions
      • By Key Countries
    • Regional Parent Market Outlook
    • Production and Consumption Statistics
    • Import and Export Statistics
  4. Global Market Analysis 2020 to 2024 and Forecast, 2025 to 2035
    • Historical Market Size Value (USD Million) & Volume (Units) Analysis, 2020 to 2024
    • Current and Future Market Size Value (USD Million) & Volume (Units) Projections, 2025 to 2035
      • Y-o-Y Growth Trend Analysis
      • Absolute $ Opportunity Analysis
  5. Global Market Analysis 2020 to 2024 and Forecast 2025 to 2035, By Active Ingredient
    • Introduction / Key Findings
    • Historical Market Size Value (USD Million) & Volume (Units) Analysis By Active Ingredient, 2020 to 2024
    • Current and Future Market Size Value (USD Million) & Volume (Units) Analysis and Forecast By Active Ingredient, 2025 to 2035
      • Retinol & retinoid blends
      • Peptides
      • Antioxidants (vitamin C/E, coenzyme Q10)
      • Hyaluronic acid
      • Plant-based retinol alternatives (bakuchiol)
    • Y-o-Y Growth Trend Analysis By Active Ingredient, 2020 to 2024
    • Absolute $ Opportunity Analysis By Active Ingredient, 2025 to 2035
  6. Global Market Analysis 2020 to 2024 and Forecast 2025 to 2035, By Product Type
    • Introduction / Key Findings
    • Historical Market Size Value (USD Million) & Volume (Units) Analysis By Product Type, 2020 to 2024
    • Current and Future Market Size Value (USD Million) & Volume (Units) Analysis and Forecast By Product Type, 2025 to 2035
      • Day creams
      • Night creams
      • Eye/neck creams
      • All-in-one moisturizers
    • Y-o-Y Growth Trend Analysis By Product Type, 2020 to 2024
    • Absolute $ Opportunity Analysis By Product Type, 2025 to 2035
  7. Global Market Analysis 2020 to 2024 and Forecast 2025 to 2035, By Claim
    • Introduction / Key Findings
    • Historical Market Size Value (USD Million) & Volume (Units) Analysis By Claim, 2020 to 2024
    • Current and Future Market Size Value (USD Million) & Volume (Units) Analysis and Forecast By Claim, 2025 to 2035
      • Clinically proven
      • Fragrance-free
      • Dermatologist-tested
      • Vegan
    • Y-o-Y Growth Trend Analysis By Claim, 2020 to 2024
    • Absolute $ Opportunity Analysis By Claim, 2025 to 2035
  8. Global Market Analysis 2020 to 2024 and Forecast 2025 to 2035, By Channel
    • Introduction / Key Findings
    • Historical Market Size Value (USD Million) & Volume (Units) Analysis By Channel, 2020 to 2024
    • Current and Future Market Size Value (USD Million) & Volume (Units) Analysis and Forecast By Channel, 2025 to 2035
      • E-commerce
      • Specialty beauty retail
      • Pharmacies
      • Department stores
    • Y-o-Y Growth Trend Analysis By Channel, 2020 to 2024
    • Absolute $ Opportunity Analysis By Channel, 2025 to 2035
  9. Global Market Analysis 2020 to 2024 and Forecast 2025 to 2035, By End User
    • Introduction / Key Findings
    • Historical Market Size Value (USD Million) & Volume (Units) Analysis By End User, 2020 to 2024
    • Current and Future Market Size Value (USD Million) & Volume (Units) Analysis and Forecast By End User, 2025 to 2035
      • Women 35+
      • Men
      • Luxury skincare users
      • Sensitive skin users
    • Y-o-Y Growth Trend Analysis By End User, 2020 to 2024
    • Absolute $ Opportunity Analysis By End User, 2025 to 2035
  10. Global Market Analysis 2020 to 2024 and Forecast 2025 to 2035, By Region
    • Introduction
    • Historical Market Size Value (USD Million) & Volume (Units) Analysis By Region, 2020 to 2024
    • Current Market Size Value (USD Million) & Volume (Units) Analysis and Forecast By Region, 2025 to 2035
      • North America
      • Latin America
      • Europe
      • East Asia
      • South Asia & Pacific
      • Middle East and Africa
    • Market Attractiveness Analysis By Region
  11. North America Market Analysis 2020 to 2024 and Forecast 2025 to 2035, By Country
    • Historical Market Size Value (USD Million) & Volume (Units) Trend Analysis By Market Taxonomy, 2020 to 2024
    • Market Size Value (USD Million) & Volume (Units) Forecast By Market Taxonomy, 2025 to 2035
      • By Country
        • USA
        • Canada
      • By Active Ingredient
      • By Product Type
      • By Claim
      • By Channel
      • By End User
    • Market Attractiveness Analysis
      • By Country
      • By Active Ingredient
      • By Product Type
      • By Claim
      • By Channel
      • By End User
    • Key Takeaways
  12. Latin America Market Analysis 2020 to 2024 and Forecast 2025 to 2035, By Country
    • Historical Market Size Value (USD Million) & Volume (Units) Trend Analysis By Market Taxonomy, 2020 to 2024
    • Market Size Value (USD Million) & Volume (Units) Forecast By Market Taxonomy, 2025 to 2035
      • By Country
        • Brazil
        • Mexico
        • Colombia
        • Rest of Latin America
      • By Active Ingredient
      • By Product Type
      • By Claim
      • By Channel
      • By End User
    • Market Attractiveness Analysis
      • By Country
      • By Active Ingredient
      • By Product Type
      • By Claim
      • By Channel
      • By End User
    • Key Takeaways
  13. Europe Market Analysis 2020 to 2024 and Forecast 2025 to 2035, By Country
    • Historical Market Size Value (USD Million) & Volume (Units) Trend Analysis By Market Taxonomy, 2020 to 2024
    • Market Size Value (USD Million) & Volume (Units) Forecast By Market Taxonomy, 2025 to 2035
      • By Country
        • Germany
        • UK
        • France
        • Italy
        • Spain
        • Belgium
        • Netherlands
        • Nordic
        • Switzerland
        • Russia
        • Poland
        • Rest of Europe
      • By Active Ingredient
      • By Product Type
      • By Claim
      • By Channel
      • By End User
    • Market Attractiveness Analysis
      • By Country
      • By Active Ingredient
      • By Product Type
      • By Claim
      • By Channel
      • By End User
    • Key Takeaways
  14. East Asia Market Analysis 2020 to 2024 and Forecast 2025 to 2035, By Country
    • Historical Market Size Value (USD Million) & Volume (Units) Trend Analysis By Market Taxonomy, 2020 to 2024
    • Market Size Value (USD Million) & Volume (Units) Forecast By Market Taxonomy, 2025 to 2035
      • By Country
        • China
        • Japan
        • South Korea
      • By Active Ingredient
      • By Product Type
      • By Claim
      • By Channel
      • By End User
    • Market Attractiveness Analysis
      • By Country
      • By Active Ingredient
      • By Product Type
      • By Claim
      • By Channel
      • By End User
    • Key Takeaways
  15. South Asia & Pacific Market Analysis 2020 to 2024 and Forecast 2025 to 2035, By Country
    • Historical Market Size Value (USD Million) & Volume (Units) Trend Analysis By Market Taxonomy, 2020 to 2024
    • Market Size Value (USD Million) & Volume (Units) Forecast By Market Taxonomy, 2025 to 2035
      • By Country
        • India
        • Thailand
        • Malaysia
        • Indonesia
        • Singapore
        • Vietnam
        • Australia
        • New Zealand
        • Rest of South Asia
      • By Active Ingredient
      • By Product Type
      • By Claim
      • By Channel
      • By End User
    • Market Attractiveness Analysis
      • By Country
      • By Active Ingredient
      • By Product Type
      • By Claim
      • By Channel
      • By End User
    • Key Takeaways
  16. Middle East and Africa Market Analysis 2020 to 2024 and Forecast 2025 to 2035, By Country
    • Historical Market Size Value (USD Million) & Volume (Units) Trend Analysis By Market Taxonomy, 2020 to 2024
    • Market Size Value (USD Million) & Volume (Units) Forecast By Market Taxonomy, 2025 to 2035
      • By Country
        • Turkey
        • UAE
        • Saudi Arabia
        • Israel
        • Other GCC Countries
        • North Africa
        • South Africa
      • By Active Ingredient
      • By Product Type
      • By Claim
      • By Channel
      • By End User
    • Market Attractiveness Analysis
      • By Country
      • By Active Ingredient
      • By Product Type
      • By Claim
      • By Channel
      • By End User
    • Key Takeaways
  17. Key Countries Market Analysis
    • USA
      • Pricing Analysis
      • Market Share Analysis, 2024
        • By Active Ingredient
        • By Product Type
        • By Claim
        • By Channel
        • By End User
    • Canada
      • Pricing Analysis
      • Market Share Analysis, 2024
        • By Active Ingredient
        • By Product Type
        • By Claim
        • By Channel
        • By End User
    • Brazil
      • Pricing Analysis
      • Market Share Analysis, 2024
        • By Active Ingredient
        • By Product Type
        • By Claim
        • By Channel
        • By End User
    • Mexico
      • Pricing Analysis
      • Market Share Analysis, 2024
        • By Active Ingredient
        • By Product Type
        • By Claim
        • By Channel
        • By End User
    • Colombia
      • Pricing Analysis
      • Market Share Analysis, 2024
        • By Active Ingredient
        • By Product Type
        • By Claim
        • By Channel
        • By End User
    • Germany
      • Pricing Analysis
      • Market Share Analysis, 2024
        • By Active Ingredient
        • By Product Type
        • By Claim
        • By Channel
        • By End User
    • UK
      • Pricing Analysis
      • Market Share Analysis, 2024
        • By Active Ingredient
        • By Product Type
        • By Claim
        • By Channel
        • By End User
    • France
      • Pricing Analysis
      • Market Share Analysis, 2024
        • By Active Ingredient
        • By Product Type
        • By Claim
        • By Channel
        • By End User
    • Italy
      • Pricing Analysis
      • Market Share Analysis, 2024
        • By Active Ingredient
        • By Product Type
        • By Claim
        • By Channel
        • By End User
    • Spain
      • Pricing Analysis
      • Market Share Analysis, 2024
        • By Active Ingredient
        • By Product Type
        • By Claim
        • By Channel
        • By End User
    • Belgium
      • Pricing Analysis
      • Market Share Analysis, 2024
        • By Active Ingredient
        • By Product Type
        • By Claim
        • By Channel
        • By End User
    • Netherlands
      • Pricing Analysis
      • Market Share Analysis, 2024
        • By Active Ingredient
        • By Product Type
        • By Claim
        • By Channel
        • By End User
    • Nordic
      • Pricing Analysis
      • Market Share Analysis, 2024
        • By Active Ingredient
        • By Product Type
        • By Claim
        • By Channel
        • By End User
    • Switzerland
      • Pricing Analysis
      • Market Share Analysis, 2024
        • By Active Ingredient
        • By Product Type
        • By Claim
        • By Channel
        • By End User
    • Russia
      • Pricing Analysis
      • Market Share Analysis, 2024
        • By Active Ingredient
        • By Product Type
        • By Claim
        • By Channel
        • By End User
    • Poland
      • Pricing Analysis
      • Market Share Analysis, 2024
        • By Active Ingredient
        • By Product Type
        • By Claim
        • By Channel
        • By End User
    • China
      • Pricing Analysis
      • Market Share Analysis, 2024
        • By Active Ingredient
        • By Product Type
        • By Claim
        • By Channel
        • By End User
    • Japan
      • Pricing Analysis
      • Market Share Analysis, 2024
        • By Active Ingredient
        • By Product Type
        • By Claim
        • By Channel
        • By End User
    • South Korea
      • Pricing Analysis
      • Market Share Analysis, 2024
        • By Active Ingredient
        • By Product Type
        • By Claim
        • By Channel
        • By End User
    • India
      • Pricing Analysis
      • Market Share Analysis, 2024
        • By Active Ingredient
        • By Product Type
        • By Claim
        • By Channel
        • By End User
    • Thailand
      • Pricing Analysis
      • Market Share Analysis, 2024
        • By Active Ingredient
        • By Product Type
        • By Claim
        • By Channel
        • By End User
    • Indonesia
      • Pricing Analysis
      • Market Share Analysis, 2024
        • By Active Ingredient
        • By Product Type
        • By Claim
        • By Channel
        • By End User
    • Australia
      • Pricing Analysis
      • Market Share Analysis, 2024
        • By Active Ingredient
        • By Product Type
        • By Claim
        • By Channel
        • By End User
    • New Zealand
      • Pricing Analysis
      • Market Share Analysis, 2024
        • By Active Ingredient
        • By Product Type
        • By Claim
        • By Channel
        • By End User
    • Turkey
      • Pricing Analysis
      • Market Share Analysis, 2024
        • By Active Ingredient
        • By Product Type
        • By Claim
        • By Channel
        • By End User
    • UAE
      • Pricing Analysis
      • Market Share Analysis, 2024
        • By Active Ingredient
        • By Product Type
        • By Claim
        • By Channel
        • By End User
    • Saudi Arabia
      • Pricing Analysis
      • Market Share Analysis, 2024
        • By Active Ingredient
        • By Product Type
        • By Claim
        • By Channel
        • By End User
    • Israel
      • Pricing Analysis
      • Market Share Analysis, 2024
        • By Active Ingredient
        • By Product Type
        • By Claim
        • By Channel
        • By End User
    • North Africa
      • Pricing Analysis
      • Market Share Analysis, 2024
        • By Active Ingredient
        • By Product Type
        • By Claim
        • By Channel
        • By End User
    • South Africa
      • Pricing Analysis
      • Market Share Analysis, 2024
        • By Active Ingredient
        • By Product Type
        • By Claim
        • By Channel
        • By End User
  18. Market Structure Analysis
    • Competition Dashboard
    • Competition Benchmarking
    • Market Share Analysis of Top Players
      • By Regional
      • By Active Ingredient
      • By Product Type
      • By Claim
      • By Channel
      • By End User
  19. Competition Analysis
    • Competition Deep Dive
      • Olay
        • Overview
        • Product Portfolio
        • Profitability by Market Segments (Product/Age /Sales Channel/Region)
        • Sales Footprint
        • Strategy Overview
          • Marketing Strategy
          • Product Strategy
          • Channel Strategy
      • Estée Lauder
        • Overview
        • Product Portfolio
        • Profitability by Market Segments (Product/Age /Sales Channel/Region)
        • Sales Footprint
        • Strategy Overview
          • Marketing Strategy
          • Product Strategy
          • Channel Strategy
      • L’Oréal Paris
        • Overview
        • Product Portfolio
        • Profitability by Market Segments (Product/Age /Sales Channel/Region)
        • Sales Footprint
        • Strategy Overview
          • Marketing Strategy
          • Product Strategy
          • Channel Strategy
      • Clinique
        • Overview
        • Product Portfolio
        • Profitability by Market Segments (Product/Age /Sales Channel/Region)
        • Sales Footprint
        • Strategy Overview
          • Marketing Strategy
          • Product Strategy
          • Channel Strategy
      • Lancôme
        • Overview
        • Product Portfolio
        • Profitability by Market Segments (Product/Age /Sales Channel/Region)
        • Sales Footprint
        • Strategy Overview
          • Marketing Strategy
          • Product Strategy
          • Channel Strategy
      • Shiseido
        • Overview
        • Product Portfolio
        • Profitability by Market Segments (Product/Age /Sales Channel/Region)
        • Sales Footprint
        • Strategy Overview
          • Marketing Strategy
          • Product Strategy
          • Channel Strategy
      • Neutrogena
        • Overview
        • Product Portfolio
        • Profitability by Market Segments (Product/Age /Sales Channel/Region)
        • Sales Footprint
        • Strategy Overview
          • Marketing Strategy
          • Product Strategy
          • Channel Strategy
      • SK-II
        • Overview
        • Product Portfolio
        • Profitability by Market Segments (Product/Age /Sales Channel/Region)
        • Sales Footprint
        • Strategy Overview
          • Marketing Strategy
          • Product Strategy
          • Channel Strategy
      • Elizabeth Arden
        • Overview
        • Product Portfolio
        • Profitability by Market Segments (Product/Age /Sales Channel/Region)
        • Sales Footprint
        • Strategy Overview
          • Marketing Strategy
          • Product Strategy
          • Channel Strategy
      • Kiehl’s
        • Overview
        • Product Portfolio
        • Profitability by Market Segments (Product/Age /Sales Channel/Region)
        • Sales Footprint
        • Strategy Overview
          • Marketing Strategy
          • Product Strategy
          • Channel Strategy
      • Others
        • Overview
        • Product Portfolio
        • Profitability by Market Segments (Product/Age /Sales Channel/Region)
        • Sales Footprint
        • Strategy Overview
          • Marketing Strategy
          • Product Strategy
          • Channel Strategy
  20. Assumptions & Acronyms Used
  21. Research Methodology

List of Tables

  • Table 1: Global Market Value (USD Million) Forecast by Region, 2020-2035
  • Table 2: Global Market Volume (Units) Forecast by Region, 2020-2035
  • Table 3: Global Market Value (USD Million) Forecast by Active Ingredient, 2020-2035
  • Table 4: Global Market Volume (Units) Forecast by Active Ingredient, 2020-2035
  • Table 5: Global Market Value (USD Million) Forecast by Product Type, 2020-2035
  • Table 6: Global Market Volume (Units) Forecast by Product Type, 2020-2035
  • Table 7: Global Market Value (USD Million) Forecast by Claim, 2020-2035
  • Table 8: Global Market Volume (Units) Forecast by Claim, 2020-2035
  • Table 9: Global Market Value (USD Million) Forecast by Channel, 2020-2035
  • Table 10: Global Market Volume (Units) Forecast by Channel, 2020-2035
  • Table 11: Global Market Value (USD Million) Forecast by End User, 2020-2035
  • Table 12: Global Market Volume (Units) Forecast by End User, 2020-2035
  • Table 13: North America Market Value (USD Million) Forecast by Country, 2020-2035
  • Table 14: North America Market Volume (Units) Forecast by Country, 2020-2035
  • Table 15: North America Market Value (USD Million) Forecast by Active Ingredient, 2020-2035
  • Table 16: North America Market Volume (Units) Forecast by Active Ingredient, 2020-2035
  • Table 17: North America Market Value (USD Million) Forecast by Product Type, 2020-2035
  • Table 18: North America Market Volume (Units) Forecast by Product Type, 2020-2035
  • Table 19: North America Market Value (USD Million) Forecast by Claim, 2020-2035
  • Table 20: North America Market Volume (Units) Forecast by Claim, 2020-2035
  • Table 21: North America Market Value (USD Million) Forecast by Channel, 2020-2035
  • Table 22: North America Market Volume (Units) Forecast by Channel, 2020-2035
  • Table 23: North America Market Value (USD Million) Forecast by End User, 2020-2035
  • Table 24: North America Market Volume (Units) Forecast by End User, 2020-2035
  • Table 25: Latin America Market Value (USD Million) Forecast by Country, 2020-2035
  • Table 26: Latin America Market Volume (Units) Forecast by Country, 2020-2035
  • Table 27: Latin America Market Value (USD Million) Forecast by Active Ingredient, 2020-2035
  • Table 28: Latin America Market Volume (Units) Forecast by Active Ingredient, 2020-2035
  • Table 29: Latin America Market Value (USD Million) Forecast by Product Type, 2020-2035
  • Table 30: Latin America Market Volume (Units) Forecast by Product Type, 2020-2035
  • Table 31: Latin America Market Value (USD Million) Forecast by Claim, 2020-2035
  • Table 32: Latin America Market Volume (Units) Forecast by Claim, 2020-2035
  • Table 33: Latin America Market Value (USD Million) Forecast by Channel, 2020-2035
  • Table 34: Latin America Market Volume (Units) Forecast by Channel, 2020-2035
  • Table 35: Latin America Market Value (USD Million) Forecast by End User, 2020-2035
  • Table 36: Latin America Market Volume (Units) Forecast by End User, 2020-2035
  • Table 37: Europe Market Value (USD Million) Forecast by Country, 2020-2035
  • Table 38: Europe Market Volume (Units) Forecast by Country, 2020-2035
  • Table 39: Europe Market Value (USD Million) Forecast by Active Ingredient, 2020-2035
  • Table 40: Europe Market Volume (Units) Forecast by Active Ingredient, 2020-2035
  • Table 41: Europe Market Value (USD Million) Forecast by Product Type, 2020-2035
  • Table 42: Europe Market Volume (Units) Forecast by Product Type, 2020-2035
  • Table 43: Europe Market Value (USD Million) Forecast by Claim, 2020-2035
  • Table 44: Europe Market Volume (Units) Forecast by Claim, 2020-2035
  • Table 45: Europe Market Value (USD Million) Forecast by Channel, 2020-2035
  • Table 46: Europe Market Volume (Units) Forecast by Channel, 2020-2035
  • Table 47: Europe Market Value (USD Million) Forecast by End User, 2020-2035
  • Table 48: Europe Market Volume (Units) Forecast by End User, 2020-2035
  • Table 49: East Asia Market Value (USD Million) Forecast by Country, 2020-2035
  • Table 50: East Asia Market Volume (Units) Forecast by Country, 2020-2035
  • Table 51: East Asia Market Value (USD Million) Forecast by Active Ingredient, 2020-2035
  • Table 52: East Asia Market Volume (Units) Forecast by Active Ingredient, 2020-2035
  • Table 53: East Asia Market Value (USD Million) Forecast by Product Type, 2020-2035
  • Table 54: East Asia Market Volume (Units) Forecast by Product Type, 2020-2035
  • Table 55: East Asia Market Value (USD Million) Forecast by Claim, 2020-2035
  • Table 56: East Asia Market Volume (Units) Forecast by Claim, 2020-2035
  • Table 57: East Asia Market Value (USD Million) Forecast by Channel, 2020-2035
  • Table 58: East Asia Market Volume (Units) Forecast by Channel, 2020-2035
  • Table 59: East Asia Market Value (USD Million) Forecast by End User, 2020-2035
  • Table 60: East Asia Market Volume (Units) Forecast by End User, 2020-2035
  • Table 61: South Asia & Pacific Market Value (USD Million) Forecast by Country, 2020-2035
  • Table 62: South Asia & Pacific Market Volume (Units) Forecast by Country, 2020-2035
  • Table 63: South Asia & Pacific Market Value (USD Million) Forecast by Active Ingredient, 2020-2035
  • Table 64: South Asia & Pacific Market Volume (Units) Forecast by Active Ingredient, 2020-2035
  • Table 65: South Asia & Pacific Market Value (USD Million) Forecast by Product Type, 2020-2035
  • Table 66: South Asia & Pacific Market Volume (Units) Forecast by Product Type, 2020-2035
  • Table 67: South Asia & Pacific Market Value (USD Million) Forecast by Claim, 2020-2035
  • Table 68: South Asia & Pacific Market Volume (Units) Forecast by Claim, 2020-2035
  • Table 69: South Asia & Pacific Market Value (USD Million) Forecast by Channel, 2020-2035
  • Table 70: South Asia & Pacific Market Volume (Units) Forecast by Channel, 2020-2035
  • Table 71: South Asia & Pacific Market Value (USD Million) Forecast by End User, 2020-2035
  • Table 72: South Asia & Pacific Market Volume (Units) Forecast by End User, 2020-2035
  • Table 73: Middle East and Africa Market Value (USD Million) Forecast by Country, 2020-2035
  • Table 74: Middle East and Africa Market Volume (Units) Forecast by Country, 2020-2035
  • Table 75: Middle East and Africa Market Value (USD Million) Forecast by Active Ingredient, 2020-2035
  • Table 76: Middle East and Africa Market Volume (Units) Forecast by Active Ingredient, 2020-2035
  • Table 77: Middle East and Africa Market Value (USD Million) Forecast by Product Type, 2020-2035
  • Table 78: Middle East and Africa Market Volume (Units) Forecast by Product Type, 2020-2035
  • Table 79: Middle East and Africa Market Value (USD Million) Forecast by Claim, 2020-2035
  • Table 80: Middle East and Africa Market Volume (Units) Forecast by Claim, 2020-2035
  • Table 81: Middle East and Africa Market Value (USD Million) Forecast by Channel, 2020-2035
  • Table 82: Middle East and Africa Market Volume (Units) Forecast by Channel, 2020-2035
  • Table 83: Middle East and Africa Market Value (USD Million) Forecast by End User, 2020-2035
  • Table 84: Middle East and Africa Market Volume (Units) Forecast by End User, 2020-2035

List of Figures

  • Figure 1: Global Market Value (USD Million) by Active Ingredient, 2025-2035
  • Figure 2: Global Market Value (USD Million) by Product Type, 2025-2035
  • Figure 3: Global Market Value (USD Million) by Claim, 2025-2035
  • Figure 4: Global Market Value (USD Million) by Channel, 2025-2035
  • Figure 5: Global Market Value (USD Million) by End User, 2025-2035
  • Figure 6: Global Market Value (USD Million) by Region, 2025-2035
  • Figure 7: Global Market Value (USD Million) Analysis by Region, 2020-2035
  • Figure 8: Global Market Volume (Units) Analysis by Region, 2020-2035
  • Figure 9: Global Market Value Share (%) and BPS Analysis by Region, 2025-2035
  • Figure 10: Global Market Y-o-Y Growth (%) Projections by Region, 2025-2035
  • Figure 11: Global Market Value (USD Million) Analysis by Active Ingredient, 2020-2035
  • Figure 12: Global Market Volume (Units) Analysis by Active Ingredient, 2020-2035
  • Figure 13: Global Market Value Share (%) and BPS Analysis by Active Ingredient, 2025-2035
  • Figure 14: Global Market Y-o-Y Growth (%) Projections by Active Ingredient, 2025-2035
  • Figure 15: Global Market Value (USD Million) Analysis by Product Type, 2020-2035
  • Figure 16: Global Market Volume (Units) Analysis by Product Type, 2020-2035
  • Figure 17: Global Market Value Share (%) and BPS Analysis by Product Type, 2025-2035
  • Figure 18: Global Market Y-o-Y Growth (%) Projections by Product Type, 2025-2035
  • Figure 19: Global Market Value (USD Million) Analysis by Claim, 2020-2035
  • Figure 20: Global Market Volume (Units) Analysis by Claim, 2020-2035
  • Figure 21: Global Market Value Share (%) and BPS Analysis by Claim, 2025-2035
  • Figure 22: Global Market Y-o-Y Growth (%) Projections by Claim, 2025-2035
  • Figure 23: Global Market Value (USD Million) Analysis by Channel, 2020-2035
  • Figure 24: Global Market Volume (Units) Analysis by Channel, 2020-2035
  • Figure 25: Global Market Value Share (%) and BPS Analysis by Channel, 2025-2035
  • Figure 26: Global Market Y-o-Y Growth (%) Projections by Channel, 2025-2035
  • Figure 27: Global Market Value (USD Million) Analysis by End User, 2020-2035
  • Figure 28: Global Market Volume (Units) Analysis by End User, 2020-2035
  • Figure 29: Global Market Value Share (%) and BPS Analysis by End User, 2025-2035
  • Figure 30: Global Market Y-o-Y Growth (%) Projections by End User, 2025-2035
  • Figure 31: Global Market Attractiveness by Active Ingredient, 2025-2035
  • Figure 32: Global Market Attractiveness by Product Type, 2025-2035
  • Figure 33: Global Market Attractiveness by Claim, 2025-2035
  • Figure 34: Global Market Attractiveness by Channel, 2025-2035
  • Figure 35: Global Market Attractiveness by End User, 2025-2035
  • Figure 36: Global Market Attractiveness by Region, 2025-2035
  • Figure 37: North America Market Value (USD Million) by Active Ingredient, 2025-2035
  • Figure 38: North America Market Value (USD Million) by Product Type, 2025-2035
  • Figure 39: North America Market Value (USD Million) by Claim, 2025-2035
  • Figure 40: North America Market Value (USD Million) by Channel, 2025-2035
  • Figure 41: North America Market Value (USD Million) by End User, 2025-2035
  • Figure 42: North America Market Value (USD Million) by Country, 2025-2035
  • Figure 43: North America Market Value (USD Million) Analysis by Country, 2020-2035
  • Figure 44: North America Market Volume (Units) Analysis by Country, 2020-2035
  • Figure 45: North America Market Value Share (%) and BPS Analysis by Country, 2025-2035
  • Figure 46: North America Market Y-o-Y Growth (%) Projections by Country, 2025-2035
  • Figure 47: North America Market Value (USD Million) Analysis by Active Ingredient, 2020-2035
  • Figure 48: North America Market Volume (Units) Analysis by Active Ingredient, 2020-2035
  • Figure 49: North America Market Value Share (%) and BPS Analysis by Active Ingredient, 2025-2035
  • Figure 50: North America Market Y-o-Y Growth (%) Projections by Active Ingredient, 2025-2035
  • Figure 51: North America Market Value (USD Million) Analysis by Product Type, 2020-2035
  • Figure 52: North America Market Volume (Units) Analysis by Product Type, 2020-2035
  • Figure 53: North America Market Value Share (%) and BPS Analysis by Product Type, 2025-2035
  • Figure 54: North America Market Y-o-Y Growth (%) Projections by Product Type, 2025-2035
  • Figure 55: North America Market Value (USD Million) Analysis by Claim, 2020-2035
  • Figure 56: North America Market Volume (Units) Analysis by Claim, 2020-2035
  • Figure 57: North America Market Value Share (%) and BPS Analysis by Claim, 2025-2035
  • Figure 58: North America Market Y-o-Y Growth (%) Projections by Claim, 2025-2035
  • Figure 59: North America Market Value (USD Million) Analysis by Channel, 2020-2035
  • Figure 60: North America Market Volume (Units) Analysis by Channel, 2020-2035
  • Figure 61: North America Market Value Share (%) and BPS Analysis by Channel, 2025-2035
  • Figure 62: North America Market Y-o-Y Growth (%) Projections by Channel, 2025-2035
  • Figure 63: North America Market Value (USD Million) Analysis by End User, 2020-2035
  • Figure 64: North America Market Volume (Units) Analysis by End User, 2020-2035
  • Figure 65: North America Market Value Share (%) and BPS Analysis by End User, 2025-2035
  • Figure 66: North America Market Y-o-Y Growth (%) Projections by End User, 2025-2035
  • Figure 67: North America Market Attractiveness by Active Ingredient, 2025-2035
  • Figure 68: North America Market Attractiveness by Product Type, 2025-2035
  • Figure 69: North America Market Attractiveness by Claim, 2025-2035
  • Figure 70: North America Market Attractiveness by Channel, 2025-2035
  • Figure 71: North America Market Attractiveness by End User, 2025-2035
  • Figure 72: North America Market Attractiveness by Country, 2025-2035
  • Figure 73: Latin America Market Value (USD Million) by Active Ingredient, 2025-2035
  • Figure 74: Latin America Market Value (USD Million) by Product Type, 2025-2035
  • Figure 75: Latin America Market Value (USD Million) by Claim, 2025-2035
  • Figure 76: Latin America Market Value (USD Million) by Channel, 2025-2035
  • Figure 77: Latin America Market Value (USD Million) by End User, 2025-2035
  • Figure 78: Latin America Market Value (USD Million) by Country, 2025-2035
  • Figure 79: Latin America Market Value (USD Million) Analysis by Country, 2020-2035
  • Figure 80: Latin America Market Volume (Units) Analysis by Country, 2020-2035
  • Figure 81: Latin America Market Value Share (%) and BPS Analysis by Country, 2025-2035
  • Figure 82: Latin America Market Y-o-Y Growth (%) Projections by Country, 2025-2035
  • Figure 83: Latin America Market Value (USD Million) Analysis by Active Ingredient, 2020-2035
  • Figure 84: Latin America Market Volume (Units) Analysis by Active Ingredient, 2020-2035
  • Figure 85: Latin America Market Value Share (%) and BPS Analysis by Active Ingredient, 2025-2035
  • Figure 86: Latin America Market Y-o-Y Growth (%) Projections by Active Ingredient, 2025-2035
  • Figure 87: Latin America Market Value (USD Million) Analysis by Product Type, 2020-2035
  • Figure 88: Latin America Market Volume (Units) Analysis by Product Type, 2020-2035
  • Figure 89: Latin America Market Value Share (%) and BPS Analysis by Product Type, 2025-2035
  • Figure 90: Latin America Market Y-o-Y Growth (%) Projections by Product Type, 2025-2035
  • Figure 91: Latin America Market Value (USD Million) Analysis by Claim, 2020-2035
  • Figure 92: Latin America Market Volume (Units) Analysis by Claim, 2020-2035
  • Figure 93: Latin America Market Value Share (%) and BPS Analysis by Claim, 2025-2035
  • Figure 94: Latin America Market Y-o-Y Growth (%) Projections by Claim, 2025-2035
  • Figure 95: Latin America Market Value (USD Million) Analysis by Channel, 2020-2035
  • Figure 96: Latin America Market Volume (Units) Analysis by Channel, 2020-2035
  • Figure 97: Latin America Market Value Share (%) and BPS Analysis by Channel, 2025-2035
  • Figure 98: Latin America Market Y-o-Y Growth (%) Projections by Channel, 2025-2035
  • Figure 99: Latin America Market Value (USD Million) Analysis by End User, 2020-2035
  • Figure 100: Latin America Market Volume (Units) Analysis by End User, 2020-2035
  • Figure 101: Latin America Market Value Share (%) and BPS Analysis by End User, 2025-2035
  • Figure 102: Latin America Market Y-o-Y Growth (%) Projections by End User, 2025-2035
  • Figure 103: Latin America Market Attractiveness by Active Ingredient, 2025-2035
  • Figure 104: Latin America Market Attractiveness by Product Type, 2025-2035
  • Figure 105: Latin America Market Attractiveness by Claim, 2025-2035
  • Figure 106: Latin America Market Attractiveness by Channel, 2025-2035
  • Figure 107: Latin America Market Attractiveness by End User, 2025-2035
  • Figure 108: Latin America Market Attractiveness by Country, 2025-2035
  • Figure 109: Europe Market Value (USD Million) by Active Ingredient, 2025-2035
  • Figure 110: Europe Market Value (USD Million) by Product Type, 2025-2035
  • Figure 111: Europe Market Value (USD Million) by Claim, 2025-2035
  • Figure 112: Europe Market Value (USD Million) by Channel, 2025-2035
  • Figure 113: Europe Market Value (USD Million) by End User, 2025-2035
  • Figure 114: Europe Market Value (USD Million) by Country, 2025-2035
  • Figure 115: Europe Market Value (USD Million) Analysis by Country, 2020-2035
  • Figure 116: Europe Market Volume (Units) Analysis by Country, 2020-2035
  • Figure 117: Europe Market Value Share (%) and BPS Analysis by Country, 2025-2035
  • Figure 118: Europe Market Y-o-Y Growth (%) Projections by Country, 2025-2035
  • Figure 119: Europe Market Value (USD Million) Analysis by Active Ingredient, 2020-2035
  • Figure 120: Europe Market Volume (Units) Analysis by Active Ingredient, 2020-2035
  • Figure 121: Europe Market Value Share (%) and BPS Analysis by Active Ingredient, 2025-2035
  • Figure 122: Europe Market Y-o-Y Growth (%) Projections by Active Ingredient, 2025-2035
  • Figure 123: Europe Market Value (USD Million) Analysis by Product Type, 2020-2035
  • Figure 124: Europe Market Volume (Units) Analysis by Product Type, 2020-2035
  • Figure 125: Europe Market Value Share (%) and BPS Analysis by Product Type, 2025-2035
  • Figure 126: Europe Market Y-o-Y Growth (%) Projections by Product Type, 2025-2035
  • Figure 127: Europe Market Value (USD Million) Analysis by Claim, 2020-2035
  • Figure 128: Europe Market Volume (Units) Analysis by Claim, 2020-2035
  • Figure 129: Europe Market Value Share (%) and BPS Analysis by Claim, 2025-2035
  • Figure 130: Europe Market Y-o-Y Growth (%) Projections by Claim, 2025-2035
  • Figure 131: Europe Market Value (USD Million) Analysis by Channel, 2020-2035
  • Figure 132: Europe Market Volume (Units) Analysis by Channel, 2020-2035
  • Figure 133: Europe Market Value Share (%) and BPS Analysis by Channel, 2025-2035
  • Figure 134: Europe Market Y-o-Y Growth (%) Projections by Channel, 2025-2035
  • Figure 135: Europe Market Value (USD Million) Analysis by End User, 2020-2035
  • Figure 136: Europe Market Volume (Units) Analysis by End User, 2020-2035
  • Figure 137: Europe Market Value Share (%) and BPS Analysis by End User, 2025-2035
  • Figure 138: Europe Market Y-o-Y Growth (%) Projections by End User, 2025-2035
  • Figure 139: Europe Market Attractiveness by Active Ingredient, 2025-2035
  • Figure 140: Europe Market Attractiveness by Product Type, 2025-2035
  • Figure 141: Europe Market Attractiveness by Claim, 2025-2035
  • Figure 142: Europe Market Attractiveness by Channel, 2025-2035
  • Figure 143: Europe Market Attractiveness by End User, 2025-2035
  • Figure 144: Europe Market Attractiveness by Country, 2025-2035
  • Figure 145: East Asia Market Value (USD Million) by Active Ingredient, 2025-2035
  • Figure 146: East Asia Market Value (USD Million) by Product Type, 2025-2035
  • Figure 147: East Asia Market Value (USD Million) by Claim, 2025-2035
  • Figure 148: East Asia Market Value (USD Million) by Channel, 2025-2035
  • Figure 149: East Asia Market Value (USD Million) by End User, 2025-2035
  • Figure 150: East Asia Market Value (USD Million) by Country, 2025-2035
  • Figure 151: East Asia Market Value (USD Million) Analysis by Country, 2020-2035
  • Figure 152: East Asia Market Volume (Units) Analysis by Country, 2020-2035
  • Figure 153: East Asia Market Value Share (%) and BPS Analysis by Country, 2025-2035
  • Figure 154: East Asia Market Y-o-Y Growth (%) Projections by Country, 2025-2035
  • Figure 155: East Asia Market Value (USD Million) Analysis by Active Ingredient, 2020-2035
  • Figure 156: East Asia Market Volume (Units) Analysis by Active Ingredient, 2020-2035
  • Figure 157: East Asia Market Value Share (%) and BPS Analysis by Active Ingredient, 2025-2035
  • Figure 158: East Asia Market Y-o-Y Growth (%) Projections by Active Ingredient, 2025-2035
  • Figure 159: East Asia Market Value (USD Million) Analysis by Product Type, 2020-2035
  • Figure 160: East Asia Market Volume (Units) Analysis by Product Type, 2020-2035
  • Figure 161: East Asia Market Value Share (%) and BPS Analysis by Product Type, 2025-2035
  • Figure 162: East Asia Market Y-o-Y Growth (%) Projections by Product Type, 2025-2035
  • Figure 163: East Asia Market Value (USD Million) Analysis by Claim, 2020-2035
  • Figure 164: East Asia Market Volume (Units) Analysis by Claim, 2020-2035
  • Figure 165: East Asia Market Value Share (%) and BPS Analysis by Claim, 2025-2035
  • Figure 166: East Asia Market Y-o-Y Growth (%) Projections by Claim, 2025-2035
  • Figure 167: East Asia Market Value (USD Million) Analysis by Channel, 2020-2035
  • Figure 168: East Asia Market Volume (Units) Analysis by Channel, 2020-2035
  • Figure 169: East Asia Market Value Share (%) and BPS Analysis by Channel, 2025-2035
  • Figure 170: East Asia Market Y-o-Y Growth (%) Projections by Channel, 2025-2035
  • Figure 171: East Asia Market Value (USD Million) Analysis by End User, 2020-2035
  • Figure 172: East Asia Market Volume (Units) Analysis by End User, 2020-2035
  • Figure 173: East Asia Market Value Share (%) and BPS Analysis by End User, 2025-2035
  • Figure 174: East Asia Market Y-o-Y Growth (%) Projections by End User, 2025-2035
  • Figure 175: East Asia Market Attractiveness by Active Ingredient, 2025-2035
  • Figure 176: East Asia Market Attractiveness by Product Type, 2025-2035
  • Figure 177: East Asia Market Attractiveness by Claim, 2025-2035
  • Figure 178: East Asia Market Attractiveness by Channel, 2025-2035
  • Figure 179: East Asia Market Attractiveness by End User, 2025-2035
  • Figure 180: East Asia Market Attractiveness by Country, 2025-2035
  • Figure 181: South Asia & Pacific Market Value (USD Million) by Active Ingredient, 2025-2035
  • Figure 182: South Asia & Pacific Market Value (USD Million) by Product Type, 2025-2035
  • Figure 183: South Asia & Pacific Market Value (USD Million) by Claim, 2025-2035
  • Figure 184: South Asia & Pacific Market Value (USD Million) by Channel, 2025-2035
  • Figure 185: South Asia & Pacific Market Value (USD Million) by End User, 2025-2035
  • Figure 186: South Asia & Pacific Market Value (USD Million) by Country, 2025-2035
  • Figure 187: South Asia & Pacific Market Value (USD Million) Analysis by Country, 2020-2035
  • Figure 188: South Asia & Pacific Market Volume (Units) Analysis by Country, 2020-2035
  • Figure 189: South Asia & Pacific Market Value Share (%) and BPS Analysis by Country, 2025-2035
  • Figure 190: South Asia & Pacific Market Y-o-Y Growth (%) Projections by Country, 2025-2035
  • Figure 191: South Asia & Pacific Market Value (USD Million) Analysis by Active Ingredient, 2020-2035
  • Figure 192: South Asia & Pacific Market Volume (Units) Analysis by Active Ingredient, 2020-2035
  • Figure 193: South Asia & Pacific Market Value Share (%) and BPS Analysis by Active Ingredient, 2025-2035
  • Figure 194: South Asia & Pacific Market Y-o-Y Growth (%) Projections by Active Ingredient, 2025-2035
  • Figure 195: South Asia & Pacific Market Value (USD Million) Analysis by Product Type, 2020-2035
  • Figure 196: South Asia & Pacific Market Volume (Units) Analysis by Product Type, 2020-2035
  • Figure 197: South Asia & Pacific Market Value Share (%) and BPS Analysis by Product Type, 2025-2035
  • Figure 198: South Asia & Pacific Market Y-o-Y Growth (%) Projections by Product Type, 2025-2035
  • Figure 199: South Asia & Pacific Market Value (USD Million) Analysis by Claim, 2020-2035
  • Figure 200: South Asia & Pacific Market Volume (Units) Analysis by Claim, 2020-2035
  • Figure 201: South Asia & Pacific Market Value Share (%) and BPS Analysis by Claim, 2025-2035
  • Figure 202: South Asia & Pacific Market Y-o-Y Growth (%) Projections by Claim, 2025-2035
  • Figure 203: South Asia & Pacific Market Value (USD Million) Analysis by Channel, 2020-2035
  • Figure 204: South Asia & Pacific Market Volume (Units) Analysis by Channel, 2020-2035
  • Figure 205: South Asia & Pacific Market Value Share (%) and BPS Analysis by Channel, 2025-2035
  • Figure 206: South Asia & Pacific Market Y-o-Y Growth (%) Projections by Channel, 2025-2035
  • Figure 207: South Asia & Pacific Market Value (USD Million) Analysis by End User, 2020-2035
  • Figure 208: South Asia & Pacific Market Volume (Units) Analysis by End User, 2020-2035
  • Figure 209: South Asia & Pacific Market Value Share (%) and BPS Analysis by End User, 2025-2035
  • Figure 210: South Asia & Pacific Market Y-o-Y Growth (%) Projections by End User, 2025-2035
  • Figure 211: South Asia & Pacific Market Attractiveness by Active Ingredient, 2025-2035
  • Figure 212: South Asia & Pacific Market Attractiveness by Product Type, 2025-2035
  • Figure 213: South Asia & Pacific Market Attractiveness by Claim, 2025-2035
  • Figure 214: South Asia & Pacific Market Attractiveness by Channel, 2025-2035
  • Figure 215: South Asia & Pacific Market Attractiveness by End User, 2025-2035
  • Figure 216: South Asia & Pacific Market Attractiveness by Country, 2025-2035
  • Figure 217: Middle East and Africa Market Value (USD Million) by Active Ingredient, 2025-2035
  • Figure 218: Middle East and Africa Market Value (USD Million) by Product Type, 2025-2035
  • Figure 219: Middle East and Africa Market Value (USD Million) by Claim, 2025-2035
  • Figure 220: Middle East and Africa Market Value (USD Million) by Channel, 2025-2035
  • Figure 221: Middle East and Africa Market Value (USD Million) by End User, 2025-2035
  • Figure 222: Middle East and Africa Market Value (USD Million) by Country, 2025-2035
  • Figure 223: Middle East and Africa Market Value (USD Million) Analysis by Country, 2020-2035
  • Figure 224: Middle East and Africa Market Volume (Units) Analysis by Country, 2020-2035
  • Figure 225: Middle East and Africa Market Value Share (%) and BPS Analysis by Country, 2025-2035
  • Figure 226: Middle East and Africa Market Y-o-Y Growth (%) Projections by Country, 2025-2035
  • Figure 227: Middle East and Africa Market Value (USD Million) Analysis by Active Ingredient, 2020-2035
  • Figure 228: Middle East and Africa Market Volume (Units) Analysis by Active Ingredient, 2020-2035
  • Figure 229: Middle East and Africa Market Value Share (%) and BPS Analysis by Active Ingredient, 2025-2035
  • Figure 230: Middle East and Africa Market Y-o-Y Growth (%) Projections by Active Ingredient, 2025-2035
  • Figure 231: Middle East and Africa Market Value (USD Million) Analysis by Product Type, 2020-2035
  • Figure 232: Middle East and Africa Market Volume (Units) Analysis by Product Type, 2020-2035
  • Figure 233: Middle East and Africa Market Value Share (%) and BPS Analysis by Product Type, 2025-2035
  • Figure 234: Middle East and Africa Market Y-o-Y Growth (%) Projections by Product Type, 2025-2035
  • Figure 235: Middle East and Africa Market Value (USD Million) Analysis by Claim, 2020-2035
  • Figure 236: Middle East and Africa Market Volume (Units) Analysis by Claim, 2020-2035
  • Figure 237: Middle East and Africa Market Value Share (%) and BPS Analysis by Claim, 2025-2035
  • Figure 238: Middle East and Africa Market Y-o-Y Growth (%) Projections by Claim, 2025-2035
  • Figure 239: Middle East and Africa Market Value (USD Million) Analysis by Channel, 2020-2035
  • Figure 240: Middle East and Africa Market Volume (Units) Analysis by Channel, 2020-2035
  • Figure 241: Middle East and Africa Market Value Share (%) and BPS Analysis by Channel, 2025-2035
  • Figure 242: Middle East and Africa Market Y-o-Y Growth (%) Projections by Channel, 2025-2035
  • Figure 243: Middle East and Africa Market Value (USD Million) Analysis by End User, 2020-2035
  • Figure 244: Middle East and Africa Market Volume (Units) Analysis by End User, 2020-2035
  • Figure 245: Middle East and Africa Market Value Share (%) and BPS Analysis by End User, 2025-2035
  • Figure 246: Middle East and Africa Market Y-o-Y Growth (%) Projections by End User, 2025-2035
  • Figure 247: Middle East and Africa Market Attractiveness by Active Ingredient, 2025-2035
  • Figure 248: Middle East and Africa Market Attractiveness by Product Type, 2025-2035
  • Figure 249: Middle East and Africa Market Attractiveness by Claim, 2025-2035
  • Figure 250: Middle East and Africa Market Attractiveness by Channel, 2025-2035
  • Figure 251: Middle East and Africa Market Attractiveness by End User, 2025-2035
  • Figure 252: Middle East and Africa Market Attractiveness by Country, 2025-2035

Frequently Asked Questions

How big is the Anti-Wrinkle Creams Market in 2025?

The global Anti-Wrinkle Creams Market is estimated to be valued at USD 18,203.8 Million in 2025.

What will be the size of the Anti-Wrinkle Creams Market in 2035?

The market size for the Anti-Wrinkle Creams Market is projected to reach USD 37,905.2 Million by 2035.

How much will be the Anti-Wrinkle Creams Market growth between 2025 and 2035?

The Anti-Wrinkle Creams Market is expected to grow at a CAGR of 7.6% between 2025 and 2035.

What are the key product types in the Anti-Wrinkle Creams Market?

The key product types in the Anti-Wrinkle Creams Market are day creams, night creams, eye/neck creams, and all-in-one moisturizers.

Which end-user segment will contribute the most in the Anti-Wrinkle Creams Market in 2025?

In terms of end users, the women 35+ segment is projected to command 64.6% share in the Anti-Wrinkle Creams Market in 2025.

Explore Similar Insights

Future Market Insights

Anti-Wrinkle Creams Market

Chat With

MaRIA

Hi There, I am MaRIA, Your Market Research Intelligence Assistant. How may I help you?