Peptide-Enhanced Firming Creams Market Size and Share Forecast Outlook 2025 to 2035

The Peptide-Enhanced Firming Creams Market is expected to record a valuation of USD 1,563.1 million in 2025 and USD 5,122.5 million in 2035, with an increase of USD 3,559.4 million, which equals a growth of 227% over the decade. The overall expansion represents a CAGR of 12.6% and a 3X increase in market size.
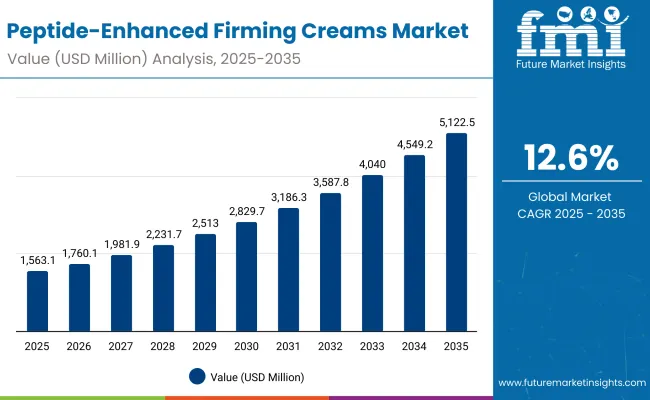
Quick Stats for Peptide-Enhanced Firming Creams Market

  • Peptide-Enhanced Firming Creams Market Value (2025): USD 1,563.1 million
  • Peptide-Enhanced Firming Creams Market Forecast Value (2035): USD 5,122.5 million
  • Peptide-Enhanced Firming Creams Market Forecast CAGR: 12.6%
  • Leading Segment in Peptide-Enhanced Firming Creams Market in 2025: Firming & lifting (45.2%)
  • Key Growth Regions in the Peptide-Enhanced Firming Creams Market: East Asia, South Asia & Pacific, North America
  • Top Key Players in Peptide-Enhanced Firming Creams Market: Estée Lauder, Olay, StriVectin, L’Oréal, Shiseido, Clinique, Paula’s Choice, Murad, Lancôme, Dr. Dennis Gross

Peptide Enhanced Firming Creams Market

Peptide-Enhanced Firming Creams Market Key Takeaways

Metric Value
Market Estimated Value in (2025E) USD 1,563.1 million
Market Forecast Value in (2035F) USD 5,122.5 million
Forecast CAGR (2025 to 2035) 12.6%

During the first five-year period from 2025 to 2030, the market increases from USD 1,563.1 million to USD 2,829.7 million, adding USD 1,266.6 million, which accounts for 35.6% of the total decade growth. This phase records steady adoption in premium skincare, dermatology-backed products, and consumer demand for visible anti-aging results, driven by the rise of peptides as clinically validated actives. Firming & lifting dominates this period as it caters to over 45% of consumers prioritizing skin-tightening and wrinkle-reduction efficacy.

The second half from 2030 to 2035 contributes USD 2,292.8 million, equal to 64.4% of total growth, as the market jumps from USD 2,829.7 million to USD 5,122.5 million. This acceleration is powered by widespread deployment of AI-personalized skincare regimens, biotech peptide innovations, and mass-market penetration via e-commerce platforms. Serums, ampoules, and peptide-loaded masks capture a larger share above 51% by the end of the decade. Claims such as clean-label, vegan, and fragrance-free gain strength, moving beyond niche to mainstream adoption across North America, Europe, and Asia.

From 2020 to 2024, the Peptide-Enhanced Firming Creams Market grew from USD 1,050 million to USD 1,420 million, driven by firming and anti-aging-centric adoption. During this period, the competitive landscape was dominated by multinational cosmetic giants controlling nearly 70% of revenue, with leaders such as Estée Lauder, L’Oréal, and Shiseido focusing on prestige and dermatologist-recommended peptide products. Competitive differentiation relied on clinical backing, ingredient innovation, and consumer trust, while mass-market lines often positioned peptides as an added benefit rather than a hero ingredient. Clean-label and vegan claims gained traction but contributed less than 15% of the total market value.

Demand for peptide-enhanced firming creams will expand to USD 1,563.1 million in 2025, and the revenue mix will shift as e-commerce and specialty channels grow to over 50% share. Traditional luxury leaders face rising competition from digital-first and indie beauty players offering biotech peptide blends, minimalist formulations, and subscription-based skincare routines. Major brands are pivoting to hybrid models, integrating dermatology credibility, influencer marketing, and personalized diagnostics to retain relevance. Emerging entrants specializing in multi-peptide complexes, adaptive delivery systems, and vegan formulations are gaining share. The competitive advantage is moving away from heritage brand loyalty alone to science-driven innovation, sustainability, and channel diversification.

Why the Peptide-Enhanced Firming Creams Market is growing?

Advances in cosmetic peptides have improved efficacy in boosting collagen production, skin elasticity, and moisture retention, allowing for clinically measurable anti-aging results across diverse product formats. Firming & lifting products have gained popularity due to their suitability for consumers seeking visible tightening effects and wrinkle reduction. The rise of multi-peptide complexes has contributed to enhanced skin barrier support and hydration benefits, with global consumer trust in dermatology-backed claims accelerating adoption. Industries such as premium skincare, cosmeceuticals, and professional dermatology clinics are driving demand for peptide-based firming solutions that integrate seamlessly into daily routines.

Expansion of clean-label and vegan peptide formulations has fueled market growth. Innovations in delivery formats such as serums, ampoules, and peptide masks are expected to open new application areas. Segment growth is expected to be led by firming & lifting in function, creams & lotions in product type, and pharmacies and e-commerce in distribution due to their accessibility and consumer trust.

Segmental Analysis

The market is segmented by function, product type, channel, claim, and region. Functions include firming & lifting, anti-aging & wrinkle reduction, hydration, and skin barrier support, highlighting the core drivers of peptide-based adoption. Product type classification covers creams & lotions, serums, ampoules, and masks to cater to different consumer usage preferences. Based on channel, the segmentation includes pharmacies, e-commerce, specialty beauty stores, and mass retail. In terms of claims, categories encompass dermatologist-recommended, clean-label, vegan, and fragrance-free. Regionally, the scope spans North America, Latin America, Europe, East Asia, South Asia & Pacific, and the Middle East & Africa.
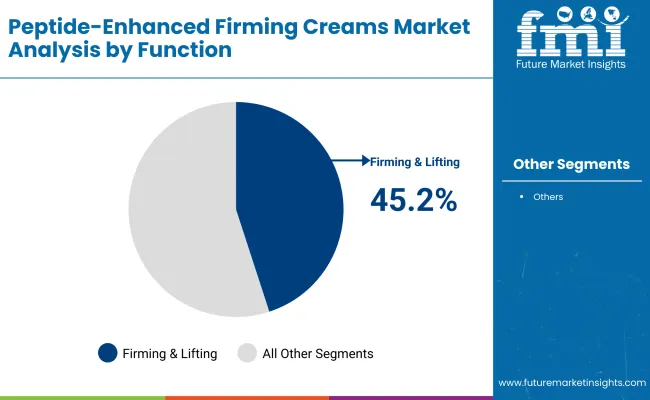
Insights into the Function Segment with Firming & Lifting Leading in Market Share

Peptide Enhanced Firming Creams Market By Function

Function Segment Market Value Share, 2025
Firming & lifting 45.2%
Others 54.8%

The firming & lifting segment is projected to contribute 45.2% of the Peptide-Enhanced Firming Creams Market revenue in 2025, maintaining its lead as the dominant function category. This is driven by ongoing demand for advanced collagen-boosting formulations and visible tightening effects. Consumers prioritize skin tone enhancement and wrinkle minimization, fueling consistent investment in firming peptide complexes.

The segment’s growth is also supported by the rising use of multi-functional peptides that deliver dual anti-aging and hydration benefits. As peptide science advances and formulations become more accessible through both premium and mid-tier ranges, firming & lifting products are expected to remain the backbone of peptide-enhanced skincare.
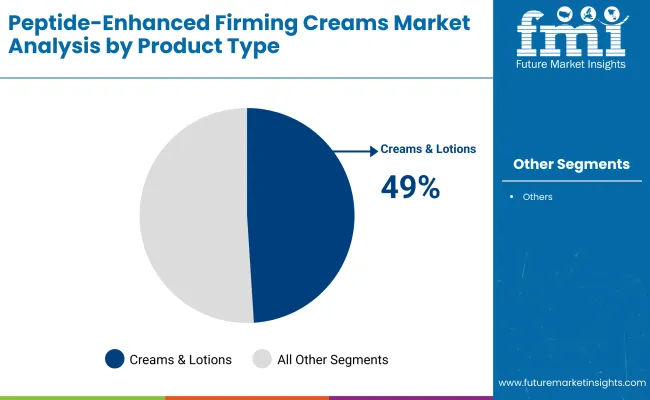
Insights into the Product Type Segment with Creams & Lotions Dominating the Demand

Peptide Enhanced Firming Creams Market By Product

Product Type Segment Market Value Share, 2025
Creams & lotions 49.0%
Others 51.0%

The creams & lotions segment is forecasted to hold 49.0% of the market share in 2025, led by its role as the most familiar and widely adopted product format. These products are favored for their versatility, convenience, and suitability for both day and night skincare routines. Creams and lotions combine peptides with other active ingredients, enhancing consumer confidence in efficacy.

Their strong positioning in pharmacies, specialty beauty stores, and mass retail has facilitated widespread adoption across demographics. The segment’s growth is further bolstered by advancements in peptide stabilization technology that improve skin penetration and bioavailability. As consumers increasingly require multifunctional daily-use products, creams & lotions are expected to continue their dominance in the market.
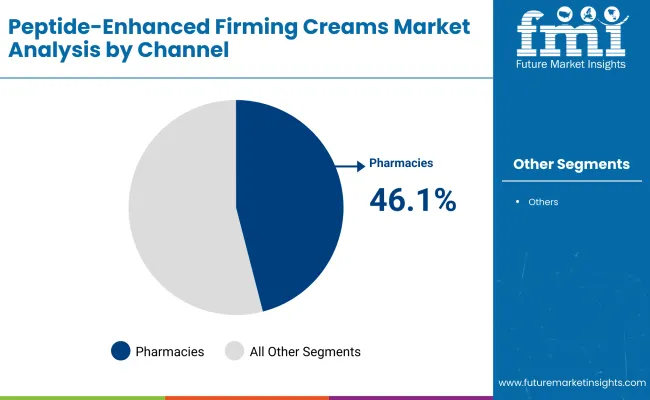
Insights into the Channel Segment with Pharmacies Leading in Market Share

Peptide Enhanced Firming Creams Market By Channel

Channel Segment Market Value Share, 2025
Pharmacies 46.1%
Others 53.9%

The pharmacies segment is projected to account for 46.1% of the Peptide-Enhanced Firming Creams Market revenue in 2025, establishing it as the leading distribution channel. Pharmacies are preferred for their credibility, trusted dermatology positioning, and access to dermatologist-recommended brands.

This segment’s growth is also driven by the expansion of pharmacy-led beauty sections and collaborations with cosmeceutical brands. While e-commerce is scaling rapidly, pharmacies remain the cornerstone of consumer confidence, particularly in North America and Europe. The segment is expected to retain its leading role, supported by premium product launches and continued consumer reliance on professional recommendations.

What are the Drivers, Restraints, and Key Trends of the Peptide-Enhanced Firming Creams Market?

Drivers

Rising Consumer Demand for Clinically Proven Anti-Aging Solutions

A primary driver of the Peptide-Enhanced Firming Creams Market is the accelerating demand for skincare solutions that deliver visible, clinically backed anti-aging outcomes. Consumers are increasingly shifting toward products that go beyond basic moisturization and target deeper concerns such as wrinkles, sagging, and fine lines. Peptides, with their proven ability to stimulate collagen synthesis and improve skin elasticity, are perceived as a gold-standard active ingredient.

The growing trust in science-backed beauty products is amplified by dermatologists endorsing peptides as safe, effective, and versatile across different skin types. This has encouraged both premium and mass-market brands to integrate peptide complexes in creams, serums, and masks, further expanding the addressable consumer base. The driver is especially strong in regions such as East Asia and North America, where awareness of peptide efficacy is amplified by strong marketing and clinical validation in brand campaigns.

Expansion of E-commerce and Specialty Beauty Retail Channels

The second major growth driver is the rapid expansion of e-commerce platforms and specialty beauty retail outlets. Online channels not only broaden product availability globally but also allow for highly personalized consumer engagement through AI-driven recommendations, subscription models, and trial-sized product offerings. Specialty beauty stores reinforce this trend by curating peptide-focused lines and providing experiential in-store demonstrations that highlight peptide efficacy.

These distribution channels bridge the gap between consumer curiosity and clinical education, boosting adoption rates. Furthermore, e-commerce has been instrumental in allowing indie and digital-first brands to compete alongside global giants, offering peptide formulations with unique claims such as vegan, fragrance-free, or clean-label positioning. The convenience of direct-to-consumer delivery has made e-commerce one of the most powerful growth accelerators for peptide-enhanced firming creams.

Restraints

High Cost of Peptide Formulations and Premium Pricing

One of the significant restraints is the high cost associated with peptide formulation, stabilization, and delivery systems. Peptides, being bioactive molecules, require advanced encapsulation and stabilization techniques to ensure they remain effective until they penetrate the skin. These technologies raise production costs, which directly influence product pricing. As a result, many peptide-enhanced firming creams are positioned as premium products, limiting their accessibility to middle-income consumers in emerging markets. The cost barrier is particularly evident in price-sensitive regions such as Latin America, South Asia, and parts of Africa, where affordability often dictates purchasing decisions. This premium price point narrows the market penetration potential despite strong consumer interest.

Competition from Alternative Anti-Aging Actives

The market also faces a restraint in the form of competition from alternative anti-aging ingredients such as retinoids, hyaluronic acid, niacinamide, and vitamin C. Many of these alternatives are widely available at lower costs, backed by decades of consumer trust and scientific validation. In fact, retinoids are often positioned as the gold standard in anti-aging, while hyaluronic acid dominates hydration and plumping claims. For consumers unfamiliar with peptides, these alternatives may seem like safer or more accessible investments. Brands must therefore invest heavily in consumer education and marketing to differentiate peptides as unique and worth the premium. Without this, peptide-enhanced creams risk being overshadowed in crowded anti-aging aisles.

Key Trends

Rise of Multi-Peptide Complexes and Personalized Skincare

A key trend shaping the Peptide-Enhanced Firming Creams Market is the shift from single-ingredient peptide creams to advanced formulations containing multi-peptide complexes. These complexes combine different peptides with complementary functions for example, one targeting collagen stimulation, another improving hydration, and a third enhancing skin barrier repair.

This “cocktail approach” not only enhances efficacy but also aligns with the consumer preference for all-in-one, multifunctional skincare solutions. Additionally, personalization is becoming central, with AI-driven diagnostic tools recommending peptide-enhanced firming creams tailored to individual skin concerns. Major players like Estée Lauder and L’Oréal are investing in peptide personalization platforms, creating a new wave of science-meets-consumer customization in beauty.

Growing Popularity of Clean-Label, Vegan, and Fragrance-Free Claims

Another trend transforming the market is the surge in demand for products that combine scientific efficacy with ethical and sustainable attributes. Clean-label, vegan, and fragrance-free claims are increasingly becoming decision-making criteria for millennial and Gen Z consumers. Brands are innovating by sourcing bio-fermented or plant-derived peptides that align with eco-conscious preferences. For instance, vegan peptide formulations are being positioned as cruelty-free alternatives to animal-derived collagen peptides.

Simultaneously, fragrance-free claims appeal to sensitive-skin consumers seeking dermatologist-recommended solutions without irritation risks. This convergence of efficacy with ethical positioning is expected to redefine the competitive landscape, with companies that adopt both innovation and sustainability gaining stronger market traction.
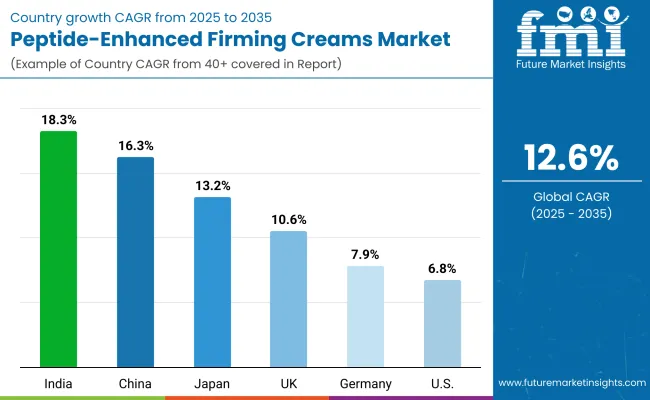
Analysis of Peptide-Enhanced Firming Creams Market By Key Countries

Peptide Enhanced Firming Creams Market By Country

Countries Estimated CAGR (2025 to 2035)
China 16.3%
USA 6.8%
India 18.3%
UK 10.6%
Germany 7.9%
Japan 13.2%

The country-level growth outlook for the Peptide-Enhanced Firming Creams Market shows clear regional contrasts, with emerging Asian economies significantly outpacing developed markets. India (18.3% CAGR) leads the forecast period, driven by rising middle-class incomes, increasing urbanization, and growing awareness of advanced skincare solutions that target aging and firming concerns. China (16.3% CAGR) follows closely, benefiting from a rapidly expanding beauty and personal care market, strong adoption of e-commerce platforms, and the willingness of consumers to experiment with innovative peptide-based formulations.

Japan (13.2% CAGR) also stands out, with a mature yet innovation-driven skincare market that values technologically advanced and functional actives such as peptides. Collectively, Asia is emerging as the powerhouse region, accounting for the fastest growth rates due to consumer demand for premium yet scientifically validated anti-aging products. In contrast, developed Western markets show moderate but steady growth. The USA (6.8% CAGR) remains the single-largest market in absolute value, supported by strong brand loyalty, dermatology-led endorsements, and rising adoption among aging demographics.

Germany (7.9% CAGR) demonstrates resilience, driven by demand for dermatologist-recommended and clean-label peptide formulations. Meanwhile, the UK (10.6% CAGR) reflects an evolving balance of luxury skincare adoption and e-commerce-driven mass-market penetration. While growth in Western regions is slower compared to Asia, these markets continue to represent high-value opportunities, particularly for premium and dermatologist-recommended peptide-enhanced firming creams. Together, these dynamics highlight how the global market’s expansion is fueled by both mature consumer trust in developed economies and surging demand in high-growth Asian markets.
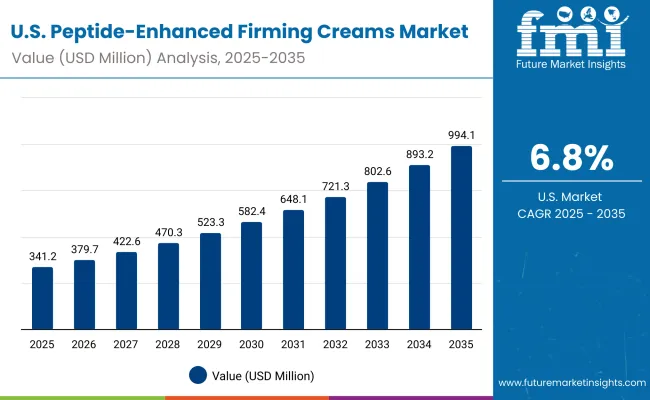
Sales Outlook for Peptide-Enhanced Firming Creams in the United States

Peptide Enhanced Firming Creams Market Usa

Year USA Peptide-Enhanced Firming Creams Market (USD Million)
2025 341.3
2026 379.8
2027 422.6
2028 470.3
2029 523.4
2030 582.4
2031 648.2
2032 721.3
2033 802.7
2034 893.3
2035 994.1

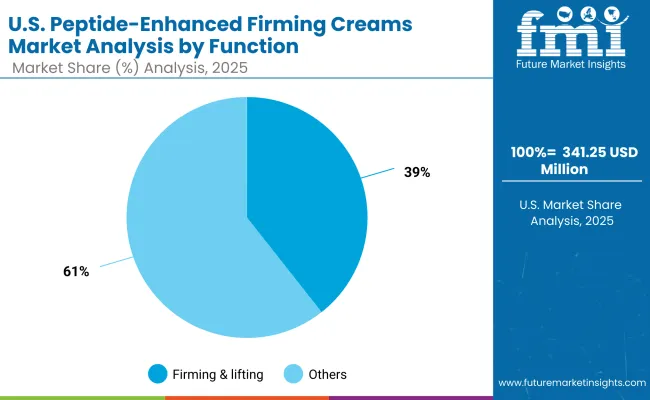
The Peptide-Enhanced Firming Creams Market in the United States is projected to grow at a CAGR of 6.8%, supported by strong consumer preference for dermatologist-recommended and clinically proven skincare products. The USA market has a high adoption rate of firming & lifting creams, which already account for nearly 39.4% of total sales in 2025. Increasing awareness around preventive anti-aging routines, coupled with the rapid expansion of clean-label and fragrance-free claims, is shaping consumer behavior. Pharmacies and specialty beauty stores remain leading channels, while e-commerce is expanding due to subscription-based models and influencer-driven promotions.

  • Firming & lifting is the largest function category, favored by aging demographics seeking collagen-boosting solutions.
  • Pharmacies remain the trusted distribution channel, but e-commerce is steadily gaining share through direct-to-consumer launches.
  • Dermatologist-recommended brands hold a competitive edge due to strong consumer trust and clinical validation.

Growth and Expansion Outlook for Peptide-Enhanced Firming Creams in the United Kingdom

The Peptide-Enhanced Firming Creams Market in the United Kingdom is expected to grow at a CAGR of 10.6%, driven by strong adoption in the premium skincare segment and rising consumer interest in vegan and clean-label claims. Luxury brands such as Lancôme, Estée Lauder, and Clinique dominate, but smaller indie brands leveraging sustainable packaging and cruelty-free peptides are gaining traction. The UK market also benefits from pharmacy chains and beauty retailers integrating peptide products into mainstream shelves, making them more accessible to middle-income consumers. Government-backed sustainability programs and consumer awareness campaigns are further supporting the rise of clean-label cosmetics.

  • Premium skincare brands dominate peptide innovation with advanced formulations.
  • Vegan and fragrance-free claims are rapidly expanding, appealing to younger demographics.
  • Specialty beauty retailers and pharmacies remain the backbone of distribution.

Growth and Expansion Outlook for Peptide-Enhanced Firming Creams in India

India is witnessing rapid growth in the Peptide-Enhanced Firming Creams Market, forecast to expand at a CAGR of 18.3% through 2035, the fastest among major economies. Rising disposable incomes, urban lifestyle shifts, and social media influence are driving awareness and willingness to invest in peptide-based skincare. While creams & lotions dominate initially, younger consumers are adopting serums and ampoules due to their lighter textures and faster absorption. E-commerce platforms like Nykaa and Amazon India are critical in making peptide-enhanced products accessible beyond metros into tier-2 and tier-3 cities.
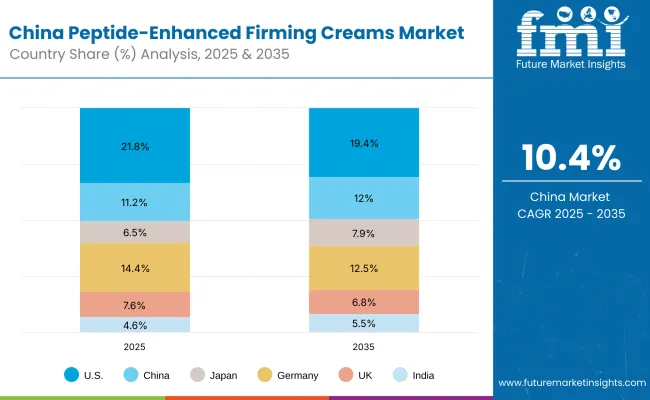
  • Tier-2 city adoption is accelerating due to e-commerce accessibility and influencer marketing.
  • Serums and ampoules are gaining ground among younger demographics seeking lightweight formats.
  • Clean-label and dermatologist-recommended products are key differentiators in building trust.

Sales Outlook for Peptide-Enhanced Firming Creams in China

Peptide Enhanced Firming Creams Market China

Countries 2025 Share (%)
USA 21.8%
China 11.2%
Japan 6.5%
Germany 14.4%
UK 7.6%
India 4.6%
Countries 2035 Share (%)
USA 19.4%
China 12.0%
Japan 7.9%
Germany 12.5%
UK 6.8%
India 5.5%

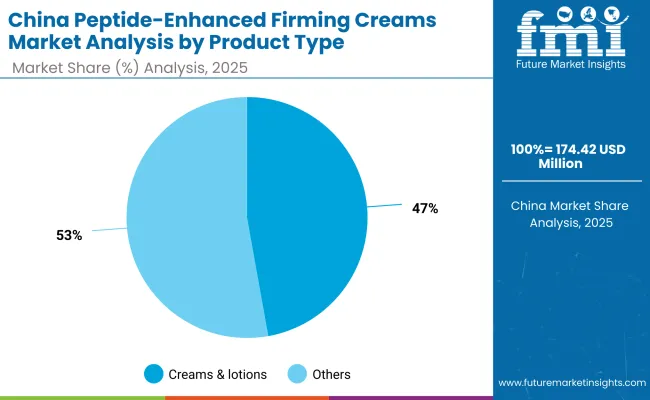
The Peptide-Enhanced Firming Creams Market in China is expected to grow at a CAGR of 16.3%, among the highest globally. Growth is led by strong demand for creams & lotions, which already account for 47.2% of the market in 2025. China’s booming e-commerce ecosystem, led by Tmall and JD.com, has made peptide-based firming creams widely accessible. Consumer appetite for innovative beauty products and functional actives is fueling adoption of both premium and mass-market peptide lines. In addition, local brands are rapidly scaling production, introducing affordable peptide products that appeal to younger consumers.
  • E-commerce dominates as the preferred sales channel, with premium and mid-tier brands thriving.
  • Local brands offering competitively priced peptide creams are gaining share against global giants.
  • Rising middle-class demand for premium skincare is accelerating segment expansion.

Opportunity Analysis of United States Peptide-Enhanced Firming Creams Market

Peptide Enhanced Firming Creams Market Usa 2

Function Segment Market Value Share, 2025
Firming & lifting 39.4%
Others 60.6%

The Peptide-Enhanced Firming Creams Market in the United States is valued at USD 341.25 million in 2025, with firming & lifting leading at 39.4%, followed by hydration, wrinkle reduction, and skin barrier support making up the remaining share. The dominance of firming & lifting reflects the USA consumer preference for visible anti-aging results, particularly among Gen X and Baby Boomer demographics who prioritize collagen-boosting actives. Dermatologist-recommended brands like Estée Lauder, Olay, and StriVectin reinforce consumer trust, further anchoring firming formulations as the core function.

This advantage positions firming & lifting creams as the backbone of the USA anti-aging segment, appealing to both high-income consumers in luxury retail and middle-income groups through pharmacy and mass-market lines. Hydration-focused creams maintain relevance in multipurpose daily skincare routines, but firming peptides remain the differentiator in premium-priced offerings. As e-commerce platforms expand subscription-based skincare bundles and AI-driven personalization tools, adoption will intensify, making the USA a mature yet steadily growing market.
  • Market size for the USA in 2025 is USD 341.25 million
  • Global market share is approximately 21.8% in 2025
  • Firming & lifting leads at 39.4% due to high demand for visible anti-aging efficacy

Opportunity Analysis of China Peptide-Enhanced Firming Creams Market

Peptide Enhanced Firming Creams Market China 2

Product Type Segment Market Value Share, 2025
Creams & lotions 47.2%
Others 52.8%

The Peptide-Enhanced Firming Creams Market in China is valued at USD 174.42 million in 2025, with creams & lotions leading at 47.2%, followed by serums, ampoules, and masks. The dominance of creams & lotions stems from their mass appeal as versatile formats, suited to both anti-aging prevention in younger consumers and firming routines among aging populations. The rapid adoption of peptides in China reflects strong beauty culture dynamics, where skincare routines emphasize multi-step regimens and functional actives. International luxury brands compete with fast-scaling domestic players, many of whom are leveraging affordable peptide formulations to capture e-commerce-driven demand.

This advantage positions creams & lotions as the first point of entry for peptide-based skincare, especially among first-time adopters in urban middle-class segments. Serums and ampoules, however, are projected to rise faster, driven by professional dermatology clinics and K-beauty-inspired product layering. With China’s fast CAGR of 16.3%, the peptide category is evolving beyond premium exclusivity into mass-market adoption, making it one of the most dynamic growth opportunities globally.
  • Market size for China in 2025 is USD 174.42 million
  • Global market share is approximately 11.2% in 2025
  • Creams & lotions lead at 47.2% due to versatility and mass-market accessibility

Competitive Landscape of Peptide-Enhanced Firming Creams Market

Peptide Enhanced Firming Creams Market By Company

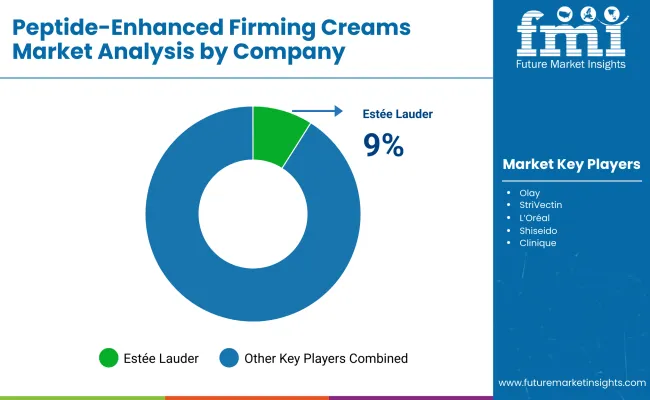
The Peptide-Enhanced Firming Creams Market is moderately fragmented, with multinational beauty giants, niche peptide specialists, and digital-first challengers competing across diverse consumer segments. Estée Lauder leads with a 9.0% share, backed by its advanced peptide lines such as Perfectionist and Clinique Smart. Its dominance is driven by clinical validation, strong dermatologist endorsements, and a powerful retail and e-commerce footprint. L’Oréal, Olay, Shiseido, and Lancôme closely follow, emphasizing innovation in multi-peptide complexes, luxury brand positioning, and aggressive marketing through pharmacies and specialty beauty stores.

Established mid-tier players like StriVectin, Murad, Paula’s Choice, and Dr. Dennis Gross focus on targeted, science-driven positioning. Their strength lies in concentrated peptide serums, anti-wrinkle ampoules, and dermatologist-approved claims, which resonate strongly with informed consumers seeking clinical-grade efficacy. Many of these brands are expanding through e-commerce exclusives, direct-to-consumer subscriptions, and international cross-border sales into Asia-Pacific.

Meanwhile, niche players and indie beauty brands are gaining visibility by offering vegan, fragrance-free, and clean-label peptide formulations. Their agility in responding to ethical beauty trends and transparency in ingredient sourcing gives them an edge in markets like the UK, Germany, and South Korea. Competitive differentiation is shifting away from luxury branding alone to a combination of scientific efficacy, sustainability, and digital personalization. Brands that successfully integrate peptide innovation with broader consumer values are expected to secure long-term loyalty.

Key Developments in Peptide-Enhanced Firming Creams Market

  • On March 15, 2024, Estée Lauder expanded its Advanced Night Repair line with a multi-peptide firming cream targeting collagen renewal, integrating AI-powered diagnostics to customize recommendations at the point of sale.
  • On July 22, 2024, Olay introduced its Super Peptide 24 Cream in USA pharmacies and online, focusing on accessibility with dermatologist-recommended claims at mid-tier pricing to bridge luxury and mass-market demand.

Scope of the Report

Item Value
Quantitative Units USD 1,563.1 million
Function Firming & lifting, Anti-aging & wrinkle reduction, Hydration, Skin barrier support
Product Type Creams & lotions, Serums, Ampoules, Masks
Channel Pharmacies, E-commerce, Specialty beauty stores, Mass retail
Claim Dermatologist-recommended, Clean-label, Vegan, Fragrance-free
Regions Covered North America, Europe, Asia-Pacific, Latin America, Middle East & Africa
Country Covered United States, Canada, Germany, France, United Kingdom, China, Japan, India, Brazil, South Africa
Key Companies Profiled Estée Lauder, Olay, StriVectin, L’Oréal, Shiseido, Clinique, Paula’s Choice, Murad, Lancôme, Dr. Dennis Gross
Additional Attributes Dollar sales by function and product type, adoption trends in firming & lifting and hydration skincare, rising demand for dermatologist-recommended and clean-label claims, segment-specific growth in creams & lotions and serums, expansion of e-commerce and specialty retail channels, integration of vegan and fragrance-free attributes, regional trends influenced by K-beauty and Western dermatology, and innovations in multi-peptide complexes and advanced delivery systems.

Key Segments

By Function:

  • Hydration
  • Firming & lifting
  • Anti-aging & wrinkle reduction
  • Skin barrier support

By Product Type:

  • Serums
  • Creams & lotions
  • Ampoules
  • Mists

By Channel:

  • E-commerce
  • Pharmacies
  • Mass retail
  • Specialty beauty stores

By Claim:

  • Natural/organic
  • Vegan
  • Fragrance-free
  • Clean-label

By Region:

  • North America
  • Latin America
  • Europe
  • East Asia
  • South Asia & Pacific
  • Middle East and Africa

Frequently Asked Questions

How big is the Peptide-Enhanced Firming Creams Market in 2025?

The Peptide-Enhanced Firming Creams Market is estimated to be valued at USD 1,563.1 million in 2025.

What will be the size of the Peptide-Enhanced Firming Creams Market in 2035?

The market size for the Peptide-Enhanced Firming Creams Market is projected to reach USD 5,122.5 million by 2035.

How much will be the Peptide-Enhanced Firming Creams Market growth between 2025 and 2035?

The Peptide-Enhanced Firming Creams Market is expected to grow at a 12.6% CAGR between 2025 and 2035.

What are the key product types in the Peptide-Enhanced Firming Creams Market?

The key product types in the Peptide-Enhanced Firming Creams Market are creams & lotions, serums, ampoules, and masks.

Which function segment will contribute significant share in the Peptide-Enhanced Firming Creams Market in 2025?

In terms of function, the firming & lifting segment is projected to command USD 706.4 million (45.2% share) in the Peptide-Enhanced Firming Creams Market in 2025.

Table of Content

  1. Executive Summary
    • Global Market Outlook
    • Demand-side Trends
    • Supply-side Trends
    • Technology Roadmap Analysis
    • Analysis and Recommendations
  2. Market Overview
    • Market Coverage / Taxonomy
    • Market Definition / Scope / Limitations
  3. Market Background
    • Market Dynamics
      • Drivers
      • Restraints
      • Opportunity
      • Trends
    • Scenario Forecast
      • Demand in Optimistic Scenario
      • Demand in Likely Scenario
      • Demand in Conservative Scenario
    • Opportunity Map Analysis
    • Product Life Cycle Analysis
    • Supply Chain Analysis
      • Supply Side Participants and their Roles
        • Producers
        • Mid-Level Participants (Traders/ Agents/ Brokers)
        • Wholesalers and Distributors
      • Value Added and Value Created at Node in the Supply Chain
      • List of Raw Material Suppliers
      • List of Existing and Potential Buyer’s
    • Investment Feasibility Matrix
    • Value Chain Analysis
      • Profit Margin Analysis
      • Wholesalers and Distributors
      • Retailers
    • PESTLE and Porter’s Analysis
    • Regulatory Landscape
      • By Key Regions
      • By Key Countries
    • Regional Parent Market Outlook
    • Production and Consumption Statistics
    • Import and Export Statistics
  4. Global Market Analysis 2020 to 2024 and Forecast, 2025 to 2035
    • Historical Market Size Value (USD Million) & Volume (Units) Analysis, 2020 to 2024
    • Current and Future Market Size Value (USD Million) & Volume (Units) Projections, 2025 to 2035
      • Y-o-Y Growth Trend Analysis
      • Absolute $ Opportunity Analysis
  5. Global Market Analysis 2020 to 2024 and Forecast 2025 to 2035, By Function
    • Introduction / Key Findings
    • Historical Market Size Value (USD Million) & Volume (Units) Analysis By Function, 2020 to 2024
    • Current and Future Market Size Value (USD Million) & Volume (Units) Analysis and Forecast By Function, 2025 to 2035
      • Hydration
      • Firming & lifting
      • Anti-aging & wrinkle reduction
      • Skin barrier support
    • Y-o-Y Growth Trend Analysis By Function, 2020 to 2024
    • Absolute $ Opportunity Analysis By Function, 2025 to 2035
  6. Global Market Analysis 2020 to 2024 and Forecast 2025 to 2035, By Product Type
    • Introduction / Key Findings
    • Historical Market Size Value (USD Million) & Volume (Units) Analysis By Product Type, 2020 to 2024
    • Current and Future Market Size Value (USD Million) & Volume (Units) Analysis and Forecast By Product Type, 2025 to 2035
      • Serums
      • Creams & lotions
      • Ampoules
      • Mists
    • Y-o-Y Growth Trend Analysis By Product Type, 2020 to 2024
    • Absolute $ Opportunity Analysis By Product Type, 2025 to 2035
  7. Global Market Analysis 2020 to 2024 and Forecast 2025 to 2035, By Channel
    • Introduction / Key Findings
    • Historical Market Size Value (USD Million) & Volume (Units) Analysis By Channel, 2020 to 2024
    • Current and Future Market Size Value (USD Million) & Volume (Units) Analysis and Forecast By Channel, 2025 to 2035
      • E-commerce
      • Pharmacies
      • Mass retail
      • Specialty beauty stores
    • Y-o-Y Growth Trend Analysis By Channel, 2020 to 2024
    • Absolute $ Opportunity Analysis By Channel, 2025 to 2035
  8. Global Market Analysis 2020 to 2024 and Forecast 2025 to 2035, By Claim
    • Introduction / Key Findings
    • Historical Market Size Value (USD Million) & Volume (Units) Analysis By Claim, 2020 to 2024
    • Current and Future Market Size Value (USD Million) & Volume (Units) Analysis and Forecast By Claim, 2025 to 2035
      • Natural/organic
      • Vegan
      • Fragrance-free
      • Clean-label
    • Y-o-Y Growth Trend Analysis By Claim, 2020 to 2024
    • Absolute $ Opportunity Analysis By Claim, 2025 to 2035
  9. Global Market Analysis 2020 to 2024 and Forecast 2025 to 2035, By Region
    • Introduction
    • Historical Market Size Value (USD Million) & Volume (Units) Analysis By Region, 2020 to 2024
    • Current Market Size Value (USD Million) & Volume (Units) Analysis and Forecast By Region, 2025 to 2035
      • North America
      • Latin America
      • Europe
      • East Asia
      • South Asia & Pacific
      • Middle East and Africa
    • Market Attractiveness Analysis By Region
  10. North America Market Analysis 2020 to 2024 and Forecast 2025 to 2035, By Country
    • Historical Market Size Value (USD Million) & Volume (Units) Trend Analysis By Market Taxonomy, 2020 to 2024
    • Market Size Value (USD Million) & Volume (Units) Forecast By Market Taxonomy, 2025 to 2035
      • By Country
        • USA
        • Canada
      • By Function
      • By Product Type
      • By Channel
      • By Claim
    • Market Attractiveness Analysis
      • By Country
      • By Function
      • By Product Type
      • By Channel
      • By Claim
    • Key Takeaways
  11. Latin America Market Analysis 2020 to 2024 and Forecast 2025 to 2035, By Country
    • Historical Market Size Value (USD Million) & Volume (Units) Trend Analysis By Market Taxonomy, 2020 to 2024
    • Market Size Value (USD Million) & Volume (Units) Forecast By Market Taxonomy, 2025 to 2035
      • By Country
        • Brazil
        • Mexico
        • Colombia
        • Rest of Latin America
      • By Function
      • By Product Type
      • By Channel
      • By Claim
    • Market Attractiveness Analysis
      • By Country
      • By Function
      • By Product Type
      • By Channel
      • By Claim
    • Key Takeaways
  12. Europe Market Analysis 2020 to 2024 and Forecast 2025 to 2035, By Country
    • Historical Market Size Value (USD Million) & Volume (Units) Trend Analysis By Market Taxonomy, 2020 to 2024
    • Market Size Value (USD Million) & Volume (Units) Forecast By Market Taxonomy, 2025 to 2035
      • By Country
        • Germany
        • UK
        • France
        • Italy
        • Spain
        • Belgium
        • Netherlands
        • Nordic
        • Switzerland
        • Russia
        • Poland
        • Rest of Europe
      • By Function
      • By Product Type
      • By Channel
      • By Claim
    • Market Attractiveness Analysis
      • By Country
      • By Function
      • By Product Type
      • By Channel
      • By Claim
    • Key Takeaways
  13. East Asia Market Analysis 2020 to 2024 and Forecast 2025 to 2035, By Country
    • Historical Market Size Value (USD Million) & Volume (Units) Trend Analysis By Market Taxonomy, 2020 to 2024
    • Market Size Value (USD Million) & Volume (Units) Forecast By Market Taxonomy, 2025 to 2035
      • By Country
        • China
        • Japan
        • South Korea
      • By Function
      • By Product Type
      • By Channel
      • By Claim
    • Market Attractiveness Analysis
      • By Country
      • By Function
      • By Product Type
      • By Channel
      • By Claim
    • Key Takeaways
  14. South Asia & Pacific Market Analysis 2020 to 2024 and Forecast 2025 to 2035, By Country
    • Historical Market Size Value (USD Million) & Volume (Units) Trend Analysis By Market Taxonomy, 2020 to 2024
    • Market Size Value (USD Million) & Volume (Units) Forecast By Market Taxonomy, 2025 to 2035
      • By Country
        • India
        • Thailand
        • Malaysia
        • Indonesia
        • Singapore
        • Vietnam
        • Australia
        • New Zealand
        • Rest of South Asia
      • By Function
      • By Product Type
      • By Channel
      • By Claim
    • Market Attractiveness Analysis
      • By Country
      • By Function
      • By Product Type
      • By Channel
      • By Claim
    • Key Takeaways
  15. Middle East and Africa Market Analysis 2020 to 2024 and Forecast 2025 to 2035, By Country
    • Historical Market Size Value (USD Million) & Volume (Units) Trend Analysis By Market Taxonomy, 2020 to 2024
    • Market Size Value (USD Million) & Volume (Units) Forecast By Market Taxonomy, 2025 to 2035
      • By Country
        • Turkey
        • UAE
        • Saudi Arabia
        • Israel
        • Other GCC Countries
        • North Africa
        • South Africa
      • By Function
      • By Product Type
      • By Channel
      • By Claim
    • Market Attractiveness Analysis
      • By Country
      • By Function
      • By Product Type
      • By Channel
      • By Claim
    • Key Takeaways
  16. Key Countries Market Analysis
    • USA
      • Pricing Analysis
      • Market Share Analysis, 2024
        • By Function
        • By Product Type
        • By Channel
        • By Claim
    • Canada
      • Pricing Analysis
      • Market Share Analysis, 2024
        • By Function
        • By Product Type
        • By Channel
        • By Claim
    • Brazil
      • Pricing Analysis
      • Market Share Analysis, 2024
        • By Function
        • By Product Type
        • By Channel
        • By Claim
    • Mexico
      • Pricing Analysis
      • Market Share Analysis, 2024
        • By Function
        • By Product Type
        • By Channel
        • By Claim
    • Colombia
      • Pricing Analysis
      • Market Share Analysis, 2024
        • By Function
        • By Product Type
        • By Channel
        • By Claim
    • Germany
      • Pricing Analysis
      • Market Share Analysis, 2024
        • By Function
        • By Product Type
        • By Channel
        • By Claim
    • UK
      • Pricing Analysis
      • Market Share Analysis, 2024
        • By Function
        • By Product Type
        • By Channel
        • By Claim
    • France
      • Pricing Analysis
      • Market Share Analysis, 2024
        • By Function
        • By Product Type
        • By Channel
        • By Claim
    • Italy
      • Pricing Analysis
      • Market Share Analysis, 2024
        • By Function
        • By Product Type
        • By Channel
        • By Claim
    • Spain
      • Pricing Analysis
      • Market Share Analysis, 2024
        • By Function
        • By Product Type
        • By Channel
        • By Claim
    • Belgium
      • Pricing Analysis
      • Market Share Analysis, 2024
        • By Function
        • By Product Type
        • By Channel
        • By Claim
    • Netherlands
      • Pricing Analysis
      • Market Share Analysis, 2024
        • By Function
        • By Product Type
        • By Channel
        • By Claim
    • Nordic
      • Pricing Analysis
      • Market Share Analysis, 2024
        • By Function
        • By Product Type
        • By Channel
        • By Claim
    • Switzerland
      • Pricing Analysis
      • Market Share Analysis, 2024
        • By Function
        • By Product Type
        • By Channel
        • By Claim
    • Russia
      • Pricing Analysis
      • Market Share Analysis, 2024
        • By Function
        • By Product Type
        • By Channel
        • By Claim
    • Poland
      • Pricing Analysis
      • Market Share Analysis, 2024
        • By Function
        • By Product Type
        • By Channel
        • By Claim
    • China
      • Pricing Analysis
      • Market Share Analysis, 2024
        • By Function
        • By Product Type
        • By Channel
        • By Claim
    • Japan
      • Pricing Analysis
      • Market Share Analysis, 2024
        • By Function
        • By Product Type
        • By Channel
        • By Claim
    • South Korea
      • Pricing Analysis
      • Market Share Analysis, 2024
        • By Function
        • By Product Type
        • By Channel
        • By Claim
    • India
      • Pricing Analysis
      • Market Share Analysis, 2024
        • By Function
        • By Product Type
        • By Channel
        • By Claim
    • Thailand
      • Pricing Analysis
      • Market Share Analysis, 2024
        • By Function
        • By Product Type
        • By Channel
        • By Claim
    • Indonesia
      • Pricing Analysis
      • Market Share Analysis, 2024
        • By Function
        • By Product Type
        • By Channel
        • By Claim
    • Australia
      • Pricing Analysis
      • Market Share Analysis, 2024
        • By Function
        • By Product Type
        • By Channel
        • By Claim
    • New Zealand
      • Pricing Analysis
      • Market Share Analysis, 2024
        • By Function
        • By Product Type
        • By Channel
        • By Claim
    • Turkey
      • Pricing Analysis
      • Market Share Analysis, 2024
        • By Function
        • By Product Type
        • By Channel
        • By Claim
    • UAE
      • Pricing Analysis
      • Market Share Analysis, 2024
        • By Function
        • By Product Type
        • By Channel
        • By Claim
    • Saudi Arabia
      • Pricing Analysis
      • Market Share Analysis, 2024
        • By Function
        • By Product Type
        • By Channel
        • By Claim
    • Israel
      • Pricing Analysis
      • Market Share Analysis, 2024
        • By Function
        • By Product Type
        • By Channel
        • By Claim
    • North Africa
      • Pricing Analysis
      • Market Share Analysis, 2024
        • By Function
        • By Product Type
        • By Channel
        • By Claim
    • South Africa
      • Pricing Analysis
      • Market Share Analysis, 2024
        • By Function
        • By Product Type
        • By Channel
        • By Claim
  17. Market Structure Analysis
    • Competition Dashboard
    • Competition Benchmarking
    • Market Share Analysis of Top Players
      • By Regional
      • By Function
      • By Product Type
      • By Channel
      • By Claim
  18. Competition Analysis
    • Competition Deep Dive
      • Estée Lauder
        • Overview
        • Product Portfolio
        • Profitability by Market Segments (Product/Age /Sales Channel/Region)
        • Sales Footprint
        • Strategy Overview
          • Marketing Strategy
          • Product Strategy
          • Channel Strategy
      • Olay
        • Overview
        • Product Portfolio
        • Profitability by Market Segments (Product/Age /Sales Channel/Region)
        • Sales Footprint
        • Strategy Overview
          • Marketing Strategy
          • Product Strategy
          • Channel Strategy
      • StriVectin
        • Overview
        • Product Portfolio
        • Profitability by Market Segments (Product/Age /Sales Channel/Region)
        • Sales Footprint
        • Strategy Overview
          • Marketing Strategy
          • Product Strategy
          • Channel Strategy
      • L’Oréal
        • Overview
        • Product Portfolio
        • Profitability by Market Segments (Product/Age /Sales Channel/Region)
        • Sales Footprint
        • Strategy Overview
          • Marketing Strategy
          • Product Strategy
          • Channel Strategy
      • Shiseido
        • Overview
        • Product Portfolio
        • Profitability by Market Segments (Product/Age /Sales Channel/Region)
        • Sales Footprint
        • Strategy Overview
          • Marketing Strategy
          • Product Strategy
          • Channel Strategy
      • Clinique
        • Overview
        • Product Portfolio
        • Profitability by Market Segments (Product/Age /Sales Channel/Region)
        • Sales Footprint
        • Strategy Overview
          • Marketing Strategy
          • Product Strategy
          • Channel Strategy
      • Paula’s Choice
        • Overview
        • Product Portfolio
        • Profitability by Market Segments (Product/Age /Sales Channel/Region)
        • Sales Footprint
        • Strategy Overview
          • Marketing Strategy
          • Product Strategy
          • Channel Strategy
      • Murad
        • Overview
        • Product Portfolio
        • Profitability by Market Segments (Product/Age /Sales Channel/Region)
        • Sales Footprint
        • Strategy Overview
          • Marketing Strategy
          • Product Strategy
          • Channel Strategy
      • Lancôme
        • Overview
        • Product Portfolio
        • Profitability by Market Segments (Product/Age /Sales Channel/Region)
        • Sales Footprint
        • Strategy Overview
          • Marketing Strategy
          • Product Strategy
          • Channel Strategy
      • Dr. Dennis Gross
        • Overview
        • Product Portfolio
        • Profitability by Market Segments (Product/Age /Sales Channel/Region)
        • Sales Footprint
        • Strategy Overview
          • Marketing Strategy
          • Product Strategy
          • Channel Strategy
  19. Assumptions & Acronyms Used
  20. Research Methodology

List of Tables

  • Table 1: Global Market Value (USD Million) Forecast by Region, 2020-2035
  • Table 2: Global Market Volume (Units) Forecast by Region, 2020-2035
  • Table 3: Global Market Value (USD Million) Forecast by Function, 2020-2035
  • Table 4: Global Market Volume (Units) Forecast by Function, 2020-2035
  • Table 5: Global Market Value (USD Million) Forecast by Product Type, 2020-2035
  • Table 6: Global Market Volume (Units) Forecast by Product Type, 2020-2035
  • Table 7: Global Market Value (USD Million) Forecast by Channel, 2020-2035
  • Table 8: Global Market Volume (Units) Forecast by Channel, 2020-2035
  • Table 9: Global Market Value (USD Million) Forecast by Claim, 2020-2035
  • Table 10: Global Market Volume (Units) Forecast by Claim, 2020-2035
  • Table 11: North America Market Value (USD Million) Forecast by Country, 2020-2035
  • Table 12: North America Market Volume (Units) Forecast by Country, 2020-2035
  • Table 13: North America Market Value (USD Million) Forecast by Function, 2020-2035
  • Table 14: North America Market Volume (Units) Forecast by Function, 2020-2035
  • Table 15: North America Market Value (USD Million) Forecast by Product Type, 2020-2035
  • Table 16: North America Market Volume (Units) Forecast by Product Type, 2020-2035
  • Table 17: North America Market Value (USD Million) Forecast by Channel, 2020-2035
  • Table 18: North America Market Volume (Units) Forecast by Channel, 2020-2035
  • Table 19: North America Market Value (USD Million) Forecast by Claim, 2020-2035
  • Table 20: North America Market Volume (Units) Forecast by Claim, 2020-2035
  • Table 21: Latin America Market Value (USD Million) Forecast by Country, 2020-2035
  • Table 22: Latin America Market Volume (Units) Forecast by Country, 2020-2035
  • Table 23: Latin America Market Value (USD Million) Forecast by Function, 2020-2035
  • Table 24: Latin America Market Volume (Units) Forecast by Function, 2020-2035
  • Table 25: Latin America Market Value (USD Million) Forecast by Product Type, 2020-2035
  • Table 26: Latin America Market Volume (Units) Forecast by Product Type, 2020-2035
  • Table 27: Latin America Market Value (USD Million) Forecast by Channel, 2020-2035
  • Table 28: Latin America Market Volume (Units) Forecast by Channel, 2020-2035
  • Table 29: Latin America Market Value (USD Million) Forecast by Claim, 2020-2035
  • Table 30: Latin America Market Volume (Units) Forecast by Claim, 2020-2035
  • Table 31: Europe Market Value (USD Million) Forecast by Country, 2020-2035
  • Table 32: Europe Market Volume (Units) Forecast by Country, 2020-2035
  • Table 33: Europe Market Value (USD Million) Forecast by Function, 2020-2035
  • Table 34: Europe Market Volume (Units) Forecast by Function, 2020-2035
  • Table 35: Europe Market Value (USD Million) Forecast by Product Type, 2020-2035
  • Table 36: Europe Market Volume (Units) Forecast by Product Type, 2020-2035
  • Table 37: Europe Market Value (USD Million) Forecast by Channel, 2020-2035
  • Table 38: Europe Market Volume (Units) Forecast by Channel, 2020-2035
  • Table 39: Europe Market Value (USD Million) Forecast by Claim, 2020-2035
  • Table 40: Europe Market Volume (Units) Forecast by Claim, 2020-2035
  • Table 41: East Asia Market Value (USD Million) Forecast by Country, 2020-2035
  • Table 42: East Asia Market Volume (Units) Forecast by Country, 2020-2035
  • Table 43: East Asia Market Value (USD Million) Forecast by Function, 2020-2035
  • Table 44: East Asia Market Volume (Units) Forecast by Function, 2020-2035
  • Table 45: East Asia Market Value (USD Million) Forecast by Product Type, 2020-2035
  • Table 46: East Asia Market Volume (Units) Forecast by Product Type, 2020-2035
  • Table 47: East Asia Market Value (USD Million) Forecast by Channel, 2020-2035
  • Table 48: East Asia Market Volume (Units) Forecast by Channel, 2020-2035
  • Table 49: East Asia Market Value (USD Million) Forecast by Claim, 2020-2035
  • Table 50: East Asia Market Volume (Units) Forecast by Claim, 2020-2035
  • Table 51: South Asia & Pacific Market Value (USD Million) Forecast by Country, 2020-2035
  • Table 52: South Asia & Pacific Market Volume (Units) Forecast by Country, 2020-2035
  • Table 53: South Asia & Pacific Market Value (USD Million) Forecast by Function, 2020-2035
  • Table 54: South Asia & Pacific Market Volume (Units) Forecast by Function, 2020-2035
  • Table 55: South Asia & Pacific Market Value (USD Million) Forecast by Product Type, 2020-2035
  • Table 56: South Asia & Pacific Market Volume (Units) Forecast by Product Type, 2020-2035
  • Table 57: South Asia & Pacific Market Value (USD Million) Forecast by Channel, 2020-2035
  • Table 58: South Asia & Pacific Market Volume (Units) Forecast by Channel, 2020-2035
  • Table 59: South Asia & Pacific Market Value (USD Million) Forecast by Claim, 2020-2035
  • Table 60: South Asia & Pacific Market Volume (Units) Forecast by Claim, 2020-2035
  • Table 61: Middle East and Africa Market Value (USD Million) Forecast by Country, 2020-2035
  • Table 62: Middle East and Africa Market Volume (Units) Forecast by Country, 2020-2035
  • Table 63: Middle East and Africa Market Value (USD Million) Forecast by Function, 2020-2035
  • Table 64: Middle East and Africa Market Volume (Units) Forecast by Function, 2020-2035
  • Table 65: Middle East and Africa Market Value (USD Million) Forecast by Product Type, 2020-2035
  • Table 66: Middle East and Africa Market Volume (Units) Forecast by Product Type, 2020-2035
  • Table 67: Middle East and Africa Market Value (USD Million) Forecast by Channel, 2020-2035
  • Table 68: Middle East and Africa Market Volume (Units) Forecast by Channel, 2020-2035
  • Table 69: Middle East and Africa Market Value (USD Million) Forecast by Claim, 2020-2035
  • Table 70: Middle East and Africa Market Volume (Units) Forecast by Claim, 2020-2035

List of Figures

  • Figure 1: Global Market Value (USD Million) by Function, 2025-2035
  • Figure 2: Global Market Value (USD Million) by Product Type, 2025-2035
  • Figure 3: Global Market Value (USD Million) by Channel, 2025-2035
  • Figure 4: Global Market Value (USD Million) by Claim, 2025-2035
  • Figure 5: Global Market Value (USD Million) by Region, 2025-2035
  • Figure 6: Global Market Value (USD Million) Analysis by Region, 2020-2035
  • Figure 7: Global Market Volume (Units) Analysis by Region, 2020-2035
  • Figure 8: Global Market Value Share (%) and BPS Analysis by Region, 2025-2035
  • Figure 9: Global Market Y-o-Y Growth (%) Projections by Region, 2025-2035
  • Figure 10: Global Market Value (USD Million) Analysis by Function, 2020-2035
  • Figure 11: Global Market Volume (Units) Analysis by Function, 2020-2035
  • Figure 12: Global Market Value Share (%) and BPS Analysis by Function, 2025-2035
  • Figure 13: Global Market Y-o-Y Growth (%) Projections by Function, 2025-2035
  • Figure 14: Global Market Value (USD Million) Analysis by Product Type, 2020-2035
  • Figure 15: Global Market Volume (Units) Analysis by Product Type, 2020-2035
  • Figure 16: Global Market Value Share (%) and BPS Analysis by Product Type, 2025-2035
  • Figure 17: Global Market Y-o-Y Growth (%) Projections by Product Type, 2025-2035
  • Figure 18: Global Market Value (USD Million) Analysis by Channel, 2020-2035
  • Figure 19: Global Market Volume (Units) Analysis by Channel, 2020-2035
  • Figure 20: Global Market Value Share (%) and BPS Analysis by Channel, 2025-2035
  • Figure 21: Global Market Y-o-Y Growth (%) Projections by Channel, 2025-2035
  • Figure 22: Global Market Value (USD Million) Analysis by Claim, 2020-2035
  • Figure 23: Global Market Volume (Units) Analysis by Claim, 2020-2035
  • Figure 24: Global Market Value Share (%) and BPS Analysis by Claim, 2025-2035
  • Figure 25: Global Market Y-o-Y Growth (%) Projections by Claim, 2025-2035
  • Figure 26: Global Market Attractiveness by Function, 2025-2035
  • Figure 27: Global Market Attractiveness by Product Type, 2025-2035
  • Figure 28: Global Market Attractiveness by Channel, 2025-2035
  • Figure 29: Global Market Attractiveness by Claim, 2025-2035
  • Figure 30: Global Market Attractiveness by Region, 2025-2035
  • Figure 31: North America Market Value (USD Million) by Function, 2025-2035
  • Figure 32: North America Market Value (USD Million) by Product Type, 2025-2035
  • Figure 33: North America Market Value (USD Million) by Channel, 2025-2035
  • Figure 34: North America Market Value (USD Million) by Claim, 2025-2035
  • Figure 35: North America Market Value (USD Million) by Country, 2025-2035
  • Figure 36: North America Market Value (USD Million) Analysis by Country, 2020-2035
  • Figure 37: North America Market Volume (Units) Analysis by Country, 2020-2035
  • Figure 38: North America Market Value Share (%) and BPS Analysis by Country, 2025-2035
  • Figure 39: North America Market Y-o-Y Growth (%) Projections by Country, 2025-2035
  • Figure 40: North America Market Value (USD Million) Analysis by Function, 2020-2035
  • Figure 41: North America Market Volume (Units) Analysis by Function, 2020-2035
  • Figure 42: North America Market Value Share (%) and BPS Analysis by Function, 2025-2035
  • Figure 43: North America Market Y-o-Y Growth (%) Projections by Function, 2025-2035
  • Figure 44: North America Market Value (USD Million) Analysis by Product Type, 2020-2035
  • Figure 45: North America Market Volume (Units) Analysis by Product Type, 2020-2035
  • Figure 46: North America Market Value Share (%) and BPS Analysis by Product Type, 2025-2035
  • Figure 47: North America Market Y-o-Y Growth (%) Projections by Product Type, 2025-2035
  • Figure 48: North America Market Value (USD Million) Analysis by Channel, 2020-2035
  • Figure 49: North America Market Volume (Units) Analysis by Channel, 2020-2035
  • Figure 50: North America Market Value Share (%) and BPS Analysis by Channel, 2025-2035
  • Figure 51: North America Market Y-o-Y Growth (%) Projections by Channel, 2025-2035
  • Figure 52: North America Market Value (USD Million) Analysis by Claim, 2020-2035
  • Figure 53: North America Market Volume (Units) Analysis by Claim, 2020-2035
  • Figure 54: North America Market Value Share (%) and BPS Analysis by Claim, 2025-2035
  • Figure 55: North America Market Y-o-Y Growth (%) Projections by Claim, 2025-2035
  • Figure 56: North America Market Attractiveness by Function, 2025-2035
  • Figure 57: North America Market Attractiveness by Product Type, 2025-2035
  • Figure 58: North America Market Attractiveness by Channel, 2025-2035
  • Figure 59: North America Market Attractiveness by Claim, 2025-2035
  • Figure 60: North America Market Attractiveness by Country, 2025-2035
  • Figure 61: Latin America Market Value (USD Million) by Function, 2025-2035
  • Figure 62: Latin America Market Value (USD Million) by Product Type, 2025-2035
  • Figure 63: Latin America Market Value (USD Million) by Channel, 2025-2035
  • Figure 64: Latin America Market Value (USD Million) by Claim, 2025-2035
  • Figure 65: Latin America Market Value (USD Million) by Country, 2025-2035
  • Figure 66: Latin America Market Value (USD Million) Analysis by Country, 2020-2035
  • Figure 67: Latin America Market Volume (Units) Analysis by Country, 2020-2035
  • Figure 68: Latin America Market Value Share (%) and BPS Analysis by Country, 2025-2035
  • Figure 69: Latin America Market Y-o-Y Growth (%) Projections by Country, 2025-2035
  • Figure 70: Latin America Market Value (USD Million) Analysis by Function, 2020-2035
  • Figure 71: Latin America Market Volume (Units) Analysis by Function, 2020-2035
  • Figure 72: Latin America Market Value Share (%) and BPS Analysis by Function, 2025-2035
  • Figure 73: Latin America Market Y-o-Y Growth (%) Projections by Function, 2025-2035
  • Figure 74: Latin America Market Value (USD Million) Analysis by Product Type, 2020-2035
  • Figure 75: Latin America Market Volume (Units) Analysis by Product Type, 2020-2035
  • Figure 76: Latin America Market Value Share (%) and BPS Analysis by Product Type, 2025-2035
  • Figure 77: Latin America Market Y-o-Y Growth (%) Projections by Product Type, 2025-2035
  • Figure 78: Latin America Market Value (USD Million) Analysis by Channel, 2020-2035
  • Figure 79: Latin America Market Volume (Units) Analysis by Channel, 2020-2035
  • Figure 80: Latin America Market Value Share (%) and BPS Analysis by Channel, 2025-2035
  • Figure 81: Latin America Market Y-o-Y Growth (%) Projections by Channel, 2025-2035
  • Figure 82: Latin America Market Value (USD Million) Analysis by Claim, 2020-2035
  • Figure 83: Latin America Market Volume (Units) Analysis by Claim, 2020-2035
  • Figure 84: Latin America Market Value Share (%) and BPS Analysis by Claim, 2025-2035
  • Figure 85: Latin America Market Y-o-Y Growth (%) Projections by Claim, 2025-2035
  • Figure 86: Latin America Market Attractiveness by Function, 2025-2035
  • Figure 87: Latin America Market Attractiveness by Product Type, 2025-2035
  • Figure 88: Latin America Market Attractiveness by Channel, 2025-2035
  • Figure 89: Latin America Market Attractiveness by Claim, 2025-2035
  • Figure 90: Latin America Market Attractiveness by Country, 2025-2035
  • Figure 91: Europe Market Value (USD Million) by Function, 2025-2035
  • Figure 92: Europe Market Value (USD Million) by Product Type, 2025-2035
  • Figure 93: Europe Market Value (USD Million) by Channel, 2025-2035
  • Figure 94: Europe Market Value (USD Million) by Claim, 2025-2035
  • Figure 95: Europe Market Value (USD Million) by Country, 2025-2035
  • Figure 96: Europe Market Value (USD Million) Analysis by Country, 2020-2035
  • Figure 97: Europe Market Volume (Units) Analysis by Country, 2020-2035
  • Figure 98: Europe Market Value Share (%) and BPS Analysis by Country, 2025-2035
  • Figure 99: Europe Market Y-o-Y Growth (%) Projections by Country, 2025-2035
  • Figure 100: Europe Market Value (USD Million) Analysis by Function, 2020-2035
  • Figure 101: Europe Market Volume (Units) Analysis by Function, 2020-2035
  • Figure 102: Europe Market Value Share (%) and BPS Analysis by Function, 2025-2035
  • Figure 103: Europe Market Y-o-Y Growth (%) Projections by Function, 2025-2035
  • Figure 104: Europe Market Value (USD Million) Analysis by Product Type, 2020-2035
  • Figure 105: Europe Market Volume (Units) Analysis by Product Type, 2020-2035
  • Figure 106: Europe Market Value Share (%) and BPS Analysis by Product Type, 2025-2035
  • Figure 107: Europe Market Y-o-Y Growth (%) Projections by Product Type, 2025-2035
  • Figure 108: Europe Market Value (USD Million) Analysis by Channel, 2020-2035
  • Figure 109: Europe Market Volume (Units) Analysis by Channel, 2020-2035
  • Figure 110: Europe Market Value Share (%) and BPS Analysis by Channel, 2025-2035
  • Figure 111: Europe Market Y-o-Y Growth (%) Projections by Channel, 2025-2035
  • Figure 112: Europe Market Value (USD Million) Analysis by Claim, 2020-2035
  • Figure 113: Europe Market Volume (Units) Analysis by Claim, 2020-2035
  • Figure 114: Europe Market Value Share (%) and BPS Analysis by Claim, 2025-2035
  • Figure 115: Europe Market Y-o-Y Growth (%) Projections by Claim, 2025-2035
  • Figure 116: Europe Market Attractiveness by Function, 2025-2035
  • Figure 117: Europe Market Attractiveness by Product Type, 2025-2035
  • Figure 118: Europe Market Attractiveness by Channel, 2025-2035
  • Figure 119: Europe Market Attractiveness by Claim, 2025-2035
  • Figure 120: Europe Market Attractiveness by Country, 2025-2035
  • Figure 121: East Asia Market Value (USD Million) by Function, 2025-2035
  • Figure 122: East Asia Market Value (USD Million) by Product Type, 2025-2035
  • Figure 123: East Asia Market Value (USD Million) by Channel, 2025-2035
  • Figure 124: East Asia Market Value (USD Million) by Claim, 2025-2035
  • Figure 125: East Asia Market Value (USD Million) by Country, 2025-2035
  • Figure 126: East Asia Market Value (USD Million) Analysis by Country, 2020-2035
  • Figure 127: East Asia Market Volume (Units) Analysis by Country, 2020-2035
  • Figure 128: East Asia Market Value Share (%) and BPS Analysis by Country, 2025-2035
  • Figure 129: East Asia Market Y-o-Y Growth (%) Projections by Country, 2025-2035
  • Figure 130: East Asia Market Value (USD Million) Analysis by Function, 2020-2035
  • Figure 131: East Asia Market Volume (Units) Analysis by Function, 2020-2035
  • Figure 132: East Asia Market Value Share (%) and BPS Analysis by Function, 2025-2035
  • Figure 133: East Asia Market Y-o-Y Growth (%) Projections by Function, 2025-2035
  • Figure 134: East Asia Market Value (USD Million) Analysis by Product Type, 2020-2035
  • Figure 135: East Asia Market Volume (Units) Analysis by Product Type, 2020-2035
  • Figure 136: East Asia Market Value Share (%) and BPS Analysis by Product Type, 2025-2035
  • Figure 137: East Asia Market Y-o-Y Growth (%) Projections by Product Type, 2025-2035
  • Figure 138: East Asia Market Value (USD Million) Analysis by Channel, 2020-2035
  • Figure 139: East Asia Market Volume (Units) Analysis by Channel, 2020-2035
  • Figure 140: East Asia Market Value Share (%) and BPS Analysis by Channel, 2025-2035
  • Figure 141: East Asia Market Y-o-Y Growth (%) Projections by Channel, 2025-2035
  • Figure 142: East Asia Market Value (USD Million) Analysis by Claim, 2020-2035
  • Figure 143: East Asia Market Volume (Units) Analysis by Claim, 2020-2035
  • Figure 144: East Asia Market Value Share (%) and BPS Analysis by Claim, 2025-2035
  • Figure 145: East Asia Market Y-o-Y Growth (%) Projections by Claim, 2025-2035
  • Figure 146: East Asia Market Attractiveness by Function, 2025-2035
  • Figure 147: East Asia Market Attractiveness by Product Type, 2025-2035
  • Figure 148: East Asia Market Attractiveness by Channel, 2025-2035
  • Figure 149: East Asia Market Attractiveness by Claim, 2025-2035
  • Figure 150: East Asia Market Attractiveness by Country, 2025-2035
  • Figure 151: South Asia & Pacific Market Value (USD Million) by Function, 2025-2035
  • Figure 152: South Asia & Pacific Market Value (USD Million) by Product Type, 2025-2035
  • Figure 153: South Asia & Pacific Market Value (USD Million) by Channel, 2025-2035
  • Figure 154: South Asia & Pacific Market Value (USD Million) by Claim, 2025-2035
  • Figure 155: South Asia & Pacific Market Value (USD Million) by Country, 2025-2035
  • Figure 156: South Asia & Pacific Market Value (USD Million) Analysis by Country, 2020-2035
  • Figure 157: South Asia & Pacific Market Volume (Units) Analysis by Country, 2020-2035
  • Figure 158: South Asia & Pacific Market Value Share (%) and BPS Analysis by Country, 2025-2035
  • Figure 159: South Asia & Pacific Market Y-o-Y Growth (%) Projections by Country, 2025-2035
  • Figure 160: South Asia & Pacific Market Value (USD Million) Analysis by Function, 2020-2035
  • Figure 161: South Asia & Pacific Market Volume (Units) Analysis by Function, 2020-2035
  • Figure 162: South Asia & Pacific Market Value Share (%) and BPS Analysis by Function, 2025-2035
  • Figure 163: South Asia & Pacific Market Y-o-Y Growth (%) Projections by Function, 2025-2035
  • Figure 164: South Asia & Pacific Market Value (USD Million) Analysis by Product Type, 2020-2035
  • Figure 165: South Asia & Pacific Market Volume (Units) Analysis by Product Type, 2020-2035
  • Figure 166: South Asia & Pacific Market Value Share (%) and BPS Analysis by Product Type, 2025-2035
  • Figure 167: South Asia & Pacific Market Y-o-Y Growth (%) Projections by Product Type, 2025-2035
  • Figure 168: South Asia & Pacific Market Value (USD Million) Analysis by Channel, 2020-2035
  • Figure 169: South Asia & Pacific Market Volume (Units) Analysis by Channel, 2020-2035
  • Figure 170: South Asia & Pacific Market Value Share (%) and BPS Analysis by Channel, 2025-2035
  • Figure 171: South Asia & Pacific Market Y-o-Y Growth (%) Projections by Channel, 2025-2035
  • Figure 172: South Asia & Pacific Market Value (USD Million) Analysis by Claim, 2020-2035
  • Figure 173: South Asia & Pacific Market Volume (Units) Analysis by Claim, 2020-2035
  • Figure 174: South Asia & Pacific Market Value Share (%) and BPS Analysis by Claim, 2025-2035
  • Figure 175: South Asia & Pacific Market Y-o-Y Growth (%) Projections by Claim, 2025-2035
  • Figure 176: South Asia & Pacific Market Attractiveness by Function, 2025-2035
  • Figure 177: South Asia & Pacific Market Attractiveness by Product Type, 2025-2035
  • Figure 178: South Asia & Pacific Market Attractiveness by Channel, 2025-2035
  • Figure 179: South Asia & Pacific Market Attractiveness by Claim, 2025-2035
  • Figure 180: South Asia & Pacific Market Attractiveness by Country, 2025-2035
  • Figure 181: Middle East and Africa Market Value (USD Million) by Function, 2025-2035
  • Figure 182: Middle East and Africa Market Value (USD Million) by Product Type, 2025-2035
  • Figure 183: Middle East and Africa Market Value (USD Million) by Channel, 2025-2035
  • Figure 184: Middle East and Africa Market Value (USD Million) by Claim, 2025-2035
  • Figure 185: Middle East and Africa Market Value (USD Million) by Country, 2025-2035
  • Figure 186: Middle East and Africa Market Value (USD Million) Analysis by Country, 2020-2035
  • Figure 187: Middle East and Africa Market Volume (Units) Analysis by Country, 2020-2035
  • Figure 188: Middle East and Africa Market Value Share (%) and BPS Analysis by Country, 2025-2035
  • Figure 189: Middle East and Africa Market Y-o-Y Growth (%) Projections by Country, 2025-2035
  • Figure 190: Middle East and Africa Market Value (USD Million) Analysis by Function, 2020-2035
  • Figure 191: Middle East and Africa Market Volume (Units) Analysis by Function, 2020-2035
  • Figure 192: Middle East and Africa Market Value Share (%) and BPS Analysis by Function, 2025-2035
  • Figure 193: Middle East and Africa Market Y-o-Y Growth (%) Projections by Function, 2025-2035
  • Figure 194: Middle East and Africa Market Value (USD Million) Analysis by Product Type, 2020-2035
  • Figure 195: Middle East and Africa Market Volume (Units) Analysis by Product Type, 2020-2035
  • Figure 196: Middle East and Africa Market Value Share (%) and BPS Analysis by Product Type, 2025-2035
  • Figure 197: Middle East and Africa Market Y-o-Y Growth (%) Projections by Product Type, 2025-2035
  • Figure 198: Middle East and Africa Market Value (USD Million) Analysis by Channel, 2020-2035
  • Figure 199: Middle East and Africa Market Volume (Units) Analysis by Channel, 2020-2035
  • Figure 200: Middle East and Africa Market Value Share (%) and BPS Analysis by Channel, 2025-2035
  • Figure 201: Middle East and Africa Market Y-o-Y Growth (%) Projections by Channel, 2025-2035
  • Figure 202: Middle East and Africa Market Value (USD Million) Analysis by Claim, 2020-2035
  • Figure 203: Middle East and Africa Market Volume (Units) Analysis by Claim, 2020-2035
  • Figure 204: Middle East and Africa Market Value Share (%) and BPS Analysis by Claim, 2025-2035
  • Figure 205: Middle East and Africa Market Y-o-Y Growth (%) Projections by Claim, 2025-2035
  • Figure 206: Middle East and Africa Market Attractiveness by Function, 2025-2035
  • Figure 207: Middle East and Africa Market Attractiveness by Product Type, 2025-2035
  • Figure 208: Middle East and Africa Market Attractiveness by Channel, 2025-2035
  • Figure 209: Middle East and Africa Market Attractiveness by Claim, 2025-2035
  • Figure 210: Middle East and Africa Market Attractiveness by Country, 2025-2035
Dashboard
Dashboard
Dashboard
Dashboard
Dashboard
Dashboard

Full Research Suite comprises of:

Market outlook & trends analysis

Market outlook & trends analysis

Interviews & case studies

Interviews & case studies

Strategic recommendations

Strategic recommendations

Vendor profiles & capabilities analysis

Vendor profiles & capabilities analysis

5-year forecasts

5-year forecasts

8 regions and 60+ country-level data splits

8 regions and 60+ country-level data splits

Market segment data splits

Market segment data splits

12 months of continuous data updates

12 months of continuous data updates

DELIVERED AS:

PDF EXCEL ONLINE

Full Research Suite


$2000

$3500

$5000

Buy Report Now
Similar Industry Reports

Similar Industry Reports

Firming Agents Botox-Like Market

Firming Agents Botox-Like Market Size and Share Forecast Outlook 2025 to 2035

Firming Agents Market

Firming Agents Market Growth – Product Innovations & Applications from 2025 to 2035

Firming Creams and Serums Market

Firming Creams and Serums Market Analysis - Size and Share Forecast Outlook 2025 to 2035

Body Firming Creams Market

Body Firming Creams Market Growth & Forecast 2025-2035

Slugging Creams Market

Slugging Creams Market Size and Share Forecast Outlook 2025 to 2035

Anti-Aging Creams & Serums Market

Anti-Aging Creams & Serums Market Size and Share Forecast Outlook 2025 to 2035

Anti-Wrinkle Creams Market

Anti-Wrinkle Creams Market Size and Share Forecast Outlook 2025 to 2035

Eczema Relief Creams Market

Eczema Relief Creams Market Analysis - Size and Share Forecast Outlook 2025 to 2035

Muscle Relaxing Creams Market

Muscle Relaxing Creams Market Size and Share Forecast Outlook 2025 to 2035

Plant-Based Ice Creams Market

Plant-Based Ice Creams Market Analysis by Form, Product Type, Flavor, Source, Sales Channel, and Region through 2035

Moisturizing Body Creams Market

Moisturizing Body Creams Market Size and Share Forecast Outlook 2025 to 2035

Age-Defying Night Creams Market

Age-Defying Night Creams Market Analysis - Size and Share Forecast Outlook 2025 to 2035

Probiotic-Infused Creams Market

Probiotic-Infused Creams Market Size and Share Forecast Outlook 2025 to 2035

Hydrating Emollient Creams Market

Hydrating Emollient Creams Market Size and Share Forecast Outlook 2025 to 2035

Cica-Infused Healing Creams Market

Cica-Infused Healing Creams Market Analysis - Size, Share, and Forecast Outlook 2025 to 2035

Vitamin E Antioxidant Creams Market

Vitamin E Antioxidant Creams Market Analysis - Size, Share, and Forecast Outlook 2025 to 2035

Retinoid-Infused Night Creams Market

Retinoid-Infused Night Creams Market Analysis - Size, Share, and Forecast Outlook 2025 to 2035

Depilatory Hair Removal Creams Market

Depilatory Hair Removal Creams Market Analysis - Size and Share Forecast Outlook 2025 to 2035

Stretch Mark Prevention Creams Market

Stretch Mark Prevention Creams Market Size and Share Forecast Outlook 2025 to 2035

Lip Plumping and Filler Creams Market

Lip Plumping and Filler Creams Market Analysis - Size and Share Forecast Outlook 2025 to 2035

Future Market Insights

Peptide-Enhanced Firming Creams Market

Chat With MaRIA

Chat With

MaRIA

Hi There, I am MaRIA, Your Market Research Intelligence Assistant. How may I help you?