Slugging Creams Market Size and Share Forecast Outlook 2025 to 2035

The Slugging Creams Market is expected to record a valuation of USD 2,290.30 million in 2025 and USD 3,800.50 million in 2035, with an increase of USD 1,510.0 million, which equals a growth of 66.0% over the decade. The overall expansion represents a CAGR of 5.2% and a 1.7X increase in market size.
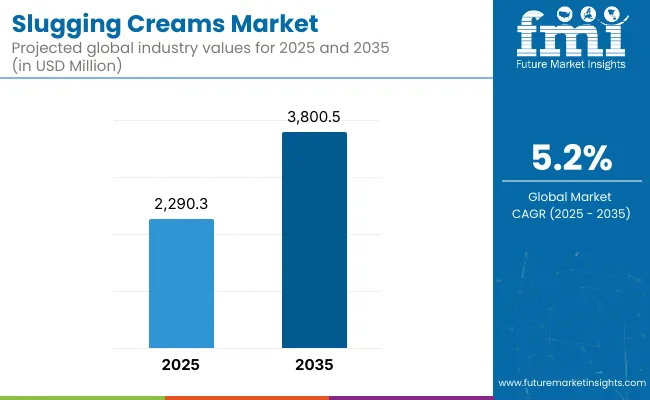
Quick Stats for Slugging Creams Market

  • Slugging Creams Market Value (2025): USD 2,290.30 Million
  • Slugging Creams Market Forecast Value (2035): USD 3,800.50 Million
  • Slugging Creams Market Forecast CAGR: 5.2%
  • Leading Segment in Slugging Creams Market in 2025: Petroleum-Based Creams & Balms (38.5%)
  • Key Growth Regions in the Slugging Creams Market: North America, Asia-Pacific, Europe
  • Top Key Players in Slugging Creams Market: Vaseline, Aquaphor, CeraVe, Futurewise, Cocokind, Dieux Skin, iS Clinical, Elizabeth Arden, Philosophy, PCA Skin

Slugging Creams Market

Slugging Creams Market Key Takeaways

Metric Value
Estimated Value (2025E) USD 2,290.3 million
Forecast Value (2035F) USD 3,800.5 million
Forecast CAGR (2025 to 2035) 5.2%

During the first five-year period from 2025 to 2030, the market increases from USD 2,290.30 million to USD 2,960.50 million, adding USD 670.0 million, which accounts for 44.4% of the total decade growth. This phase records steady adoption across night skincare routines, post-treatment recovery, and barrier-repair creams, driven by rising interest in moisture retention and dermatology-backed skincare. Petroleum-based creams and balms dominate this period as they cater to over 50% of slugging use-cases requiring high occlusive.

The second half from 2030 to 2035 contributes USD 840.0 million, equal to 55.6% of total growth, as the market jumps from USD 2,960.0 million to USD 3,800.0 million. This acceleration is powered by widespread adoption of multi-step skincare regimens, plant-based slugging formats, and hybrid occlusive systems among Gen Z and dermocosmetic consumers. Stick and hybrid cream formats together capture a larger share above 45% by the end of the decade. Recurring revenue from DTC platforms and seasonal skincare sales increase the online channel share beyond 60% in total value.

From 2020 to 2024, the Slugging Creams Market expanded from USD 1,765.4 million to USD 2,180.5 million, supported by a surge in skin barrier repair trends and K-beauty influence across Gen Z and Millennial consumers. During this period, the competitive landscape remained largely brand-centric, with legacy skincare brands and drugstore ointments capturing over 65% of market value.

Leaders such as Vaseline, Aquaphor, and CeraVe reinforced their dominance through dermatology-backed positioning and ingredient familiarity, particularly petroleum-based formulas. Product innovation remained incremental, focused on packaging aesthetics, fragrance-free options, and hypoallergenic claims. Indie and clean-label entrants gained modest visibility but lacked significant distribution traction or dermatologist endorsements needed to scale.

Demand for slugging creams is projected to reach USD 2,290.3 million in 2025, with momentum expected to continue through 2035, elevating market value to USD 3,800.5 million. The revenue mix is gradually evolving as silicone-based and fermented ingredient formulations begin to challenge petroleum-dominant offerings, which currently account for 38.5% share. Asia-Pacific and North America remain the core growth zones, with China emerging as a pivotal influencer-driven market.

Market incumbents are now contending with purpose-built skincare startups offering hybrid balm-serum textures and prebiotic-based barrier creams. Competitive advantage is shifting from heritage brand equity alone to multifunctionality, clean-label certifications, and clinical claim substantiation. The next phase of competition will be marked by transparency in formulation, retail personalization, and microbiome-friendly positioning, compelling traditional players to diversify beyond occlusive-only product stories.

Why the Slugging Creams Market is growing?

The rise of “slugging” as a skincare ritual has been amplified by platforms like TikTok and Reddit, where consumers share visible overnight transformations. This virality has reshaped product discovery, pushing petroleum-based occlusives and barrier-repair creams into mainstream routines.

Unlike typical skincare fads, slugging appeals to ingredient transparency and low-cost solutions, making it especially sticky in Gen Z and Millennial cohorts. Brands have capitalized by launching non-comedogenic and multi-functional slugging products tailored to different skin types, converting trend engagement into steady product adoption.

Dermatologist-recommended slugging creams with ceramides, squalane, and hyaluronic acid are being actively repositioned beyond hydration into skin-barrier therapy. With eczema, rosacea, and environmental damage driving skin sensitivity, occlusive-based barrier creams are finding renewed demand from medically aware consumers.

Clinics and DTC brands are promoting slugging as a preventive treatment post-retinol or exfoliant use, rather than just a nighttime ritual. This medical-grade positioning has moved slugging creams into the functional skincare category, allowing higher price points and cross-category expansion into dermocosmetics and clinical skincare portfolios.

Segmental Analysis

The slugging creams market exhibits varied dynamics across its segmented categories, reflecting innovation in formulation, consumer preferences, and retail evolution. Among Product Types, petroleum-based creams and balms continue to dominate due to their familiarity and perceived efficacy, while oil-based occlusive creams and hybrid moisturizers like water-in-oil emulsions are gaining traction for offering lighter textures without compromising barrier sealing.

Gel-based slugging creams are witnessing interest among younger consumers seeking non-greasy hydration, and stick formats or solid balms are emerging as convenient, travel-friendly alternatives. In terms of key occlusive ingredients, petrolatum retains widespread adoption owing to its proven moisture retention, yet squalane and hydrogenated polyisobutene-based variants are increasingly favored for being lightweight and non-comedogenic.

Beeswax, lanolin, and silicone-based ingredients like dimethicone remain relevant for their dual role in protection and texture enhancement, while plant-based occlusives such as shea and cocoa butter are carving a niche among clean beauty enthusiasts. Use-case segmentation reveals that overnight moisturizing remains the most common application, supported by the product’s strong alignment with nighttime skincare routines.

Clinical and post-treatment applications are gaining clinical endorsement, while K-beauty-inspired layering routines and winter hydration needs further reinforce demand. Packaging Types show dominance of jars and tubs for thicker balms, whereas tubes and pump bottles are preferred for hygienic dispensing of lighter creams.

Sticks and twist-ups are increasingly seen in solid balm formats. On the distribution front, e-commerce platforms and brand-owned DTC websites are driving growth due to content-driven consumer education, although specialty beauty retail and mass retail channels remain important for trial-based purchases. Dermatology clinics and aesthetic spas contribute to credibility and targeted therapeutic use.Regionally, the scope spans North America, Latin America, Western and Eastern Europe, Balkan and Baltic countries, Central Asia, East Asia, South Asia and Pacific, and the Middle East and Africa.
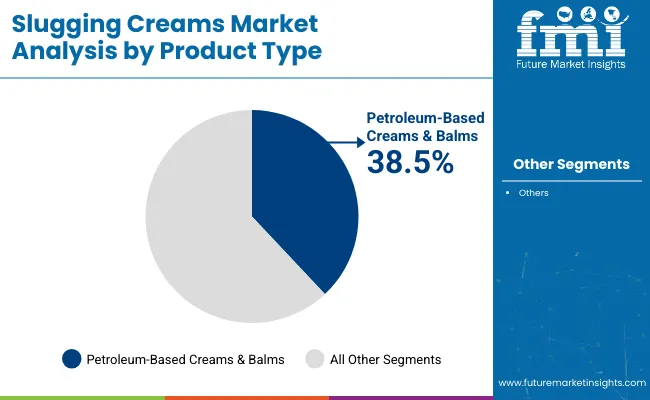
Insights into the Product Type Segment with Petroleum-Based Creams & Balms Leading in Market Share

Slugging Creams Market By Product

Product Type Value Share % 2025
Petroleum-Based Creams & Balms 38.5%
Others 61.5%

In the global slugging creams market, petroleum-based creams and balms are projected to hold the dominant share of 38.5% in 2025, underscoring their entrenched position as the foundational occlusive product in barrier-repair skincare. This dominance is attributed to the proven efficacy of petrolatum as an occlusive agent that significantly reduces transepidermal water loss (TEWL), making it a clinically trusted choice in dermatology and post-treatment care.

Despite rising interest in plant-based and hybrid alternatives, petroleum-based formats continue to enjoy broad consumer trust due to their affordability, long-standing usage history, and recommendation by skin specialists for compromised or sensitized skin. Their usage is particularly strong in overnight moisturization and winter skincare applications, where deep occlusion is prioritized over sensorial or aesthetic considerations.

Insights into the Ingredient TypeSegment with Petrolatum Dominating the Demand
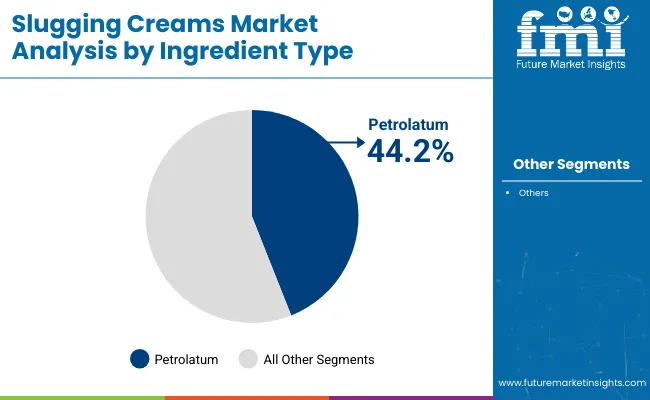
Slugging Creams Market By Ingrediant

Ingredient Type Value Share % 2025
Petrolatum 44.2%
Others 55.8%

Petrolatum is estimated to dominate the key occlusive ingredient segment with a 44.2% value share in 2025, reflecting its longstanding status as the gold standard for barrier-repair and moisture-locking functions in slugging creams. Its unmatched ability to form an impermeable layer over the skin makes it highly effective for reducing transepidermal water loss (TEWL), especially for dry, sensitive, or compromised skin. Dermatologist endorsement, OTC therapeutic use, and inclusion in clinical skincare regimens continue to reinforce its usage across both mass and premium formulations.

Despite this lead, the remaining 55.8% share captured by other occlusivesincluding lanolin, squalane, shea butter, ceramides, and silicone derivativespoints to growing diversification driven by evolving skin needs, ingredient transparency, and clean label preferences. Many consumers are opting for alternatives perceived as lighter, breathable, vegan, or botanical-derived, especially in regions where concerns around pore-clogging or petrochemical-based ingredients are rising.
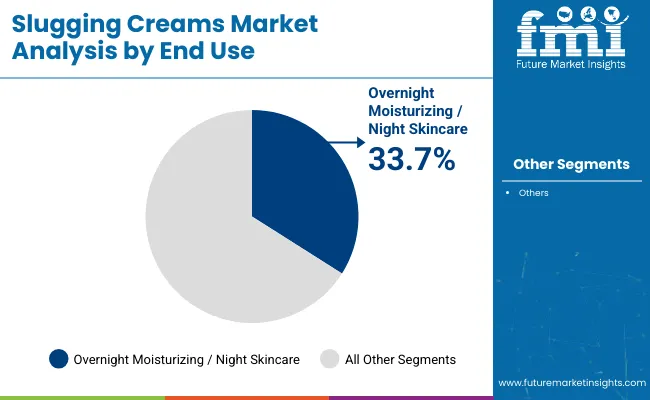
Insights into the End Use ApplicationsSegment with Focus on Overnight Moisturizing / Night Skincare

Slugging Creams Market By End Use

End Use Applications Value Share % 2025
Overnight Moisturizing / Night Skincare 33.7%
Others 66.3%

Overnight moisturizing and night skincare applications are expected to account for 33.7% of the global slugging creams market in 2025, underscoring their central role in driving product functionality and consumer intent. The concept of overnight skin repair has been widely embraced across dermatological and beauty communities, where slugging is increasingly promoted as a nighttime ritual to enhance skin regeneration, improve hydration retention, and protect against environmental aggressors.

The occlusive nature of slugging creams aligns with circadian skin rhythms, which favor reparative and barrier-building functions during sleep. This segment’s growth is also supported by rising adoption of multi-step PM routines, particularly in K-beauty, dermocosmetic, and anti-aging skincare regimes.

What are the Drivers, Restraints, and Key Trends of the Slugging Creams Market?

Rising Adoption of Dermocosmetic Rituals Rooted in Skin Barrier Science

The market has been significantly influenced by the growing clinical emphasis on the skin barrier function. Slugging creams, often rich in petrolatum and lipid-replenishing occlusives, have gained traction as dermatologists, estheticians, and skincare brands increasingly advocate barrier repair as a foundational skincare goal.

Rather than focusing solely on aesthetics or anti-aging, newer dermocosmetic routines emphasize restoring the skin’s natural lipid shield to address transepidermal water loss, dryness-induced inflammation, and sensitivity. Slugging’s ability to lock in hydration and enhance the efficacy of layered actives makes it highly compatible with multi-step routines and post-treatment recovery.

Medical-grade slugging creams are being positioned alongside serums and actives in barrier-centric protocols for sensitive and post-procedure skin. The normalization of skin barrier-first language in both professional and consumer discourse, especially across North America and East Asia, has elevated slugging creams from a niche concept to a recommended part of evidence-backed skincare. This shift is expected to continue propelling demand, particularly among consumers managing conditions like eczema, rosacea, or retinoid sensitivity.

Digital-First Influence of Skincare Micro-Communities and ‘Skin Cycling’ Trends

The surge in awareness surrounding slugging creams has been accelerated by skincare-focused digital micro-communities, where influencers, estheticians, and dermatologists discuss layering routines in relatable, routine-based content formats.

Platforms like TikTok, Reddit, and YouTube have created a hyper-engaged space for skincare enthusiasts to trial and share real-time results of slugging rituals, often with visible improvements to hydration, glow, and irritation reduction. Viral challenges and before-after testimonial videos have created trust in slugging, particularly among Gen Z and millennial users.

Slugging creams have also become central to the broader ‘skin cycling’ trend, where intensive actives (like acids or retinoids) are alternated with recovery nights focused on barrier support using occlusives. This has driven both DTC and retail brands to formulate dedicated night masks and skin-cycling-friendly occlusive creams, further solidifying market demand.

The online virality of slugging content has bypassed traditional skincare education barriers, allowing niche products to reach global audiences with minimal advertising spend. This grassroots digital validation continues to shape consumer expectations and drive innovation pipelines in the category.

Growing Criticism of Occlusive Ingredients in Acne-Prone and Oily Skin Types

While slugging creams have been positively received in dry and sensitive skin communities, concerns remain over their suitability for oily or acne-prone skin types. Occlusive agents like petrolatum, mineral oil, and waxesthough non-comedogenic in their pure formare often perceived by consumers as pore-clogging, especially when combined with layering routines that include emollients, serums, or makeup residue.

Online discussions and dermatology forums frequently highlight concerns over breakouts, milia, or congestion following slugging usage, particularly when formulations lack breathable textures or balancing actives. In regions with humid climates, such as parts of Southeast Asia or India, the preference still leans towards lightweight hydration, limiting widespread daily adoption of heavy occlusives.

Additionally, as clean beauty movements grow stronger, formulations perceived as synthetic or petroleum-derived face resistance from environmentally conscious and ingredient-aware buyers. While several brands are introducing non-petroleum-based occlusives, the perception gap continues to act as a barrier, requiring both education and formulation advancement to reassure sensitive user groups and expand demographic penetration.

Shift Toward Non-Petroleum, Botanical-Based Occlusives in Slugging Products

As consumer scrutiny of petroleum-derived ingredients intensifies, a visible shift is being observed toward plant-based or bio-derived occlusive alternatives in slugging creams. While petrolatum continues to dominate due to its proven barrier-sealing capabilities, newer formulations are exploring botanical waxes (like sunflower wax, candelilla, or berry wax), shea butter derivatives, and skin-identical lipids to meet clean label and sustainability expectations.

These ingredients are being positioned as ‘breathable occlusives’ that offer similar barrier protection without the heavy or greasy feel associated with traditional slugging creams. The trend is particularly notable among premium and indie brands catering to conscious consumers in Europe and parts of North America.

These alternative formulations are often hybridized with humectants like hyaluronic acid or squalane to support all-day hydration without compromising comfort. Certifications such as COSMOS, vegan-friendly labels, and fragrance-free claims are becoming standard in this emerging product subsegment. This trend is not only reformulating the functional landscape of slugging creams but also redefining their sensorial and environmental positioning in the broader skincare market.
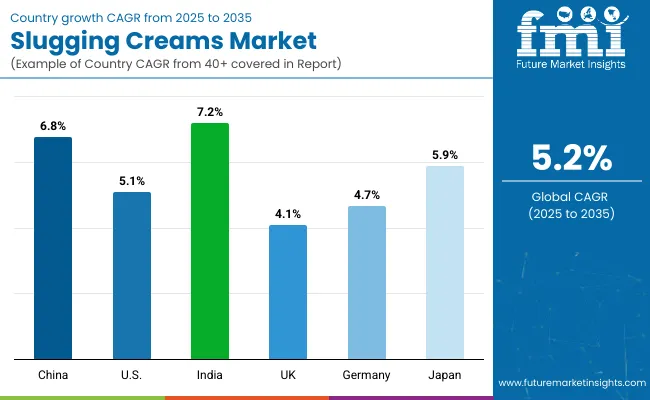
Analysis of Slugging Creams Market By Key Countries

Slugging Creams Market By Country

Countries Estimated CAGR (2025 to 2035)
China 6.8%
USA 5.1%
India 7.2%
UK 4.1%
Germany 4.7%
Japan 5.9%

The slugging creams market is poised for dynamic growth across several key countries, with India projected to witness the highest CAGR at 7.2% between 2025 and 2035. This expansion is expected to be underpinned by the rising influence of K-Beauty trends, growing interest in affordable multi-step skincare routines, and dermatologist-backed consumer education initiatives.

In China, a CAGR of 6.8% is anticipated, supported by the integration of occlusive products into nighttime skincare rituals, rapid urbanization, and high consumer responsiveness to hydration-focused marketing. Japan’s market, with an expected CAGR of 5.9%, is likely to remain shaped by its well-established beauty rituals, clinical skincare positioning, and demand for hybrid and sensitive-skin formulations.

In contrast, the USA market is expected to grow at 5.1% CAGR, sustained by strong DTC brand penetration, seasonal skincare usage, and emphasis on dermatological endorsements. Germany and the UK, registering slower growth at 4.7% and 4.1% respectively, are showing rising adoption of botanical and hybrid slugging formats but face challenges in mass-market conversion and consumer familiarity. The differential growth rates reflect varying stages of market maturity, cultural acceptance of occlusives, and accessibility through offline and online retail channels.

Sales Outlook for Slugging Creams in the United States

Years 2025 2026 2027 2028 2029 2030 2031 2032 2033 2034 2035
USA Slugging Creams Market 606.93 628.65 651.15 674.46 698.60 723.61 749.51 776.33 804.12 832.90 862.71

The Slugging Creams Market in the United States is projected to grow at a CAGR of 3.5%, driven by rising consumer interest in high-performance occlusive skincare. Demand is gaining traction across both mass and premium skincare segments, as overnight moisturization and skin barrier repair gain visibility through social media and dermatological endorsement.

Clinical dermatology professionals and skincare influencers are contributing to the normalization of slugging in routine skincare. Retailers are expanding their occlusive moisturizer assortments, including petrolatum-based balms and creams that cater to dry and sensitive skin types. The trend is particularly pronounced in colder USA regions where trans epidermal water loss is higher during winter months. Innovation around non-comedogenic formulations and fragrance-free variants is also shaping brand portfolios.

  • Overnight skincare routines are boosting demand for occlusive creams and balms
  • Consumers with dry and sensitive skin are driving interest in petrolatum-based formulas
  • Multi-channel retail and DTC brands are expanding their offerings with slugging-specific SKUs

Growth and Expansion Outlook for Slugging Creams Market in the United Kingdom

The Slugging Creams Market in the United Kingdom is projected to register a moderate CAGR of 4.1% between 2025 and 2035, supported by the expanding consumer base for targeted skincare solutions and moisture retention treatments. British consumers have shown increased awareness of skin barrier health, which is accelerating interest in slugging practices, particularly among individuals with dry, reactive, or eczema-prone skin.

Although the trend originated from Korean beauty routines, its integration into British beauty regimens has been facilitated by content from dermatologists and influencers across platforms like TikTok and Instagram. While the trend remains largely seasonalpeaking in colder monthsbrand innovations aimed at making slugging viable year-round, such as breathable occlusives and hybrid formulations, are expected to support future growth.

  • Educated consumers in UK cities are accelerating slugging adoption through pharmacy and online channels
  • Private label and clean beauty brands are entering the market with simplified, sensitive-skin-friendly formulations
  • Seasonal demand cycles are driving product innovations tailored for year-round barrier care.

Growth and Expansion Outlook for Slugging Creams Market in India

The Slugging Creams Market in India is expected to grow at a robust CAGR of 7.2% between 2025 and 2035, driven by the rising influence of K-beauty trends among Gen Z and millennial consumers. Social media penetration, along with increased skincare literacy among urban Indian consumers, has played a key role in popularizing slugging as a barrier-repair skincare technique.

Domestic and international brands are responding with product launches tailored for Indian skin types and climates, emphasizing lightweight occlusives and non-comedogenic formulations suited for humid weather conditions.

The demand is particularly strong in Tier 1 and emerging Tier 2 cities like Mumbai, Delhi, Bengaluru, Pune, Ahmedabad, and Kochi, where dermatology-backed routines are gaining preference. Retailers are also integrating slugging products into premium skincare assortments, especially in dermatology chains, online beauty platforms, and pharmacy retailers.

Furthermore, India’s Ayurveda and clean-label trends are being embedded into slugging creams through botanical and oil-based formulations that combine tradition with modern moisture retention techniques.

  • Indian Gen Z and millennial consumers are actively exploring K-beauty concepts like slugging via digital platforms.
  • Tier 1 and Tier 2 urban centers are witnessing increased uptake of occlusive products for barrier repair routines.
  • Dermatology-backed and clean-label slugging creams are gaining traction with regionally adapted formulations

Sales Outlook for Slugging Creams in China

The Slugging Creams Market in China is expected to grow at a CAGR of 8.6%, the highest among leading Asian economies. This growth is driven by the country’s deep-rooted skincare culture, high receptiveness to K-beauty trends, and the expanding middle-class appetite for advanced moisturization products.

Slugging has gained rapid popularity across Tier 1 and Tier 2 cities, with beauty influencers and dermatologists promoting occlusive routines on Xiaohongshu and Douyin. Domestic brands are actively launching petrolatum-based and gel-based slugging creams tailored to sensitive and acne-prone skin, while international labels are expanding distribution through Tmall, JD.com, and Watsons.

  • Social media platforms like Xiaohongshu and Douyin are accelerating slugging trend awareness among skincare-savvy consumers.
  • Multi-step hydration routines in Tier 1 and Tier 2 cities are driving demand for occlusive creams and masks.
  • China-based brands and OEMs are innovating lightweight, breathable slugging formulations for sensitive skin types.

In-depth Analysis of Slugging Creams in Germany

Countries 2025 Share (%) 2035 Share (%)
US 26.50% 22.70%
China 19.30% 22.40%
Japan 10.40% 10.20%
Germany 8.10% 7.60%
UK 7.90% 7.30%
India 5.30% 7.80%

The Slugging Creams Market in Germany is forecast to expand at a CAGR of 4.7% from 2025 to 2035, with its global market share expected to decline slightly from 8.1% in 2025 to 7.6% by 2035. This restrained growth is attributed to the country’s preference for minimalist skincare and lower per capita usage of occlusive-heavy products. However, rising interest in overnight hydration and dermatologist-backed routines is gradually opening space for slugging-adjacent products in drugstores and e-commerce platforms.

  • Growth centered in pharmacy and natural cosmetics retail channels
  • Minimalist skincare routines moderating widespread adoption of petrolatum-based creams
  • Demand rising for lighter formulations suitable for temperate European climates

Growth Outlook for Slugging Creams Market in USA

USA By Product Type Value Share % 2025
Petroleum-Based Creams & Balms 52.10%
Others 47.9%

The Slugging Creams Market in the USA is projected at USD 663.9 million in 2025. Petroleum-based creams and balms contribute 52.1%, while other formats hold 47.9%, reflecting the Product Type maturity and dominance of occlusive agents in barrier-repair routines. This marginal lead of petroleum-based products is attributed to their long-standing clinical endorsement, effectiveness in sealing moisture, and brand familiarity among USA consumers. However, the nearly equal share held by other formats signals a gradual format diversification influenced by clean-label preferences, stick formats, and balm-to-oil innovations.

Increasing adoption of slugging in skin cycling regimens and post-retinol care has widened the usage occasions, especially in colder regions. Emerging product hybrids and multifunctional nighttime occlusives are gaining visibility across DTC platforms and prestige skincare shelves. Meanwhile, growth in non-petroleum formats is strongly backed by clean beauty positioning, interest in plant-based wax alternatives, and dermatology-focused products. The shift is also catalyzed by growing consumer concerns over petrolatum content and environmental impact, triggering demand for transparent ingredient sourcing.

  • Market in the USA holds share of 26.5% in 2025 in the global market.
  • Petroleum-based creams slightly lead at 52.1% vs 47.9% for other formats.
  • Growth supported by slugging integration in skin cycling and clinical skincare regimens

Opportunity Analysis of ChinaSlugging Creams Market

China By Ingredient Type Value Share % 2025
Petrolatum 49.7%
Others 50.3%

The Slugging Creams Market in China is projected at USD 487.2 million in 2025. Occlusive formulations using ingredients other than petrolatum hold a marginal lead at 50.3%, while petrolatum-based variants account for 49.7%, indicating a strong domestic pivot toward alternative occlusives in barrier-repair routines.

This slight edge reflects rising consumer aversion to heavy petrochemicals and growing alignment with traditional herbal and botanical skincare systems favored in the Chinese market. Natural-origin waxes, rice bran oils, ceramides, and fermented occlusive blends are being positioned as cleaner, breathable alternatives in facial slugging formats.

Increased interest in functional skincare aligned with TCM (Traditional Chinese Medicine), combined with broader adoption of minimal routines among Gen Z and millennial consumers, has created whitespace for non-petrolatum products to expand.

DTC brands are also capitalizing on the transparency trend and regulatory momentum around petrochemical scrutiny, pushing the narrative toward cleaner occlusion methods. Furthermore, China's ingredient-forward marketing style has enabled rapid consumer education and trial of novel occlusive formats.

  • Market in China holds share of 19.4% in 2025 in the global market.
  • Non-petrolatum occlusives slightly lead at 50.3% vs 49.7%.
  • Growth driven by botanical alternatives, clean occlusion formats, and TCM-aligned skincare

Competitive Landscape of Slugging Creams Market

Slugging Creams Global Value Share 2025
Vaseline 24.3%
Others 75.7%

In 2025, the global slugging creams market is projected to remain highly fragmented, with Vaseline holding the top brand position at 24.3% share, while the remaining 75.7% is distributed across a wide range of players. Vaseline’s dominance is expected to be sustained through its mass-market affordability, deep retail penetration, and brand familiarity.

Clinical skincare players such as Aquaphor and CeraVe are anticipated to retain their foothold due to strong positioning in pharmacy channels and dermatologist-endorsed claims. At the same time, indie brands like Futurewise, Dieux Skin, and Cocokind are projected to gain ground by tapping into Gen Z and millennial audiences through vegan, sustainable, and minimalist formulations.

Premium brands including Elizabeth Arden and Philosophy are likely to expand into slugging-friendly formats under barrier-repair or overnight recovery lines. Competitive activity is set to intensify with increased focus on petroleum-free occlusives, innovative gel-cream textures, and multi-functional barrier support technologies, driving a shift toward ingredient-conscious consumer preferences and blurring lines between dermocosmetic and prestige segments.

Key Developments in Slugging Creams Market

  • In early March 2025, Futurewise announced that it would be discontinuing its entire Slugging product lineincluding the Slug Balm, Slug Cream, and Slug Boost. The brand had been a prominent DTC slugging pioneer offering non-petroleum-based occlusive skincare tailored for Gen Z consumers.
  • Unilever rolled out its “Vaseline Verified” social-first campaign in March 2025, where R&D experts systematically tested viral Vaseline hacks in the lab. Successful hacks were awarded the Vaseline Verified seal, amplifying scientific endorsement via social media.

Scope of the Report

Item Value
Quantitative Units USD 2,290.30 Million
Product Type Petroleum-based creams & balms, Oil-based occlusive creams, Gel-based slugging creams, Hybrid moisturizers (water-in-oil / oil-in-water), Stick format, Solid balms.
Ingredient Type Petrolatum, Squalane, Hydrogenated polyisobutene, Beeswax, Lanolin, Silicone-based occlusives, Plant-based occlusives.
End Use Applications Overnight moisturizing, Night skincare, Post-treatment dermatology, Clinical skincare, Barrier protection in multi-step skincare routines (e.g., K-beauty), Winter skincare, Seasonal hydration, Final occlusive step in daily routine.
Packaging Type Tubes, Jars, Tubs, Pump bottles, Sticks, Twist-ups.
Distribution Channel E-commerce platforms, Brand-owned DTC websites, Specialty beauty retail stores, Mass retail, Drugstores, Dermatology clinics, Aesthetic spas.
Regions Covered North America, Europe, Asia-Pacific, Latin America, Middle East & Africa
Country Covered United States, Canada, Germany, France, United Kingdom, China, Japan, India, Brazil, South Africa
Key Companies Profiled Vaseline, Aquaphor, CeraVe, Futurewise, Cocokind, Dieux Skin, iS Clinical, Elizabeth Arden, Philosophy, PCA Skin.
Additional Attributes Dollar sales segmented by Product Type and end-use application, adoption trends in dermatologist-recommended routines and clinical skincare protocols, rising demand for multifunctional and hybrid slugging creams in premium segments, sector-specific growth in overnight care, barrier repair, and post-treatment regimens, revenue segmentation by Packaging Type s and Ingredient Type s, integration with microbiome-supportive formulations and prebiotic technologies, regional trends shaped by climate-based skincare preferences and cultural skincare routines such as K-beauty layering, and innovations in formulation stability, water-in-oil emulsion systems, and transdermal occlusion technologies.

Key Segments

By Product Type:

  • Petroleum-Based Creams & Balms
  • Oil-Based Occlusive Creams
  • Gel-Based
  • Hybrid Moisturizers (Water-in-Oil / Oil-in-Water)
  • Stick Format / Solid Balms

By Ingredient Type:

  • Petrolatum
  • Squalane / Hydrogenated Polyisobutene
  • Beeswax / Lanolin
  • Silicone-Based Occlusives
  • Plant-Based Occlusives

By End Use Applications:

  • Overnight Moisturizing / Night Skincare
  • Post-Treatment Dermatology / Clinical Skincare
  • Barrier Protection in Multi-Step Skincare Routines
  • Winter Skincare / Seasonal Hydration
  • Final Occlusive Step in Daily Routine

By Packaging Type:

  • Tubes
  • Jars / Tubs
  • Pump Bottles
  • Sticks & Twist-Ups

By Distribution Channel:

  • E-commerce Platforms
  • Brand-Owned DTC Websites
  • Specialty Beauty Retail Stores
  • Mass Retail / Drugstores
  • Dermatology Clinics & Aesthetic Spas

By Region:

  • North America
  • Latin America
  • Europe
  • East Asia
  • South Asia & Pacific
  • Middle East and Africa

Table of Content

  1. Executive Summary
    • Global Market Outlook
    • Demand-side Trends
    • Supply-side Trends
    • Technology Roadmap Analysis
    • Analysis and Recommendations
  2. Market Overview
    • Market Coverage / Taxonomy
    • Market Definition / Scope / Limitations
  3. Market Background
    • Market Dynamics
      • Drivers
      • Restraints
      • Opportunity
      • Trends
    • Scenario Forecast
      • Demand in Optimistic Scenario
      • Demand in Likely Scenario
      • Demand in Conservative Scenario
    • Opportunity Map Analysis
    • Product Life Cycle Analysis
    • Supply Chain Analysis
      • Supply Side Participants and their Roles
        • Producers
        • Mid-Level Participants (Traders/ Agents/ Brokers)
        • Wholesalers and Distributors
      • Value Added and Value Created at Node in the Supply Chain
      • List of Raw Material Suppliers
      • List of Existing and Potential Buyer’s
    • Investment Feasibility Matrix
    • Value Chain Analysis
      • Profit Margin Analysis
      • Wholesalers and Distributors
      • Retailers
    • PESTLE and Porter’s Analysis
    • Regulatory Landscape
      • By Key Regions
      • By Key Countries
    • Regional Parent Market Outlook
    • Production and Consumption Statistics
    • Import and Export Statistics
  4. Global Market Analysis 2020 to 2024 and Forecast, 2025 to 2035
    • Historical Market Size Value (USD Million) & Volume (Units) Analysis, 2020 to 2024
    • Current and Future Market Size Value (USD Million) & Volume (Units) Projections, 2025 to 2035
      • Y-o-Y Growth Trend Analysis
      • Absolute $ Opportunity Analysis
  5. Global Market Analysis 2020 to 2024 and Forecast 2025 to 2035, By Product Type
    • Introduction / Key Findings
    • Historical Market Size Value (USD Million) & Volume (Units) Analysis By Product Type, 2020 to 2024
    • Current and Future Market Size Value (USD Million) & Volume (Units) Analysis and Forecast By Product Type, 2025 to 2035
      • Petroleum-Based Creams & Balms
      • Oil-Based Occlusive Creams
      • Gel-Based
      • Hybrid Moisturizers (Water-in-Oil / Oil-in-Water)
      • Stick Format / Solid Balms
    • Y-o-Y Growth Trend Analysis By Product Type, 2020 to 2024
    • Absolute $ Opportunity Analysis By Product Type, 2025 to 2035
  6. Global Market Analysis 2020 to 2024 and Forecast 2025 to 2035, By Ingredient Type
    • Introduction / Key Findings
    • Historical Market Size Value (USD Million) & Volume (Units) Analysis By Ingredient Type, 2020 to 2024
    • Current and Future Market Size Value (USD Million) & Volume (Units) Analysis and Forecast By Ingredient Type, 2025 to 2035
      • Petrolatum
      • Squalane / Hydrogenated Polyisobutene
      • Beeswax / Lanolin
      • Silicone-Based Occlusives
      • Plant-Based Occlusives
    • Y-o-Y Growth Trend Analysis By Ingredient Type, 2020 to 2024
    • Absolute $ Opportunity Analysis By Ingredient Type, 2025 to 2035
  7. Global Market Analysis 2020 to 2024 and Forecast 2025 to 2035, By End Use Applications
    • Introduction / Key Findings
    • Historical Market Size Value (USD Million) & Volume (Units) Analysis By End Use Applications, 2020 to 2024
    • Current and Future Market Size Value (USD Million) & Volume (Units) Analysis and Forecast By End Use Applications, 2025 to 2035
      • Overnight Moisturizing / Night Skincare
      • Post-Treatment Dermatology / Clinical Skincare
      • Barrier Protection in Multi-Step Skincare Routines
      • Winter Skincare / Seasonal Hydration
      • Final Occlusive Step in Daily Routine
    • Y-o-Y Growth Trend Analysis By End Use Applications, 2020 to 2024
    • Absolute $ Opportunity Analysis By End Use Applications, 2025 to 2035
  8. Global Market Analysis 2020 to 2024 and Forecast 2025 to 2035, By Packaging Type
    • Introduction / Key Findings
    • Historical Market Size Value (USD Million) & Volume (Units) Analysis By Packaging Type, 2020 to 2024
    • Current and Future Market Size Value (USD Million) & Volume (Units) Analysis and Forecast By Packaging Type, 2025 to 2035
      • Tubes
      • Jars / Tubs
      • Pump Bottles
      • Sticks & Twist-Ups
    • Y-o-Y Growth Trend Analysis By Packaging Type, 2020 to 2024
    • Absolute $ Opportunity Analysis By Packaging Type, 2025 to 2035
  9. Global Market Analysis 2020 to 2024 and Forecast 2025 to 2035, By Distribution Channel
    • Introduction / Key Findings
    • Historical Market Size Value (USD Million) & Volume (Units) Analysis By Distribution Channel, 2020 to 2024
    • Current and Future Market Size Value (USD Million) & Volume (Units) Analysis and Forecast By Distribution Channel, 2025 to 2035
      • E-commerce Platforms
      • Brand-Owned DTC Websites
      • Specialty Beauty Retail Stores
      • Mass Retail / Drugstores
      • Dermatology Clinics & Aesthetic Spas
    • Y-o-Y Growth Trend Analysis By Distribution Channel, 2020 to 2024
    • Absolute $ Opportunity Analysis By Distribution Channel, 2025 to 2035
  10. Global Market Analysis 2020 to 2024 and Forecast 2025 to 2035, By Region
    • Introduction
    • Historical Market Size Value (USD Million) & Volume (Units) Analysis By Region, 2020 to 2024
    • Current Market Size Value (USD Million) & Volume (Units) Analysis and Forecast By Region, 2025 to 2035
      • North America
      • Latin America
      • Europe
      • East Asia
      • South Asia & Pacific
      • Middle East and Africa
    • Market Attractiveness Analysis By Region
  11. North America Market Analysis 2020 to 2024 and Forecast 2025 to 2035, By Country
    • Historical Market Size Value (USD Million) & Volume (Units) Trend Analysis By Market Taxonomy, 2020 to 2024
    • Market Size Value (USD Million) & Volume (Units) Forecast By Market Taxonomy, 2025 to 2035
      • By Country
        • USA
        • Canada
      • By Product Type
      • By Ingredient Type
      • By End Use Applications
      • By Packaging Type
      • By Distribution Channel
    • Market Attractiveness Analysis
      • By Country
      • By Product Type
      • By Ingredient Type
      • By End Use Applications
      • By Packaging Type
      • By Distribution Channel
    • Key Takeaways
  12. Latin America Market Analysis 2020 to 2024 and Forecast 2025 to 2035, By Country
    • Historical Market Size Value (USD Million) & Volume (Units) Trend Analysis By Market Taxonomy, 2020 to 2024
    • Market Size Value (USD Million) & Volume (Units) Forecast By Market Taxonomy, 2025 to 2035
      • By Country
        • Brazil
        • Mexico
        • Colombia
        • Rest of Latin America
      • By Product Type
      • By Ingredient Type
      • By End Use Applications
      • By Packaging Type
      • By Distribution Channel
    • Market Attractiveness Analysis
      • By Country
      • By Product Type
      • By Ingredient Type
      • By End Use Applications
      • By Packaging Type
      • By Distribution Channel
    • Key Takeaways
  13. Europe Market Analysis 2020 to 2024 and Forecast 2025 to 2035, By Country
    • Historical Market Size Value (USD Million) & Volume (Units) Trend Analysis By Market Taxonomy, 2020 to 2024
    • Market Size Value (USD Million) & Volume (Units) Forecast By Market Taxonomy, 2025 to 2035
      • By Country
        • Germany
        • UK
        • France
        • Italy
        • Spain
        • Belgium
        • Netherlands
        • Nordic
        • Switzerland
        • Russia
        • Poland
        • Rest of Europe
      • By Product Type
      • By Ingredient Type
      • By End Use Applications
      • By Packaging Type
      • By Distribution Channel
    • Market Attractiveness Analysis
      • By Country
      • By Product Type
      • By Ingredient Type
      • By End Use Applications
      • By Packaging Type
      • By Distribution Channel
    • Key Takeaways
  14. East Asia Market Analysis 2020 to 2024 and Forecast 2025 to 2035, By Country
    • Historical Market Size Value (USD Million) & Volume (Units) Trend Analysis By Market Taxonomy, 2020 to 2024
    • Market Size Value (USD Million) & Volume (Units) Forecast By Market Taxonomy, 2025 to 2035
      • By Country
        • China
        • Japan
        • South Korea
      • By Product Type
      • By Ingredient Type
      • By End Use Applications
      • By Packaging Type
      • By Distribution Channel
    • Market Attractiveness Analysis
      • By Country
      • By Product Type
      • By Ingredient Type
      • By End Use Applications
      • By Packaging Type
      • By Distribution Channel
    • Key Takeaways
  15. South Asia & Pacific Market Analysis 2020 to 2024 and Forecast 2025 to 2035, By Country
    • Historical Market Size Value (USD Million) & Volume (Units) Trend Analysis By Market Taxonomy, 2020 to 2024
    • Market Size Value (USD Million) & Volume (Units) Forecast By Market Taxonomy, 2025 to 2035
      • By Country
        • India
        • Thailand
        • Malaysia
        • Indonesia
        • Singapore
        • Vietnam
        • Australia
        • New Zealand
        • Rest of South Asia
      • By Product Type
      • By Ingredient Type
      • By End Use Applications
      • By Packaging Type
      • By Distribution Channel
    • Market Attractiveness Analysis
      • By Country
      • By Product Type
      • By Ingredient Type
      • By End Use Applications
      • By Packaging Type
      • By Distribution Channel
    • Key Takeaways
  16. Middle East and Africa Market Analysis 2020 to 2024 and Forecast 2025 to 2035, By Country
    • Historical Market Size Value (USD Million) & Volume (Units) Trend Analysis By Market Taxonomy, 2020 to 2024
    • Market Size Value (USD Million) & Volume (Units) Forecast By Market Taxonomy, 2025 to 2035
      • By Country
        • Turkey
        • UAE
        • Saudi Arabia
        • Israel
        • Other GCC Countries
        • North Africa
        • South Africa
      • By Product Type
      • By Ingredient Type
      • By End Use Applications
      • By Packaging Type
      • By Distribution Channel
    • Market Attractiveness Analysis
      • By Country
      • By Product Type
      • By Ingredient Type
      • By End Use Applications
      • By Packaging Type
      • By Distribution Channel
    • Key Takeaways
  17. Key Countries Market Analysis
    • USA
      • Pricing Analysis
      • Market Share Analysis, 2024
        • By Product Type
        • By Ingredient Type
        • By End Use Applications
        • By Packaging Type
        • By Distribution Channel
    • Canada
      • Pricing Analysis
      • Market Share Analysis, 2024
        • By Product Type
        • By Ingredient Type
        • By End Use Applications
        • By Packaging Type
        • By Distribution Channel
    • Brazil
      • Pricing Analysis
      • Market Share Analysis, 2024
        • By Product Type
        • By Ingredient Type
        • By End Use Applications
        • By Packaging Type
        • By Distribution Channel
    • Mexico
      • Pricing Analysis
      • Market Share Analysis, 2024
        • By Product Type
        • By Ingredient Type
        • By End Use Applications
        • By Packaging Type
        • By Distribution Channel
    • Colombia
      • Pricing Analysis
      • Market Share Analysis, 2024
        • By Product Type
        • By Ingredient Type
        • By End Use Applications
        • By Packaging Type
        • By Distribution Channel
    • Germany
      • Pricing Analysis
      • Market Share Analysis, 2024
        • By Product Type
        • By Ingredient Type
        • By End Use Applications
        • By Packaging Type
        • By Distribution Channel
    • UK
      • Pricing Analysis
      • Market Share Analysis, 2024
        • By Product Type
        • By Ingredient Type
        • By End Use Applications
        • By Packaging Type
        • By Distribution Channel
    • France
      • Pricing Analysis
      • Market Share Analysis, 2024
        • By Product Type
        • By Ingredient Type
        • By End Use Applications
        • By Packaging Type
        • By Distribution Channel
    • Italy
      • Pricing Analysis
      • Market Share Analysis, 2024
        • By Product Type
        • By Ingredient Type
        • By End Use Applications
        • By Packaging Type
        • By Distribution Channel
    • Spain
      • Pricing Analysis
      • Market Share Analysis, 2024
        • By Product Type
        • By Ingredient Type
        • By End Use Applications
        • By Packaging Type
        • By Distribution Channel
    • Belgium
      • Pricing Analysis
      • Market Share Analysis, 2024
        • By Product Type
        • By Ingredient Type
        • By End Use Applications
        • By Packaging Type
        • By Distribution Channel
    • Netherlands
      • Pricing Analysis
      • Market Share Analysis, 2024
        • By Product Type
        • By Ingredient Type
        • By End Use Applications
        • By Packaging Type
        • By Distribution Channel
    • Nordic
      • Pricing Analysis
      • Market Share Analysis, 2024
        • By Product Type
        • By Ingredient Type
        • By End Use Applications
        • By Packaging Type
        • By Distribution Channel
    • Switzerland
      • Pricing Analysis
      • Market Share Analysis, 2024
        • By Product Type
        • By Ingredient Type
        • By End Use Applications
        • By Packaging Type
        • By Distribution Channel
    • Russia
      • Pricing Analysis
      • Market Share Analysis, 2024
        • By Product Type
        • By Ingredient Type
        • By End Use Applications
        • By Packaging Type
        • By Distribution Channel
    • Poland
      • Pricing Analysis
      • Market Share Analysis, 2024
        • By Product Type
        • By Ingredient Type
        • By End Use Applications
        • By Packaging Type
        • By Distribution Channel
    • China
      • Pricing Analysis
      • Market Share Analysis, 2024
        • By Product Type
        • By Ingredient Type
        • By End Use Applications
        • By Packaging Type
        • By Distribution Channel
    • Japan
      • Pricing Analysis
      • Market Share Analysis, 2024
        • By Product Type
        • By Ingredient Type
        • By End Use Applications
        • By Packaging Type
        • By Distribution Channel
    • South Korea
      • Pricing Analysis
      • Market Share Analysis, 2024
        • By Product Type
        • By Ingredient Type
        • By End Use Applications
        • By Packaging Type
        • By Distribution Channel
    • India
      • Pricing Analysis
      • Market Share Analysis, 2024
        • By Product Type
        • By Ingredient Type
        • By End Use Applications
        • By Packaging Type
        • By Distribution Channel
    • Thailand
      • Pricing Analysis
      • Market Share Analysis, 2024
        • By Product Type
        • By Ingredient Type
        • By End Use Applications
        • By Packaging Type
        • By Distribution Channel
    • Indonesia
      • Pricing Analysis
      • Market Share Analysis, 2024
        • By Product Type
        • By Ingredient Type
        • By End Use Applications
        • By Packaging Type
        • By Distribution Channel
    • Australia
      • Pricing Analysis
      • Market Share Analysis, 2024
        • By Product Type
        • By Ingredient Type
        • By End Use Applications
        • By Packaging Type
        • By Distribution Channel
    • New Zealand
      • Pricing Analysis
      • Market Share Analysis, 2024
        • By Product Type
        • By Ingredient Type
        • By End Use Applications
        • By Packaging Type
        • By Distribution Channel
    • Turkey
      • Pricing Analysis
      • Market Share Analysis, 2024
        • By Product Type
        • By Ingredient Type
        • By End Use Applications
        • By Packaging Type
        • By Distribution Channel
    • UAE
      • Pricing Analysis
      • Market Share Analysis, 2024
        • By Product Type
        • By Ingredient Type
        • By End Use Applications
        • By Packaging Type
        • By Distribution Channel
    • Saudi Arabia
      • Pricing Analysis
      • Market Share Analysis, 2024
        • By Product Type
        • By Ingredient Type
        • By End Use Applications
        • By Packaging Type
        • By Distribution Channel
    • Israel
      • Pricing Analysis
      • Market Share Analysis, 2024
        • By Product Type
        • By Ingredient Type
        • By End Use Applications
        • By Packaging Type
        • By Distribution Channel
    • North Africa
      • Pricing Analysis
      • Market Share Analysis, 2024
        • By Product Type
        • By Ingredient Type
        • By End Use Applications
        • By Packaging Type
        • By Distribution Channel
    • South Africa
      • Pricing Analysis
      • Market Share Analysis, 2024
        • By Product Type
        • By Ingredient Type
        • By End Use Applications
        • By Packaging Type
        • By Distribution Channel
  18. Market Structure Analysis
    • Competition Dashboard
    • Competition Benchmarking
    • Market Share Analysis of Top Players
      • By Regional
      • By Product Type
      • By Ingredient Type
      • By End Use Applications
      • By Packaging Type
      • By Distribution Channel
  19. Competition Analysis
    • Competition Deep Dive
      • Vaseline
        • Overview
        • Product Portfolio
        • Profitability by Market Segments (Product/Age /Sales Channel/Region)
        • Sales Footprint
        • Strategy Overview
          • Marketing Strategy
          • Product Strategy
          • Channel Strategy
      • Aquaphor
        • Overview
        • Product Portfolio
        • Profitability by Market Segments (Product/Age /Sales Channel/Region)
        • Sales Footprint
        • Strategy Overview
          • Marketing Strategy
          • Product Strategy
          • Channel Strategy
      • CeraVe
        • Overview
        • Product Portfolio
        • Profitability by Market Segments (Product/Age /Sales Channel/Region)
        • Sales Footprint
        • Strategy Overview
          • Marketing Strategy
          • Product Strategy
          • Channel Strategy
      • Futurewise
        • Overview
        • Product Portfolio
        • Profitability by Market Segments (Product/Age /Sales Channel/Region)
        • Sales Footprint
        • Strategy Overview
          • Marketing Strategy
          • Product Strategy
          • Channel Strategy
      • Cocokind
        • Overview
        • Product Portfolio
        • Profitability by Market Segments (Product/Age /Sales Channel/Region)
        • Sales Footprint
        • Strategy Overview
          • Marketing Strategy
          • Product Strategy
          • Channel Strategy
      • Dieux Skin
        • Overview
        • Product Portfolio
        • Profitability by Market Segments (Product/Age /Sales Channel/Region)
        • Sales Footprint
        • Strategy Overview
          • Marketing Strategy
          • Product Strategy
          • Channel Strategy
      • iS Clinical
        • Overview
        • Product Portfolio
        • Profitability by Market Segments (Product/Age /Sales Channel/Region)
        • Sales Footprint
        • Strategy Overview
          • Marketing Strategy
          • Product Strategy
          • Channel Strategy
      • Elizabeth Arden
        • Overview
        • Product Portfolio
        • Profitability by Market Segments (Product/Age /Sales Channel/Region)
        • Sales Footprint
        • Strategy Overview
          • Marketing Strategy
          • Product Strategy
          • Channel Strategy
      • Philosophy
        • Overview
        • Product Portfolio
        • Profitability by Market Segments (Product/Age /Sales Channel/Region)
        • Sales Footprint
        • Strategy Overview
          • Marketing Strategy
          • Product Strategy
          • Channel Strategy
      • PCA Skin
        • Overview
        • Product Portfolio
        • Profitability by Market Segments (Product/Age /Sales Channel/Region)
        • Sales Footprint
        • Strategy Overview
          • Marketing Strategy
          • Product Strategy
          • Channel Strategy
      • Others
        • Overview
        • Product Portfolio
        • Profitability by Market Segments (Product/Age /Sales Channel/Region)
        • Sales Footprint
        • Strategy Overview
          • Marketing Strategy
          • Product Strategy
          • Channel Strategy
  20. Assumptions & Acronyms Used
  21. Research Methodology

List of Tables

  • Table 1: Global Market Value (USD Million) Forecast by Region, 2020-2035
  • Table 2: Global Market Volume (Units) Forecast by Region, 2020-2035
  • Table 3: Global Market Value (USD Million) Forecast by Product Format, 2020-2035
  • Table 4: Global Market Volume (Units) Forecast by Product Format, 2020-2035
  • Table 5: Global Market Value (USD Million) Forecast by Key Occlusive Ingredient Type, 2020-2035
  • Table 6: Global Market Volume (Units) Forecast by Key Occlusive Ingredient Type, 2020-2035
  • Table 7: Global Market Value (USD Million) Forecast by End Use Applications, 2020-2035
  • Table 8: Global Market Volume (Units) Forecast by End Use Applications, 2020-2035
  • Table 9: Global Market Value (USD Million) Forecast by Packaging Format, 2020-2035
  • Table 10: Global Market Volume (Units) Forecast by Packaging Format, 2020-2035
  • Table 11: Global Market Value (USD Million) Forecast by Distribution Channel, 2020-2035
  • Table 12: Global Market Volume (Units) Forecast by Distribution Channel, 2020-2035
  • Table 13: North America Market Value (USD Million) Forecast by Country, 2020-2035
  • Table 14: North America Market Volume (Units) Forecast by Country, 2020-2035
  • Table 15: North America Market Value (USD Million) Forecast by Product Format, 2020-2035
  • Table 16: North America Market Volume (Units) Forecast by Product Format, 2020-2035
  • Table 17: North America Market Value (USD Million) Forecast by Key Occlusive Ingredient Type, 2020-2035
  • Table 18: North America Market Volume (Units) Forecast by Key Occlusive Ingredient Type, 2020-2035
  • Table 19: North America Market Value (USD Million) Forecast by End Use Applications, 2020-2035
  • Table 20: North America Market Volume (Units) Forecast by End Use Applications, 2020-2035
  • Table 21: North America Market Value (USD Million) Forecast by Packaging Format, 2020-2035
  • Table 22: North America Market Volume (Units) Forecast by Packaging Format, 2020-2035
  • Table 23: North America Market Value (USD Million) Forecast by Distribution Channel, 2020-2035
  • Table 24: North America Market Volume (Units) Forecast by Distribution Channel, 2020-2035
  • Table 25: Latin America Market Value (USD Million) Forecast by Country, 2020-2035
  • Table 26: Latin America Market Volume (Units) Forecast by Country, 2020-2035
  • Table 27: Latin America Market Value (USD Million) Forecast by Product Format, 2020-2035
  • Table 28: Latin America Market Volume (Units) Forecast by Product Format, 2020-2035
  • Table 29: Latin America Market Value (USD Million) Forecast by Key Occlusive Ingredient Type, 2020-2035
  • Table 30: Latin America Market Volume (Units) Forecast by Key Occlusive Ingredient Type, 2020-2035
  • Table 31: Latin America Market Value (USD Million) Forecast by End Use Applications, 2020-2035
  • Table 32: Latin America Market Volume (Units) Forecast by End Use Applications, 2020-2035
  • Table 33: Latin America Market Value (USD Million) Forecast by Packaging Format, 2020-2035
  • Table 34: Latin America Market Volume (Units) Forecast by Packaging Format, 2020-2035
  • Table 35: Latin America Market Value (USD Million) Forecast by Distribution Channel, 2020-2035
  • Table 36: Latin America Market Volume (Units) Forecast by Distribution Channel, 2020-2035
  • Table 37: Europe Market Value (USD Million) Forecast by Country, 2020-2035
  • Table 38: Europe Market Volume (Units) Forecast by Country, 2020-2035
  • Table 39: Europe Market Value (USD Million) Forecast by Product Format, 2020-2035
  • Table 40: Europe Market Volume (Units) Forecast by Product Format, 2020-2035
  • Table 41: Europe Market Value (USD Million) Forecast by Key Occlusive Ingredient Type, 2020-2035
  • Table 42: Europe Market Volume (Units) Forecast by Key Occlusive Ingredient Type, 2020-2035
  • Table 43: Europe Market Value (USD Million) Forecast by End Use Applications, 2020-2035
  • Table 44: Europe Market Volume (Units) Forecast by End Use Applications, 2020-2035
  • Table 45: Europe Market Value (USD Million) Forecast by Packaging Format, 2020-2035
  • Table 46: Europe Market Volume (Units) Forecast by Packaging Format, 2020-2035
  • Table 47: Europe Market Value (USD Million) Forecast by Distribution Channel, 2020-2035
  • Table 48: Europe Market Volume (Units) Forecast by Distribution Channel, 2020-2035
  • Table 49: East Asia Market Value (USD Million) Forecast by Country, 2020-2035
  • Table 50: East Asia Market Volume (Units) Forecast by Country, 2020-2035
  • Table 51: East Asia Market Value (USD Million) Forecast by Product Format, 2020-2035
  • Table 52: East Asia Market Volume (Units) Forecast by Product Format, 2020-2035
  • Table 53: East Asia Market Value (USD Million) Forecast by Key Occlusive Ingredient Type, 2020-2035
  • Table 54: East Asia Market Volume (Units) Forecast by Key Occlusive Ingredient Type, 2020-2035
  • Table 55: East Asia Market Value (USD Million) Forecast by End Use Applications, 2020-2035
  • Table 56: East Asia Market Volume (Units) Forecast by End Use Applications, 2020-2035
  • Table 57: East Asia Market Value (USD Million) Forecast by Packaging Format, 2020-2035
  • Table 58: East Asia Market Volume (Units) Forecast by Packaging Format, 2020-2035
  • Table 59: East Asia Market Value (USD Million) Forecast by Distribution Channel, 2020-2035
  • Table 60: East Asia Market Volume (Units) Forecast by Distribution Channel, 2020-2035
  • Table 61: South Asia & Pacific Market Value (USD Million) Forecast by Country, 2020-2035
  • Table 62: South Asia & Pacific Market Volume (Units) Forecast by Country, 2020-2035
  • Table 63: South Asia & Pacific Market Value (USD Million) Forecast by Product Format, 2020-2035
  • Table 64: South Asia & Pacific Market Volume (Units) Forecast by Product Format, 2020-2035
  • Table 65: South Asia & Pacific Market Value (USD Million) Forecast by Key Occlusive Ingredient Type, 2020-2035
  • Table 66: South Asia & Pacific Market Volume (Units) Forecast by Key Occlusive Ingredient Type, 2020-2035
  • Table 67: South Asia & Pacific Market Value (USD Million) Forecast by End Use Applications, 2020-2035
  • Table 68: South Asia & Pacific Market Volume (Units) Forecast by End Use Applications, 2020-2035
  • Table 69: South Asia & Pacific Market Value (USD Million) Forecast by Packaging Format, 2020-2035
  • Table 70: South Asia & Pacific Market Volume (Units) Forecast by Packaging Format, 2020-2035
  • Table 71: South Asia & Pacific Market Value (USD Million) Forecast by Distribution Channel, 2020-2035
  • Table 72: South Asia & Pacific Market Volume (Units) Forecast by Distribution Channel, 2020-2035
  • Table 73: Middle East and Africa Market Value (USD Million) Forecast by Country, 2020-2035
  • Table 74: Middle East and Africa Market Volume (Units) Forecast by Country, 2020-2035
  • Table 75: Middle East and Africa Market Value (USD Million) Forecast by Product Format, 2020-2035
  • Table 76: Middle East and Africa Market Volume (Units) Forecast by Product Format, 2020-2035
  • Table 77: Middle East and Africa Market Value (USD Million) Forecast by Key Occlusive Ingredient Type, 2020-2035
  • Table 78: Middle East and Africa Market Volume (Units) Forecast by Key Occlusive Ingredient Type, 2020-2035
  • Table 79: Middle East and Africa Market Value (USD Million) Forecast by End Use Applications, 2020-2035
  • Table 80: Middle East and Africa Market Volume (Units) Forecast by End Use Applications, 2020-2035
  • Table 81: Middle East and Africa Market Value (USD Million) Forecast by Packaging Format, 2020-2035
  • Table 82: Middle East and Africa Market Volume (Units) Forecast by Packaging Format, 2020-2035
  • Table 83: Middle East and Africa Market Value (USD Million) Forecast by Distribution Channel, 2020-2035
  • Table 84: Middle East and Africa Market Volume (Units) Forecast by Distribution Channel, 2020-2035

List of Figures

  • Figure 1: Global Market Value (USD Million) by Product Format, 2025-2035
  • Figure 2: Global Market Value (USD Million) by Key Occlusive Ingredient Type, 2025-2035
  • Figure 3: Global Market Value (USD Million) by End Use Applications, 2025-2035
  • Figure 4: Global Market Value (USD Million) by Packaging Format, 2025-2035
  • Figure 5: Global Market Value (USD Million) by Distribution Channel, 2025-2035
  • Figure 6: Global Market Value (USD Million) by Region, 2025-2035
  • Figure 7: Global Market Value (USD Million) Analysis by Region, 2020-2035
  • Figure 8: Global Market Volume (Units) Analysis by Region, 2020-2035
  • Figure 9: Global Market Value Share (%) and BPS Analysis by Region, 2025-2035
  • Figure 10: Global Market Y-o-Y Growth (%) Projections by Region, 2025-2035
  • Figure 11: Global Market Value (USD Million) Analysis by Product Format, 2020-2035
  • Figure 12: Global Market Volume (Units) Analysis by Product Format, 2020-2035
  • Figure 13: Global Market Value Share (%) and BPS Analysis by Product Format, 2025-2035
  • Figure 14: Global Market Y-o-Y Growth (%) Projections by Product Format, 2025-2035
  • Figure 15: Global Market Value (USD Million) Analysis by Key Occlusive Ingredient Type, 2020-2035
  • Figure 16: Global Market Volume (Units) Analysis by Key Occlusive Ingredient Type, 2020-2035
  • Figure 17: Global Market Value Share (%) and BPS Analysis by Key Occlusive Ingredient Type, 2025-2035
  • Figure 18: Global Market Y-o-Y Growth (%) Projections by Key Occlusive Ingredient Type, 2025-2035
  • Figure 19: Global Market Value (USD Million) Analysis by End Use Applications, 2020-2035
  • Figure 20: Global Market Volume (Units) Analysis by End Use Applications, 2020-2035
  • Figure 21: Global Market Value Share (%) and BPS Analysis by End Use Applications, 2025-2035
  • Figure 22: Global Market Y-o-Y Growth (%) Projections by End Use Applications, 2025-2035
  • Figure 23: Global Market Value (USD Million) Analysis by Packaging Format, 2020-2035
  • Figure 24: Global Market Volume (Units) Analysis by Packaging Format, 2020-2035
  • Figure 25: Global Market Value Share (%) and BPS Analysis by Packaging Format, 2025-2035
  • Figure 26: Global Market Y-o-Y Growth (%) Projections by Packaging Format, 2025-2035
  • Figure 27: Global Market Value (USD Million) Analysis by Distribution Channel, 2020-2035
  • Figure 28: Global Market Volume (Units) Analysis by Distribution Channel, 2020-2035
  • Figure 29: Global Market Value Share (%) and BPS Analysis by Distribution Channel, 2025-2035
  • Figure 30: Global Market Y-o-Y Growth (%) Projections by Distribution Channel, 2025-2035
  • Figure 31: Global Market Attractiveness by Product Format, 2025-2035
  • Figure 32: Global Market Attractiveness by Key Occlusive Ingredient Type, 2025-2035
  • Figure 33: Global Market Attractiveness by End Use Applications, 2025-2035
  • Figure 34: Global Market Attractiveness by Packaging Format, 2025-2035
  • Figure 35: Global Market Attractiveness by Distribution Channel, 2025-2035
  • Figure 36: Global Market Attractiveness by Region, 2025-2035
  • Figure 37: North America Market Value (USD Million) by Product Format, 2025-2035
  • Figure 38: North America Market Value (USD Million) by Key Occlusive Ingredient Type, 2025-2035
  • Figure 39: North America Market Value (USD Million) by End Use Applications, 2025-2035
  • Figure 40: North America Market Value (USD Million) by Packaging Format, 2025-2035
  • Figure 41: North America Market Value (USD Million) by Distribution Channel, 2025-2035
  • Figure 42: North America Market Value (USD Million) by Country, 2025-2035
  • Figure 43: North America Market Value (USD Million) Analysis by Country, 2020-2035
  • Figure 44: North America Market Volume (Units) Analysis by Country, 2020-2035
  • Figure 45: North America Market Value Share (%) and BPS Analysis by Country, 2025-2035
  • Figure 46: North America Market Y-o-Y Growth (%) Projections by Country, 2025-2035
  • Figure 47: North America Market Value (USD Million) Analysis by Product Format, 2020-2035
  • Figure 48: North America Market Volume (Units) Analysis by Product Format, 2020-2035
  • Figure 49: North America Market Value Share (%) and BPS Analysis by Product Format, 2025-2035
  • Figure 50: North America Market Y-o-Y Growth (%) Projections by Product Format, 2025-2035
  • Figure 51: North America Market Value (USD Million) Analysis by Key Occlusive Ingredient Type, 2020-2035
  • Figure 52: North America Market Volume (Units) Analysis by Key Occlusive Ingredient Type, 2020-2035
  • Figure 53: North America Market Value Share (%) and BPS Analysis by Key Occlusive Ingredient Type, 2025-2035
  • Figure 54: North America Market Y-o-Y Growth (%) Projections by Key Occlusive Ingredient Type, 2025-2035
  • Figure 55: North America Market Value (USD Million) Analysis by End Use Applications, 2020-2035
  • Figure 56: North America Market Volume (Units) Analysis by End Use Applications, 2020-2035
  • Figure 57: North America Market Value Share (%) and BPS Analysis by End Use Applications, 2025-2035
  • Figure 58: North America Market Y-o-Y Growth (%) Projections by End Use Applications, 2025-2035
  • Figure 59: North America Market Value (USD Million) Analysis by Packaging Format, 2020-2035
  • Figure 60: North America Market Volume (Units) Analysis by Packaging Format, 2020-2035
  • Figure 61: North America Market Value Share (%) and BPS Analysis by Packaging Format, 2025-2035
  • Figure 62: North America Market Y-o-Y Growth (%) Projections by Packaging Format, 2025-2035
  • Figure 63: North America Market Value (USD Million) Analysis by Distribution Channel, 2020-2035
  • Figure 64: North America Market Volume (Units) Analysis by Distribution Channel, 2020-2035
  • Figure 65: North America Market Value Share (%) and BPS Analysis by Distribution Channel, 2025-2035
  • Figure 66: North America Market Y-o-Y Growth (%) Projections by Distribution Channel, 2025-2035
  • Figure 67: North America Market Attractiveness by Product Format, 2025-2035
  • Figure 68: North America Market Attractiveness by Key Occlusive Ingredient Type, 2025-2035
  • Figure 69: North America Market Attractiveness by End Use Applications, 2025-2035
  • Figure 70: North America Market Attractiveness by Packaging Format, 2025-2035
  • Figure 71: North America Market Attractiveness by Distribution Channel, 2025-2035
  • Figure 72: North America Market Attractiveness by Country, 2025-2035
  • Figure 73: Latin America Market Value (USD Million) by Product Format, 2025-2035
  • Figure 74: Latin America Market Value (USD Million) by Key Occlusive Ingredient Type, 2025-2035
  • Figure 75: Latin America Market Value (USD Million) by End Use Applications, 2025-2035
  • Figure 76: Latin America Market Value (USD Million) by Packaging Format, 2025-2035
  • Figure 77: Latin America Market Value (USD Million) by Distribution Channel, 2025-2035
  • Figure 78: Latin America Market Value (USD Million) by Country, 2025-2035
  • Figure 79: Latin America Market Value (USD Million) Analysis by Country, 2020-2035
  • Figure 80: Latin America Market Volume (Units) Analysis by Country, 2020-2035
  • Figure 81: Latin America Market Value Share (%) and BPS Analysis by Country, 2025-2035
  • Figure 82: Latin America Market Y-o-Y Growth (%) Projections by Country, 2025-2035
  • Figure 83: Latin America Market Value (USD Million) Analysis by Product Format, 2020-2035
  • Figure 84: Latin America Market Volume (Units) Analysis by Product Format, 2020-2035
  • Figure 85: Latin America Market Value Share (%) and BPS Analysis by Product Format, 2025-2035
  • Figure 86: Latin America Market Y-o-Y Growth (%) Projections by Product Format, 2025-2035
  • Figure 87: Latin America Market Value (USD Million) Analysis by Key Occlusive Ingredient Type, 2020-2035
  • Figure 88: Latin America Market Volume (Units) Analysis by Key Occlusive Ingredient Type, 2020-2035
  • Figure 89: Latin America Market Value Share (%) and BPS Analysis by Key Occlusive Ingredient Type, 2025-2035
  • Figure 90: Latin America Market Y-o-Y Growth (%) Projections by Key Occlusive Ingredient Type, 2025-2035
  • Figure 91: Latin America Market Value (USD Million) Analysis by End Use Applications, 2020-2035
  • Figure 92: Latin America Market Volume (Units) Analysis by End Use Applications, 2020-2035
  • Figure 93: Latin America Market Value Share (%) and BPS Analysis by End Use Applications, 2025-2035
  • Figure 94: Latin America Market Y-o-Y Growth (%) Projections by End Use Applications, 2025-2035
  • Figure 95: Latin America Market Value (USD Million) Analysis by Packaging Format, 2020-2035
  • Figure 96: Latin America Market Volume (Units) Analysis by Packaging Format, 2020-2035
  • Figure 97: Latin America Market Value Share (%) and BPS Analysis by Packaging Format, 2025-2035
  • Figure 98: Latin America Market Y-o-Y Growth (%) Projections by Packaging Format, 2025-2035
  • Figure 99: Latin America Market Value (USD Million) Analysis by Distribution Channel, 2020-2035
  • Figure 100: Latin America Market Volume (Units) Analysis by Distribution Channel, 2020-2035
  • Figure 101: Latin America Market Value Share (%) and BPS Analysis by Distribution Channel, 2025-2035
  • Figure 102: Latin America Market Y-o-Y Growth (%) Projections by Distribution Channel, 2025-2035
  • Figure 103: Latin America Market Attractiveness by Product Format, 2025-2035
  • Figure 104: Latin America Market Attractiveness by Key Occlusive Ingredient Type, 2025-2035
  • Figure 105: Latin America Market Attractiveness by End Use Applications, 2025-2035
  • Figure 106: Latin America Market Attractiveness by Packaging Format, 2025-2035
  • Figure 107: Latin America Market Attractiveness by Distribution Channel, 2025-2035
  • Figure 108: Latin America Market Attractiveness by Country, 2025-2035
  • Figure 109: Europe Market Value (USD Million) by Product Format, 2025-2035
  • Figure 110: Europe Market Value (USD Million) by Key Occlusive Ingredient Type, 2025-2035
  • Figure 111: Europe Market Value (USD Million) by End Use Applications, 2025-2035
  • Figure 112: Europe Market Value (USD Million) by Packaging Format, 2025-2035
  • Figure 113: Europe Market Value (USD Million) by Distribution Channel, 2025-2035
  • Figure 114: Europe Market Value (USD Million) by Country, 2025-2035
  • Figure 115: Europe Market Value (USD Million) Analysis by Country, 2020-2035
  • Figure 116: Europe Market Volume (Units) Analysis by Country, 2020-2035
  • Figure 117: Europe Market Value Share (%) and BPS Analysis by Country, 2025-2035
  • Figure 118: Europe Market Y-o-Y Growth (%) Projections by Country, 2025-2035
  • Figure 119: Europe Market Value (USD Million) Analysis by Product Format, 2020-2035
  • Figure 120: Europe Market Volume (Units) Analysis by Product Format, 2020-2035
  • Figure 121: Europe Market Value Share (%) and BPS Analysis by Product Format, 2025-2035
  • Figure 122: Europe Market Y-o-Y Growth (%) Projections by Product Format, 2025-2035
  • Figure 123: Europe Market Value (USD Million) Analysis by Key Occlusive Ingredient Type, 2020-2035
  • Figure 124: Europe Market Volume (Units) Analysis by Key Occlusive Ingredient Type, 2020-2035
  • Figure 125: Europe Market Value Share (%) and BPS Analysis by Key Occlusive Ingredient Type, 2025-2035
  • Figure 126: Europe Market Y-o-Y Growth (%) Projections by Key Occlusive Ingredient Type, 2025-2035
  • Figure 127: Europe Market Value (USD Million) Analysis by End Use Applications, 2020-2035
  • Figure 128: Europe Market Volume (Units) Analysis by End Use Applications, 2020-2035
  • Figure 129: Europe Market Value Share (%) and BPS Analysis by End Use Applications, 2025-2035
  • Figure 130: Europe Market Y-o-Y Growth (%) Projections by End Use Applications, 2025-2035
  • Figure 131: Europe Market Value (USD Million) Analysis by Packaging Format, 2020-2035
  • Figure 132: Europe Market Volume (Units) Analysis by Packaging Format, 2020-2035
  • Figure 133: Europe Market Value Share (%) and BPS Analysis by Packaging Format, 2025-2035
  • Figure 134: Europe Market Y-o-Y Growth (%) Projections by Packaging Format, 2025-2035
  • Figure 135: Europe Market Value (USD Million) Analysis by Distribution Channel, 2020-2035
  • Figure 136: Europe Market Volume (Units) Analysis by Distribution Channel, 2020-2035
  • Figure 137: Europe Market Value Share (%) and BPS Analysis by Distribution Channel, 2025-2035
  • Figure 138: Europe Market Y-o-Y Growth (%) Projections by Distribution Channel, 2025-2035
  • Figure 139: Europe Market Attractiveness by Product Format, 2025-2035
  • Figure 140: Europe Market Attractiveness by Key Occlusive Ingredient Type, 2025-2035
  • Figure 141: Europe Market Attractiveness by End Use Applications, 2025-2035
  • Figure 142: Europe Market Attractiveness by Packaging Format, 2025-2035
  • Figure 143: Europe Market Attractiveness by Distribution Channel, 2025-2035
  • Figure 144: Europe Market Attractiveness by Country, 2025-2035
  • Figure 145: East Asia Market Value (USD Million) by Product Format, 2025-2035
  • Figure 146: East Asia Market Value (USD Million) by Key Occlusive Ingredient Type, 2025-2035
  • Figure 147: East Asia Market Value (USD Million) by End Use Applications, 2025-2035
  • Figure 148: East Asia Market Value (USD Million) by Packaging Format, 2025-2035
  • Figure 149: East Asia Market Value (USD Million) by Distribution Channel, 2025-2035
  • Figure 150: East Asia Market Value (USD Million) by Country, 2025-2035
  • Figure 151: East Asia Market Value (USD Million) Analysis by Country, 2020-2035
  • Figure 152: East Asia Market Volume (Units) Analysis by Country, 2020-2035
  • Figure 153: East Asia Market Value Share (%) and BPS Analysis by Country, 2025-2035
  • Figure 154: East Asia Market Y-o-Y Growth (%) Projections by Country, 2025-2035
  • Figure 155: East Asia Market Value (USD Million) Analysis by Product Format, 2020-2035
  • Figure 156: East Asia Market Volume (Units) Analysis by Product Format, 2020-2035
  • Figure 157: East Asia Market Value Share (%) and BPS Analysis by Product Format, 2025-2035
  • Figure 158: East Asia Market Y-o-Y Growth (%) Projections by Product Format, 2025-2035
  • Figure 159: East Asia Market Value (USD Million) Analysis by Key Occlusive Ingredient Type, 2020-2035
  • Figure 160: East Asia Market Volume (Units) Analysis by Key Occlusive Ingredient Type, 2020-2035
  • Figure 161: East Asia Market Value Share (%) and BPS Analysis by Key Occlusive Ingredient Type, 2025-2035
  • Figure 162: East Asia Market Y-o-Y Growth (%) Projections by Key Occlusive Ingredient Type, 2025-2035
  • Figure 163: East Asia Market Value (USD Million) Analysis by End Use Applications, 2020-2035
  • Figure 164: East Asia Market Volume (Units) Analysis by End Use Applications, 2020-2035
  • Figure 165: East Asia Market Value Share (%) and BPS Analysis by End Use Applications, 2025-2035
  • Figure 166: East Asia Market Y-o-Y Growth (%) Projections by End Use Applications, 2025-2035
  • Figure 167: East Asia Market Value (USD Million) Analysis by Packaging Format, 2020-2035
  • Figure 168: East Asia Market Volume (Units) Analysis by Packaging Format, 2020-2035
  • Figure 169: East Asia Market Value Share (%) and BPS Analysis by Packaging Format, 2025-2035
  • Figure 170: East Asia Market Y-o-Y Growth (%) Projections by Packaging Format, 2025-2035
  • Figure 171: East Asia Market Value (USD Million) Analysis by Distribution Channel, 2020-2035
  • Figure 172: East Asia Market Volume (Units) Analysis by Distribution Channel, 2020-2035
  • Figure 173: East Asia Market Value Share (%) and BPS Analysis by Distribution Channel, 2025-2035
  • Figure 174: East Asia Market Y-o-Y Growth (%) Projections by Distribution Channel, 2025-2035
  • Figure 175: East Asia Market Attractiveness by Product Format, 2025-2035
  • Figure 176: East Asia Market Attractiveness by Key Occlusive Ingredient Type, 2025-2035
  • Figure 177: East Asia Market Attractiveness by End Use Applications, 2025-2035
  • Figure 178: East Asia Market Attractiveness by Packaging Format, 2025-2035
  • Figure 179: East Asia Market Attractiveness by Distribution Channel, 2025-2035
  • Figure 180: East Asia Market Attractiveness by Country, 2025-2035
  • Figure 181: South Asia & Pacific Market Value (USD Million) by Product Format, 2025-2035
  • Figure 182: South Asia & Pacific Market Value (USD Million) by Key Occlusive Ingredient Type, 2025-2035
  • Figure 183: South Asia & Pacific Market Value (USD Million) by End Use Applications, 2025-2035
  • Figure 184: South Asia & Pacific Market Value (USD Million) by Packaging Format, 2025-2035
  • Figure 185: South Asia & Pacific Market Value (USD Million) by Distribution Channel, 2025-2035
  • Figure 186: South Asia & Pacific Market Value (USD Million) by Country, 2025-2035
  • Figure 187: South Asia & Pacific Market Value (USD Million) Analysis by Country, 2020-2035
  • Figure 188: South Asia & Pacific Market Volume (Units) Analysis by Country, 2020-2035
  • Figure 189: South Asia & Pacific Market Value Share (%) and BPS Analysis by Country, 2025-2035
  • Figure 190: South Asia & Pacific Market Y-o-Y Growth (%) Projections by Country, 2025-2035
  • Figure 191: South Asia & Pacific Market Value (USD Million) Analysis by Product Format, 2020-2035
  • Figure 192: South Asia & Pacific Market Volume (Units) Analysis by Product Format, 2020-2035
  • Figure 193: South Asia & Pacific Market Value Share (%) and BPS Analysis by Product Format, 2025-2035
  • Figure 194: South Asia & Pacific Market Y-o-Y Growth (%) Projections by Product Format, 2025-2035
  • Figure 195: South Asia & Pacific Market Value (USD Million) Analysis by Key Occlusive Ingredient Type, 2020-2035
  • Figure 196: South Asia & Pacific Market Volume (Units) Analysis by Key Occlusive Ingredient Type, 2020-2035
  • Figure 197: South Asia & Pacific Market Value Share (%) and BPS Analysis by Key Occlusive Ingredient Type, 2025-2035
  • Figure 198: South Asia & Pacific Market Y-o-Y Growth (%) Projections by Key Occlusive Ingredient Type, 2025-2035
  • Figure 199: South Asia & Pacific Market Value (USD Million) Analysis by End Use Applications, 2020-2035
  • Figure 200: South Asia & Pacific Market Volume (Units) Analysis by End Use Applications, 2020-2035
  • Figure 201: South Asia & Pacific Market Value Share (%) and BPS Analysis by End Use Applications, 2025-2035
  • Figure 202: South Asia & Pacific Market Y-o-Y Growth (%) Projections by End Use Applications, 2025-2035
  • Figure 203: South Asia & Pacific Market Value (USD Million) Analysis by Packaging Format, 2020-2035
  • Figure 204: South Asia & Pacific Market Volume (Units) Analysis by Packaging Format, 2020-2035
  • Figure 205: South Asia & Pacific Market Value Share (%) and BPS Analysis by Packaging Format, 2025-2035
  • Figure 206: South Asia & Pacific Market Y-o-Y Growth (%) Projections by Packaging Format, 2025-2035
  • Figure 207: South Asia & Pacific Market Value (USD Million) Analysis by Distribution Channel, 2020-2035
  • Figure 208: South Asia & Pacific Market Volume (Units) Analysis by Distribution Channel, 2020-2035
  • Figure 209: South Asia & Pacific Market Value Share (%) and BPS Analysis by Distribution Channel, 2025-2035
  • Figure 210: South Asia & Pacific Market Y-o-Y Growth (%) Projections by Distribution Channel, 2025-2035
  • Figure 211: South Asia & Pacific Market Attractiveness by Product Format, 2025-2035
  • Figure 212: South Asia & Pacific Market Attractiveness by Key Occlusive Ingredient Type, 2025-2035
  • Figure 213: South Asia & Pacific Market Attractiveness by End Use Applications, 2025-2035
  • Figure 214: South Asia & Pacific Market Attractiveness by Packaging Format, 2025-2035
  • Figure 215: South Asia & Pacific Market Attractiveness by Distribution Channel, 2025-2035
  • Figure 216: South Asia & Pacific Market Attractiveness by Country, 2025-2035
  • Figure 217: Middle East and Africa Market Value (USD Million) by Product Format, 2025-2035
  • Figure 218: Middle East and Africa Market Value (USD Million) by Key Occlusive Ingredient Type, 2025-2035
  • Figure 219: Middle East and Africa Market Value (USD Million) by End Use Applications, 2025-2035
  • Figure 220: Middle East and Africa Market Value (USD Million) by Packaging Format, 2025-2035
  • Figure 221: Middle East and Africa Market Value (USD Million) by Distribution Channel, 2025-2035
  • Figure 222: Middle East and Africa Market Value (USD Million) by Country, 2025-2035
  • Figure 223: Middle East and Africa Market Value (USD Million) Analysis by Country, 2020-2035
  • Figure 224: Middle East and Africa Market Volume (Units) Analysis by Country, 2020-2035
  • Figure 225: Middle East and Africa Market Value Share (%) and BPS Analysis by Country, 2025-2035
  • Figure 226: Middle East and Africa Market Y-o-Y Growth (%) Projections by Country, 2025-2035
  • Figure 227: Middle East and Africa Market Value (USD Million) Analysis by Product Format, 2020-2035
  • Figure 228: Middle East and Africa Market Volume (Units) Analysis by Product Format, 2020-2035
  • Figure 229: Middle East and Africa Market Value Share (%) and BPS Analysis by Product Format, 2025-2035
  • Figure 230: Middle East and Africa Market Y-o-Y Growth (%) Projections by Product Format, 2025-2035
  • Figure 231: Middle East and Africa Market Value (USD Million) Analysis by Key Occlusive Ingredient Type, 2020-2035
  • Figure 232: Middle East and Africa Market Volume (Units) Analysis by Key Occlusive Ingredient Type, 2020-2035
  • Figure 233: Middle East and Africa Market Value Share (%) and BPS Analysis by Key Occlusive Ingredient Type, 2025-2035
  • Figure 234: Middle East and Africa Market Y-o-Y Growth (%) Projections by Key Occlusive Ingredient Type, 2025-2035
  • Figure 235: Middle East and Africa Market Value (USD Million) Analysis by End Use Applications, 2020-2035
  • Figure 236: Middle East and Africa Market Volume (Units) Analysis by End Use Applications, 2020-2035
  • Figure 237: Middle East and Africa Market Value Share (%) and BPS Analysis by End Use Applications, 2025-2035
  • Figure 238: Middle East and Africa Market Y-o-Y Growth (%) Projections by End Use Applications, 2025-2035
  • Figure 239: Middle East and Africa Market Value (USD Million) Analysis by Packaging Format, 2020-2035
  • Figure 240: Middle East and Africa Market Volume (Units) Analysis by Packaging Format, 2020-2035
  • Figure 241: Middle East and Africa Market Value Share (%) and BPS Analysis by Packaging Format, 2025-2035
  • Figure 242: Middle East and Africa Market Y-o-Y Growth (%) Projections by Packaging Format, 2025-2035
  • Figure 243: Middle East and Africa Market Value (USD Million) Analysis by Distribution Channel, 2020-2035
  • Figure 244: Middle East and Africa Market Volume (Units) Analysis by Distribution Channel, 2020-2035
  • Figure 245: Middle East and Africa Market Value Share (%) and BPS Analysis by Distribution Channel, 2025-2035
  • Figure 246: Middle East and Africa Market Y-o-Y Growth (%) Projections by Distribution Channel, 2025-2035
  • Figure 247: Middle East and Africa Market Attractiveness by Product Format, 2025-2035
  • Figure 248: Middle East and Africa Market Attractiveness by Key Occlusive Ingredient Type, 2025-2035
  • Figure 249: Middle East and Africa Market Attractiveness by End Use Applications, 2025-2035
  • Figure 250: Middle East and Africa Market Attractiveness by Packaging Format, 2025-2035
  • Figure 251: Middle East and Africa Market Attractiveness by Distribution Channel, 2025-2035
  • Figure 252: Middle East and Africa Market Attractiveness by Country, 2025-2035

Frequently Asked Questions

How big is the Slugging Creams Market in 2025?

The global Slugging Creams Market is estimated to be valued at USD 2,290.30 million in 2025.

What will be the size of Slugging Creams Market in 2035?

The market size for the Slugging Creams Market is projected to reach USD 3,800.50 million by 2035.

How much will be the Slugging Creams Market growth between 2025 and 2035?

The Slugging Creams Market is expected to grow at a 5.2% CAGR between 2025 and 2035.

What are the key product types in the Slugging Creams Market?

The key product types in the Slugging Creams Market are occlusive creams, hybrid barrier creams, jelly-based formulas, balm-to-cream formats, and multi-functional slugging treatments.

Which range segment to contribute significant share in the Slugging Creams Market in 2025?

In terms of product functionality, occlusive repair creams segment is anticipated to command a 37.2% share in the Slugging Creams Market in 2025.

Explore Similar Insights

Future Market Insights

Slugging Creams Market