Antioxidant-Rich Fruit Oils Market Size and Share Forecast Outlook 2025 to 2035

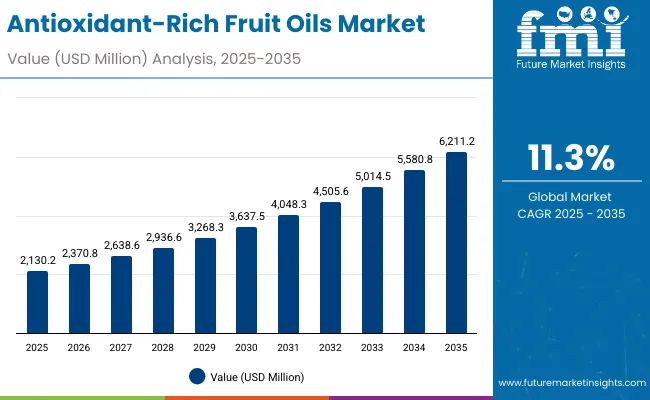
The market for antioxidant-rich fruit oils is expected to be valued at USD 2,130.2 million in 2025 and projected to reach USD 6,211.2 million by 2035, reflecting a total incremental growth of USD 4,081 million over the decade. This trajectory indicates a CAGR of 11.3%, suggesting the market is set to expand by nearly three times its initial size.
Quick Stats for Antioxidant-Rich Fruit Oils Market

  • Antioxidant-Rich Fruit Oils Market Value (2025): USD 2,130.2 million
  • Antioxidant-Rich Fruit Oils Market Forecast Value (2035): USD 6,211.2 million
  • Antioxidant-Rich Fruit Oils Market Forecast CAGR (2025 to 2035): 11.3%
  • Leading Segment in 2025 (By Oil Type): Pomegranate Oil (23.5%)
  • Key Growth Regions: North America, Asia-Pacific, Europe
  • Top Key Players: BASF SE, DSM-Firmenich, Croda International, Givaudan, Ashland, Sabinsa Corporation, Aromtech, Aldivia, Organic Harvest, Eminence Organics

Antioxidant Rich Fruit Oils Market

Antioxidant-Rich Fruit Oils Market Key Takeaways

Metric Value
Market Estimated Value In (2025e) USD 2,130.2 million
Market Forecast Value In (2035f) USD 6,211.2 million
Forecast CAGR (2025 to 2035) 11.30%

The scale of transformation is expected to be particularly significant in the latter half of the forecast period, during which consumer demand is anticipated to shift toward clinically backed natural actives and skin-rejuvenating oil blends.

Between 2025 and 2030, the market is expected to grow from USD 2,130.2 million to USD 3,637.5 million, witnessing a net increase of USD 1,507.3 million. This growth phase is likely to be driven by a surge in serum applications and a rise in anti-aging skincare routines, as more consumers seek multifunctional natural oils over synthetic actives. Serums are anticipated to maintain their dominance within product types, accounting for approximately 45.5% of the market share in 2025, due to their rapid absorption and compatibility with fruit-oil infusion.

From 2030 to 2035, a stronger acceleration is expected as the market progresses from USD 3,637.5 million to USD 6,211.2 million, contributing USD 2,573.7 million in growth, or nearly 63% of the decade’s overall increase. This momentum will likely be shaped by wider acceptance of plant-based beauty solutions across Asia-Pacific, along with e-commerce-driven premium oil launches tailored for personalized skincare systems.

From 2020 to 2024, the market expanded from USD 1,500.7 million to USD 2,016.4 million, driven by growing demand for botanical skincare actives. During this period, major players such as Croda, DSM-Firmenich, and Givaudan captured a combined 41.6% share, owing to their integrated ingredient portfolios and supply chain strength. Innovation was centered around fruit-based antioxidant oils tailored for clean-label cosmetic applications.

By 2025, demand is projected to reach USD 2,130.2 million, marking a significant turning point as digitally-native brands, white-label D2C models, and ayurveda-aligned beauty startups expand market participation. The revenue mix is expected to shift from commodity bulk oils to premium, functional extracts with targeted claims (e.g., anti-aging, UV protection, barrier repair). As recurring demand rises, the focus will increasingly move toward bioavailability, sustainability certifications, and traceability mechanisms. Competitive advantage is set to be defined by brand transparency, scientific validation, and personalized wellness integration.

Why the Antioxidant-Rich Fruit Oils Market is growing?

Rapid growth in the antioxidant-rich fruit oils market is being driven by increased consumer awareness around natural skincare solutions and the growing demand for functional botanical ingredients. Rising concerns over oxidative stress, premature aging, and environmental damage have prompted a shift toward fruit oils rich in polyphenols and vitamins. These oils are being preferred due to their dual functionality offering both cosmetic enhancement and long-term skin health support. Greater efficacy has been observed in anti-aging and brightening applications, especially in serums, which are being used more frequently in both mass and premium skincare routines.

The clean beauty movement has played a central role in shaping purchase behavior, with transparency, plant-origin certification, and ingredient traceability being emphasized. Growth has also been supported by the expansion of e-commerce channels, allowing direct-to-consumer brands to offer targeted formulations. As demand rises across Asia-Pacific, particularly in China and India, newer product formats and personalized oil blends are expected to further accelerate adoption across mainstream and niche categories.

Segmental Analysis

The antioxidant-rich fruit oils market has been segmented based on application, product type, and distribution channel to capture evolving consumer preferences, format innovations, and retail dynamics. Application-wise segmentation highlights functional demand, with anti-aging, hydration, and brightening uses driving differentiation. Product type segmentation emphasizes how these oils are being incorporated into formats such as serums, lotions, and hair oils, enabling tailored skincare routines.

Channel-wise segmentation reveals structural shifts in consumer buying behavior, with e-commerce and specialty retail emerging as high-impact touchpoints. Each segment is expected to evolve independently, influenced by personalization trends, ingredient transparency, and changing shelf presentation. Regional nuances, particularly in Asia-Pacific and North America, are likely to further shape performance across these categories. Strategic focus is being placed by brands on optimizing value per segment, as demand expands across price points and demographic groups.
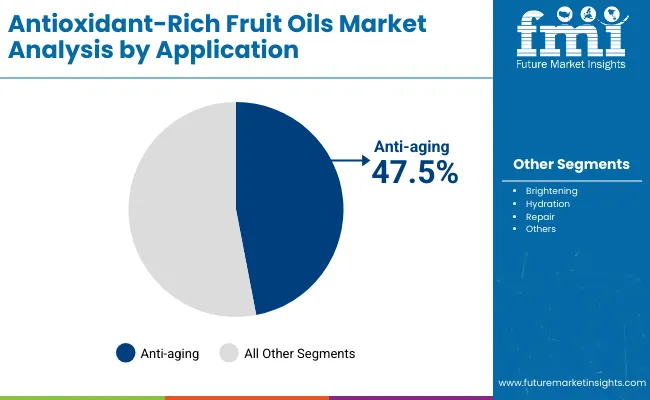
Insights into the Application Segment with Anti-aging Remaining the Core Driver

Antioxidant Rich Fruit Oils Market By Application

Application Market Value Share, 2025
Anti-aging 47.5%
Others 52.5%

The anti-aging segment is expected to hold 47.5% of the market value in 2025, driven by rising concerns around visible skin aging, oxidative damage, and environmental stressors. Fruit oils, especially those derived from pomegranate, acai, and grape seed, are being included in premium routines due to their ability to support collagen synthesis and skin repair. Their compatibility with daily-use formats and long-standing perception as clean-label actives has encouraged broad consumer trust. Brands are increasingly positioning antioxidant-rich oils as both preventive and restorative, appealing to consumers seeking non-invasive skincare solutions. With increasing clinical support and innovation in delivery systems, the anti-aging segment is expected to remain a key revenue contributor throughout the forecast period.
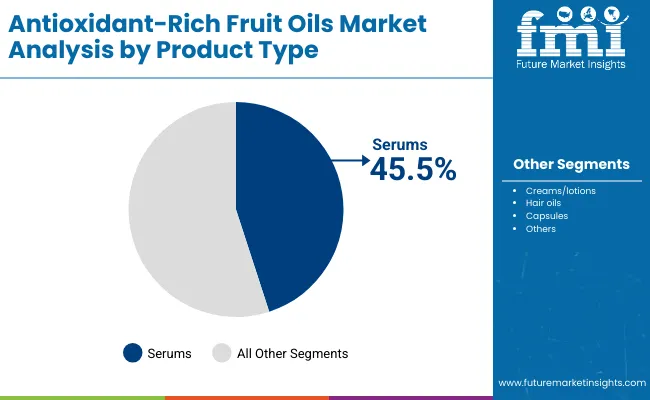
Insights into the Product Type Segment with Serums Driving Penetration

Antioxidant Rich Fruit Oils Market By Product

Product Type Market Value Share, 2025
Serums 45.5%
Others 54.5%

Serums are projected to contribute 45.5% of total market sales in 2025, emerging as the preferred product type for delivering antioxidant-rich fruit oils. Their rapid absorption, lightweight nature, and compatibility with layering routines have supported widespread usage. Brands are focusing on high-purity, cold-pressed oils in serum formats, enabling better stability and bioavailability. Growing awareness about ingredient lists and active concentrations has led consumers to favor serums over conventional creams. Newer oil-in-serum hybrids and waterless formats are also entering the market, targeting sensitive and oily skin types. The flexibility of serum applications from AM/PM routines to booster shots is expected to solidify their role as the most innovation-friendly format in the antioxidant-rich fruit oils space.
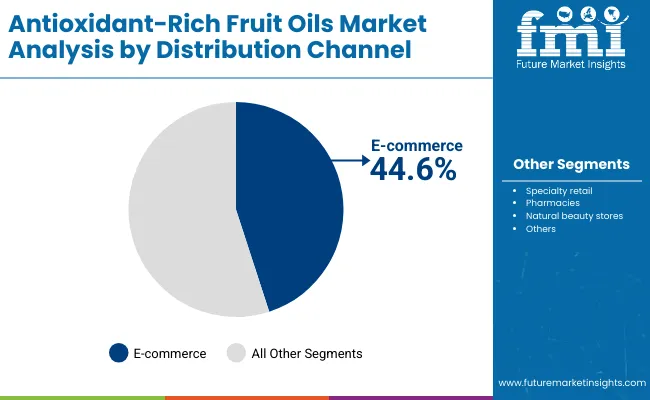
Insights into the Channel Segment with E-commerce Gaining Strategic Importance

Antioxidant Rich Fruit Oils Market By Distribution

Channel Market Value Share, 2025
E-commerce 44.6%
Others 55.5%

E-commerce is projected to account for 44.6% of market value in 2025, reflecting the growing digitization of beauty and personal care purchases. The segment is being driven by the increasing popularity of skincare education content, user reviews, and ingredient-focused product filters. Direct-to-consumer brands are leveraging digital channels to offer targeted formulations and build community-driven marketing ecosystems. Subscription models and personalized quizzes are being used to improve retention and conversion.

In parallel, major online retailers are expanding their clean beauty categories, offering curated collections of antioxidant-rich oils. As consumer confidence in online beauty purchases grows, and delivery reliability improves, the e-commerce channel is expected to unlock greater access and assortment differentiation across both emerging and mature markets.

What are the Drivers, Restraints, and Key Trends of the Antioxidant-Rich Fruit Oils Market?

Increasing consumer scrutiny around ingredient transparency is reshaping the antioxidant-rich fruit oils market, even as innovation in sustainable sourcing, dermal delivery systems, and therapeutic narratives drives accelerated adoption across premium, niche, and dermocosmetic segments.

Clinical Hybridization of Oils with Nutraceutical Attributes

A new era of antioxidant-rich fruit oils is being defined by their clinical repositioning beyond cosmetic hydration toward dermatologically inspired nutraceutical benefits. Oils previously considered cosmetic-grade are now being included in oral capsules and transdermal systems for systemic antioxidant delivery. This evolution is being enabled by joint research initiatives between skincare brands and nutraceutical firms, where the bioactivity of compounds like punicic acid (from pomegranate oil) and resveratrol (from grape seed oil) is being mapped for cellular impact. As cosmeceutical boundaries blur, hybrid oil-based formats are expected to dominate personalization-led premium portfolios.

AI-Personalized Skincare Routines Boosting Functional Oil Customization

Advanced AI-driven diagnostics are being deployed by brands to build tailored oil regimens based on skin pH, melanin index, and oxidative stress levels. This data-backed personalization is encouraging modular oil blending, where fruit oils are selected by algorithmic matching to individual skin biomarkers. These AI-supported platforms are being integrated into D2C and e-commerce ecosystems, creating scalable personalization while enhancing product efficacy narratives. This trend is expected to shift focus from static SKUs to adaptive oil libraries curated in real time.
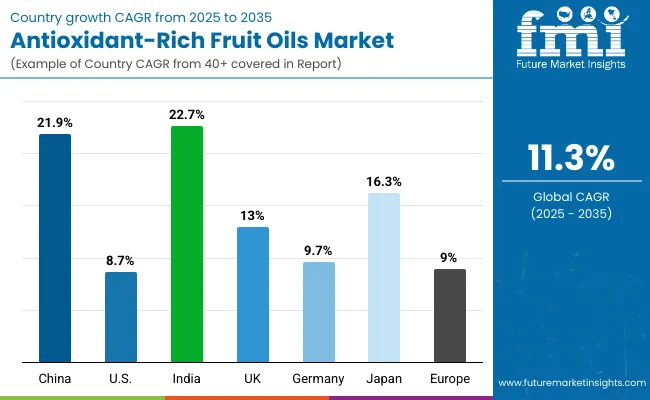
Analysis of Antioxidant-Rich Fruit Oils Market By Key Countries

Antioxidant Rich Fruit Oils Market By Country

Countries CAGR
China 21.9%
USA 8.7%
India 22.7%
UK 13.0%
Germany 9.7%
Japan 16.3%

The global antioxidant-rich fruit oils market is exhibiting clear geographic divergence in growth patterns, shaped by regional wellness culture, regulatory maturity, and consumer sophistication. Asia-Pacific is expected to emerge as the fastest-growing region, led by India at a projected CAGR of 22.7% and China at 21.9%. In both countries, rising urbanization, strong digital commerce ecosystems, and ingredient-led consumer marketing are enabling deeper penetration of clean-label, oil-based skincare products. India's positioning of fruit oils within Ayurvedic and nutraceutical frameworks is creating a differentiated pathway for growth, while China’s expanding middle class and dermocosmetic crossover products are accelerating mass-market accessibility.

Japan is projected to post a CAGR of 16.3%, supported by minimalist routines, high R&D investments, and a consumer base receptive to advanced formulations. Europe presents moderate momentum, with the UK at 13.0% and Germany at 9.7%, driven by regulatory backing for natural actives, dermatological claims compliance, and high-margin premium skincare formats. Market maturity in Germany is influencing product standardization and retail consolidation.

The United States, with a CAGR of 8.7%, reflects a more stabilized yet preimmunized market, where clinical proof, direct-to-consumer channels, and hybrid wellness positioning are being prioritized. Growth across countries is being influenced by local sourcing initiatives, evolving delivery systems, and regulatory harmonization with global natural cosmetic standards.
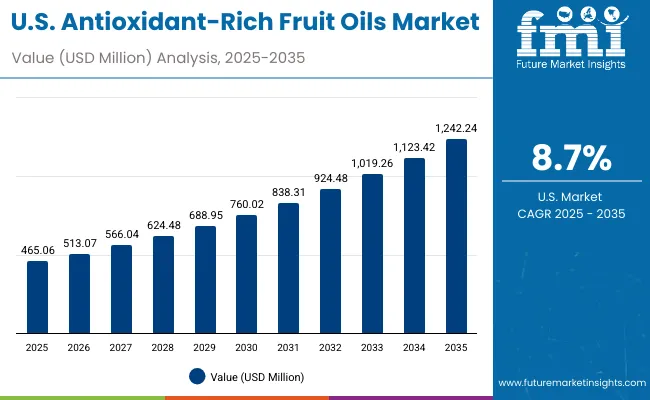
Sales Outlook for Antioxidant-Rich Fruit Oils in the United States

Antioxidant Rich Fruit Oils Market Usa

Year USA Antioxidant-Rich Fruit Oils Market (USD Million)
2025 465.06
2026 513.07
2027 566.04
2028 624.48
2029 688.95
2030 760.02
2031 838.31
2032 924.48
2033 1,019.26
2034 1,123.42
2035 1,242.24

The antioxidant-rich fruit oils market in the United States is expected to expand from USD 465.06 million in 2025 to USD 1,242.24 million by 2035, reflecting a CAGR of 8.7%. This steady rise is being enabled by premiumization trends, ingredient-conscious consumers, and the clinical positioning of natural oils within dermocosmetic frameworks. Consumer behavior has been increasingly shaped by personalized wellness solutions, leading to greater demand for clean-label fruit oils with traceable origins.

Multi-use formats particularly those combining antioxidant-rich oils with retinols, peptides, or vitamins are being introduced to satisfy minimalist skincare routines. Anti-aging continues to anchor product demand, supported by growing interest in collagen support and barrier protection. Retailers are emphasizing digital-first assortments, while subscription-led models are enabling recurring engagement.

  • Clinically backed anti-aging oils remain central to D2C skincare subscriptions
  • Grapeseed, citrus, and pomegranate oil blends are being favored for fast-absorb formulations
  • Personalized beauty kits featuring antioxidant oils are expanding in online retail portfolios

Growth and Expansion Outlook for Antioxidant-Rich Fruit Oils Market in the United Kingdom

A CAGR of 13.0% is projected for the UK antioxidant-rich fruit oils market between 2025 and 2035. Growth is expected to be guided by regulatory shifts favoring natural actives and a maturing consumer preference for skin microbiome-safe oils. British consumers are adopting antioxidant oils not only for facial care but also as part of multifunctional wellness rituals, often tied to stress relief and hormonal balance. Clinical certification, COSMOS-standard compliance, and dermatological endorsements are being used by brands to elevate credibility.

Mass retailers and pharmacy-led chains are integrating premium oils into their natural skincare shelves, while hybrid offerings that combine seed oils with niacinamide or ceramides are expanding. Influencer-led brands are accelerating D2C channel growth, especially within skinimalism trends.

  • Dermatologist-tested clean oils are gaining shelf presence
  • Hybrid textures (oils + serums) are being prioritized for efficacy
  • COSMOS and Soil Association certifications are influencing B2B sourcing
  • Multipurpose use (face, scalp, body) is driving format innovation

Growth and Expansion Outlook for Antioxidant-Rich Fruit Oils Market in India

India is forecasted to grow at a CAGR of 22.7% between 2025 and 2035, positioning it as the fastest-growing market globally. Growth is being shaped by traditional Ayurvedic familiarity with oil-based treatments, now being modernized into cosmeceutical-grade serums, capsules, and multi-functional topicals. Domestic brands are combining antioxidant-rich fruit oils with heritage botanicals like neem, tulsi, and sandalwood to build trust among diverse consumer segments.

Demand is being driven not just by urban elites but by rising disposable incomes in tier-2 and tier-3 cities, where social commerce platforms are enabling access. E-commerce exclusives and festival-linked launches are being used to promote premium oils with clinically supported claims.

  • Ayurvedic-modern hybrid positioning is leading brand innovation
  • Grape seed, pomegranate, and citrus oils are being locally cold-pressed
  • Regional influencer campaigns are shaping vernacular demand
  • Natural oils are being adopted in skin supplements and drinkables

Sales Outlook for Antioxidant-Rich Fruit Oils in China

The Chinese antioxidant-rich fruit oils market is anticipated to grow at a CAGR of 21.9% through 2035, fueled by dermocosmetic convergence and ingredient traceability mandates. Consumers are favoring high-efficacy natural actives supported by TCM (Traditional Chinese Medicine) principles and clinical evidence. Oils derived from goji berries, pomegranate, and citrus peel are being infused into multi-step routines for skin tone correction and oxidative damage repair.

China's regulatory environment is accelerating the clean beauty transition, with stricter INCI disclosures and domestic R&D investment in oil stabilization technologies. Functional oils are being integrated into ampoules, emulsions, and cloud-cream formats tailored to East Asian skin tones and textures.
  • Premium oils are positioned under anti-pollution and blue light defense claims
  • TCM-validated oils are gaining traction among dermocosmetic buyers
  • Ingredient traceability (source-to-shelf) is being enforced via QR-coded SKUs
  • Oils are being adopted in pre-makeup primers and overnight masks

In-depth Analysis of Antioxidant-Rich Fruit Oils in Germany

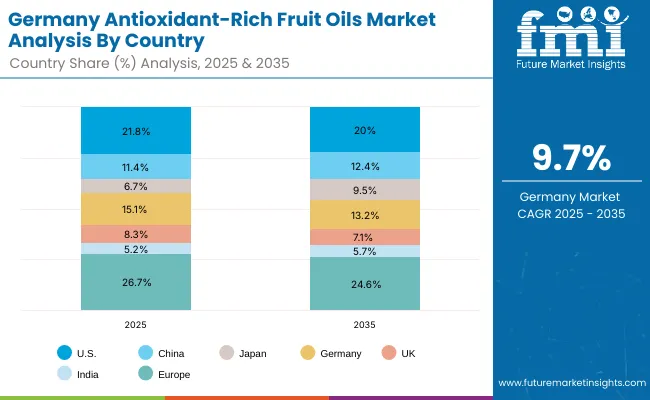
Antioxidant Rich Fruit Oils Market Germany

Countries 2025
USA 21.8%
China 11.4%
Japan 6.7%
Germany 15.1%
UK 8.3%
India 5.2%
Countries 2035
USA 20.0%
China 12.4%
Japan 9.5%
Germany 13.2%
UK 7.1%
India 5.7%

Germany’s antioxidant-rich fruit oils market is projected to grow at a CAGR of 9.7% between 2025 and 2035, supported by high demand for certified organic skincare and pharmacist-recommended formats. German consumers are more cautious, preferring oils tested for sensitization, sustainability, and efficacy under EU cosmetic directives. The market is being driven by aging demographics seeking clinically proven anti-aging oils that offer long-term skin barrier support.

Apothecary-style retail and beauty-pharma hybrids are acting as trust enablers, while BDIH and NATRUE certifications are influencing stocking decisions. Functional oils are being combined with squalene, hyaluronic acid, or bakuchiol to target sensitive, aging skin types.
  • Apothecary and pharmacy channels are key in consumer onboarding
  • High-purity oils are being included in wrinkle repair and firming routines
  • Germany is emerging as a regional testing ground for eco-labeled fruit oils
  • Fragrance-free, dermatologically backed oils are prioritized in senior skincare

Growth Outlook for Antioxidant-Rich Fruit Oils Market in USA

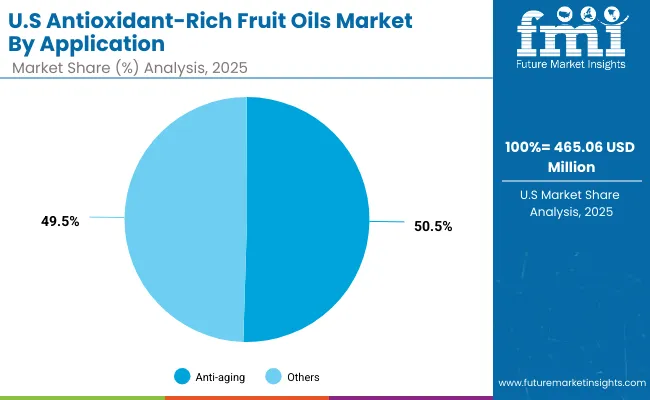
Antioxidant Rich Fruit Oils Market Usa 2

Segment Market Value Share, 2025
Anti-aging 50.5%
Others 49.5%

The USA Antioxidant-Rich Fruit Oils Market is projected at USD 465.06 million in 2025 and is anticipated to expand robustly over the next decade. Anti-aging applications contribute 50.5% of market value, reflecting consumer focus on wrinkle reduction, skin-firming, and protection from oxidative stress, while other applications account for 49.5%, driven by demand for brightening and hydration routines.

This slight dominance of anti-aging reflects a clear consumer shift toward longevity-oriented skincare. Demand is expected to be driven by the rising prevalence of photoaging concerns, pollution exposure, and a cultural emphasis on preventive skincare routines. The growing use of clinically validated antioxidants supported by dermatologist-endorsed claims is expected to enhance brand credibility and lift premiumization.

E-commerce channels are anticipated to amplify reach, offering personalized recommendations and subscription models, which will likely accelerate adoption among younger cohorts seeking early-age intervention products. Innovation in delivery systems, such as microencapsulation and rapid-absorption carriers, is projected to further differentiate offerings and improve bioavailability, strengthening repeat purchase behavior.

With regulatory frameworks increasingly emphasizing ingredient transparency and efficacy substantiation, players investing early in compliance, traceability, and clean-label communication are expected to secure competitive advantage. The market will likely be shaped by integrated solutions combining high-efficacy actives with digital skin diagnostics, creating an environment where science-backed narratives become essential for market leadership.
  • Market size in 2025: USD 465.06 million
  • Anti-aging leads slightly at 50.5% vs. 49.5%
  • Growth supported by clinical claim substantiation, personalized e-commerce strategies, and bioavailable delivery systems

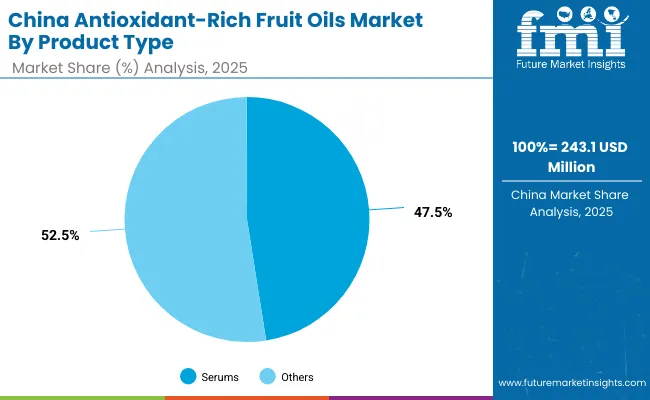
Opportunity Analysis of China Antioxidant-Rich Fruit Oils Market

Antioxidant Rich Fruit Oils Market China

Segment Market Value Share, 2025
Serums 47.5%
Others 52.5%

The Antioxidant-Rich Fruit Oils Market in China is projected to reach USD 243.1 million in 2025, supported by a rapidly expanding premium skincare consumer base and growing affinity for science-backed, natural-origin formulations. Serums contribute 47.5% of the market, reflecting China’s strong demand for highly concentrated formats associated with visible results, while other product formats hold 52.5%, indicating broad-based adoption across creams, oils, and hybrid solutions.

This balanced product-type distribution signals that consumers are embracing a layered skincare approach, where serums act as targeted treatment boosters complemented by other leave-on and rinse-off formats. The strong positioning of serums is expected to be reinforced by K-beauty and C-beauty trends that emphasize multi-step regimens, personalization, and ingredient transparency.

Digital-first commerce ecosystems are projected to play a decisive role in shaping demand. Livestreaming campaigns, influencer-led education, and algorithm-driven product recommendations are likely to boost penetration in Tier 2 and Tier 3 cities. Innovation pipelines are anticipated to prioritize rapid-absorption, bioavailable formulations to meet expectations of younger consumers seeking instant radiance and long-term skin health benefits.

Supply chain resilience and provenance assurance are expected to become critical differentiators as consumers increasingly demand traceable, sustainably sourced fruit oils. Domestic players investing in vertical integration and local processing capabilities are forecast to capture market share by offering price-accessible yet premium-positioned products.
  • Market size in 2025: USD 243.1 million
  • Serums hold 47.5% share vs. 52.5% for other product formats
  • Growth driven by digital commerce expansion, multi-step skincare adoption, and sustainable sourcing focus

Competitive Landscape of Antioxidant-Rich Fruit Oils Market

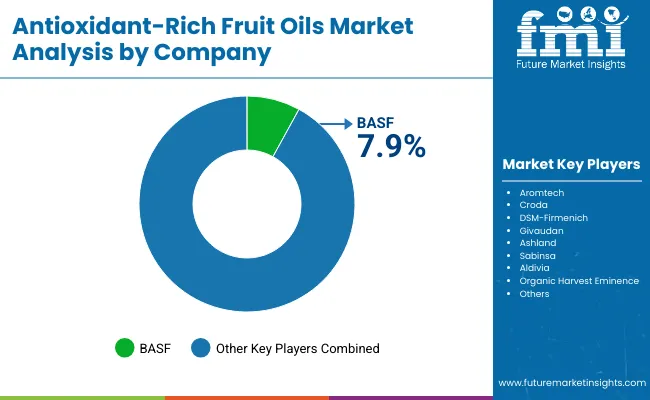
Antioxidant Rich Fruit Oils Market By Company

The antioxidant-rich fruit oils market is moderately fragmented, with global leaders, mid-sized innovators, and niche-focused specialists competing across personal care, nutraceutical, and therapeutic oil applications. Global leaders such as BASF, DSM-Firmenich, and Croda are recognized for their dominance in bioactive ingredient manufacturing, including cold-pressed and stabilized antioxidant-rich oils derived from pomegranate, grape seed, and acai. BASF is estimated to hold the highest global share at approximately 7.9% in 2024, supported by its extensive dermocosmetic portfolio, sustainability certifications, and distribution partnerships.

Mid-sized players including Ashland, Givaudan, and Sabinsa are leveraging their expertise in botanical actives, encapsulation technology, and Ayurvedic ingredient integration. Their competitive edge lies in high-purity, clinically tested oils tailored for anti-aging and brightening applications in cosmeceuticals and clean beauty brands.

Niche-focused specialists such as Aromtech, Aldivia, Organic Harvest, and Eminence Organics are targeting regional markets and functional skincare through limited-edition oils, ethical sourcing, and organic certifications. These brands cater to conscious consumers seeking transparency and artisanal extraction processes.

Competitive focus is shifting toward oil stability enhancement, AI-based personalization, and wellness crossovers. Strategic M&A activity and private-label collaborations are also being used to expand footprint across emerging markets. Long-term differentiation will depend on traceability, formulation compatibility, and omnichannel branding.

Key Developments in Antioxidant-Rich Fruit Oils Market

  • In June 2025, a comprehensive global market report on pomegranate oil was released, projecting that the pomegranate oil industry size would be charted through 2034. Its growing adoption across cosmetics, pharmaceuticals, and nutraceuticals was emphasized. Investments in cold-pressing methods were being advanced.
  • In July 2025, the global grape seed oil market was reported to have reached USD 544.5 million in 2024, with expectations to grow nearly twofold to USD 993.7 million by 2034. The update highlighted momentum in natural product demand and growth potential in personal care and food sectors.

Scope of the Report

Item Value
Quantitative Units USD Million
Market Size (2025) USD 2,130.2 Million
Market Size (2035) USD 6,211.2 Million
CAGR (2025-2035) 11.30%
By Source Pomegranate oil, Grape seed oil, Acai oil, Berry oils, Citrus oils
By Application Anti-aging, Brightening, Hydration, Repair, Others
By Product Type Serums, Creams/lotions, Hair oils, Capsules
By Distribution Channel E-commerce, Specialty retail, Pharmacies, Natural beauty stores
Regions Covered North America, Europe, Asia-Pacific, Latin America, Middle East & Africa
Countries Covered United States, Canada, Germany, France, United Kingdom, China, Japan, India, Brazil, South Korea

Key Segments

By Source:

  • Pomegranate oil
  • Grape seed oil
  • Acai oil
  • Berry oils
  • Citrus oils

By Application:

  • Anti-aging
  • Brightening
  • Hydration
  • Repair

By Product Type:

  • Serums
  • Creams/lotions
  • Hair oils
  • Capsules

By Channel:

  • E-commerce
  • Specialty retail
  • Natural beauty stores
  • Pharmacies

By Region:

  • North America
  • Latin America
  • Europe
  • East Asia
  • South Asia & Pacific
  • Middle East and Africa

Table of Content

  1. Executive Summary
    • Global Market Outlook
    • Demand-side Trends
    • Supply-side Trends
    • Technology Roadmap Analysis
    • Analysis and Recommendations
  2. Market Overview
    • Market Coverage / Taxonomy
    • Market Definition / Scope / Limitations
  3. Market Background
    • Market Dynamics
      • Drivers
      • Restraints
      • Opportunity
      • Trends
    • Scenario Forecast
      • Demand in Optimistic Scenario
      • Demand in Likely Scenario
      • Demand in Conservative Scenario
    • Opportunity Map Analysis
    • Product Life Cycle Analysis
    • Supply Chain Analysis
      • Supply Side Participants and their Roles
        • Producers
        • Mid-Level Participants (Traders/ Agents/ Brokers)
        • Wholesalers and Distributors
      • Value Added and Value Created at Node in the Supply Chain
      • List of Raw Material Suppliers
      • List of Existing and Potential Buyer’s
    • Investment Feasibility Matrix
    • Value Chain Analysis
      • Profit Margin Analysis
      • Wholesalers and Distributors
      • Retailers
    • PESTLE and Porter’s Analysis
    • Regulatory Landscape
      • By Key Regions
      • By Key Countries
    • Regional Parent Market Outlook
    • Production and Consumption Statistics
    • Import and Export Statistics
  4. Global Market Analysis 2020 to 2024 and Forecast, 2025 to 2035
    • Historical Market Size Value (USD Million) & Volume (Units) Analysis, 2020 to 2024
    • Current and Future Market Size Value (USD Million) & Volume (Units) Projections, 2025 to 2035
      • Y-o-Y Growth Trend Analysis
      • Absolute $ Opportunity Analysis
  5. Global Market Analysis 2020 to 2024 and Forecast 2025 to 2035, By Source
    • Introduction / Key Findings
    • Historical Market Size Value (USD Million) & Volume (Units) Analysis By Source, 2020 to 2024
    • Current and Future Market Size Value (USD Million) & Volume (Units) Analysis and Forecast By Source, 2025 to 2035
      • Pomegranate oil
      • Grape seed oil
      • Acai oil
      • Berry oils
      • Citrus oils
    • Y-o-Y Growth Trend Analysis By Source, 2020 to 2024
    • Absolute $ Opportunity Analysis By Source, 2025 to 2035
  6. Global Market Analysis 2020 to 2024 and Forecast 2025 to 2035, By Application
    • Introduction / Key Findings
    • Historical Market Size Value (USD Million) & Volume (Units) Analysis By Application, 2020 to 2024
    • Current and Future Market Size Value (USD Million) & Volume (Units) Analysis and Forecast By Application, 2025 to 2035
      • Anti-aging
      • Brightening
      • Hydration
      • Repair
    • Y-o-Y Growth Trend Analysis By Application, 2020 to 2024
    • Absolute $ Opportunity Analysis By Application, 2025 to 2035
  7. Global Market Analysis 2020 to 2024 and Forecast 2025 to 2035, By Product Type
    • Introduction / Key Findings
    • Historical Market Size Value (USD Million) & Volume (Units) Analysis By Product Type, 2020 to 2024
    • Current and Future Market Size Value (USD Million) & Volume (Units) Analysis and Forecast By Product Type, 2025 to 2035
      • Serums
      • Creams/lotions
      • Hair oils
      • Capsules
    • Y-o-Y Growth Trend Analysis By Product Type, 2020 to 2024
    • Absolute $ Opportunity Analysis By Product Type, 2025 to 2035
  8. Global Market Analysis 2020 to 2024 and Forecast 2025 to 2035, By Channel
    • Introduction / Key Findings
    • Historical Market Size Value (USD Million) & Volume (Units) Analysis By Channel, 2020 to 2024
    • Current and Future Market Size Value (USD Million) & Volume (Units) Analysis and Forecast By Channel, 2025 to 2035
      • E-commerce
      • Specialty retail
      • Natural beauty stores
      • Pharmacies
    • Y-o-Y Growth Trend Analysis By Channel, 2020 to 2024
    • Absolute $ Opportunity Analysis By Channel, 2025 to 2035
  9. Global Market Analysis 2020 to 2024 and Forecast 2025 to 2035, By Region
    • Introduction
    • Historical Market Size Value (USD Million) & Volume (Units) Analysis By Region, 2020 to 2024
    • Current Market Size Value (USD Million) & Volume (Units) Analysis and Forecast By Region, 2025 to 2035
      • North America
      • Latin America
      • Europe
      • East Asia
      • South Asia & Pacific
      • Middle East and Africa
    • Market Attractiveness Analysis By Region
  10. North America Market Analysis 2020 to 2024 and Forecast 2025 to 2035, By Country
    • Historical Market Size Value (USD Million) & Volume (Units) Trend Analysis By Market Taxonomy, 2020 to 2024
    • Market Size Value (USD Million) & Volume (Units) Forecast By Market Taxonomy, 2025 to 2035
      • By Country
        • USA
        • Canada
      • By Source
      • By Application
      • By Product Type
      • By Channel
    • Market Attractiveness Analysis
      • By Country
      • By Source
      • By Application
      • By Product Type
      • By Channel
    • Key Takeaways
  11. Latin America Market Analysis 2020 to 2024 and Forecast 2025 to 2035, By Country
    • Historical Market Size Value (USD Million) & Volume (Units) Trend Analysis By Market Taxonomy, 2020 to 2024
    • Market Size Value (USD Million) & Volume (Units) Forecast By Market Taxonomy, 2025 to 2035
      • By Country
        • Brazil
        • Mexico
        • Colombia
        • Rest of Latin America
      • By Source
      • By Application
      • By Product Type
      • By Channel
    • Market Attractiveness Analysis
      • By Country
      • By Source
      • By Application
      • By Product Type
      • By Channel
    • Key Takeaways
  12. Europe Market Analysis 2020 to 2024 and Forecast 2025 to 2035, By Country
    • Historical Market Size Value (USD Million) & Volume (Units) Trend Analysis By Market Taxonomy, 2020 to 2024
    • Market Size Value (USD Million) & Volume (Units) Forecast By Market Taxonomy, 2025 to 2035
      • By Country
        • Germany
        • UK
        • France
        • Italy
        • Spain
        • Belgium
        • Netherlands
        • Nordic
        • Switzerland
        • Russia
        • Poland
        • Rest of Europe
      • By Source
      • By Application
      • By Product Type
      • By Channel
    • Market Attractiveness Analysis
      • By Country
      • By Source
      • By Application
      • By Product Type
      • By Channel
    • Key Takeaways
  13. East Asia Market Analysis 2020 to 2024 and Forecast 2025 to 2035, By Country
    • Historical Market Size Value (USD Million) & Volume (Units) Trend Analysis By Market Taxonomy, 2020 to 2024
    • Market Size Value (USD Million) & Volume (Units) Forecast By Market Taxonomy, 2025 to 2035
      • By Country
        • China
        • Japan
        • South Korea
      • By Source
      • By Application
      • By Product Type
      • By Channel
    • Market Attractiveness Analysis
      • By Country
      • By Source
      • By Application
      • By Product Type
      • By Channel
    • Key Takeaways
  14. South Asia & Pacific Market Analysis 2020 to 2024 and Forecast 2025 to 2035, By Country
    • Historical Market Size Value (USD Million) & Volume (Units) Trend Analysis By Market Taxonomy, 2020 to 2024
    • Market Size Value (USD Million) & Volume (Units) Forecast By Market Taxonomy, 2025 to 2035
      • By Country
        • India
        • Thailand
        • Malaysia
        • Indonesia
        • Singapore
        • Vietnam
        • Australia
        • New Zealand
        • Rest of South Asia
      • By Source
      • By Application
      • By Product Type
      • By Channel
    • Market Attractiveness Analysis
      • By Country
      • By Source
      • By Application
      • By Product Type
      • By Channel
    • Key Takeaways
  15. Middle East and Africa Market Analysis 2020 to 2024 and Forecast 2025 to 2035, By Country
    • Historical Market Size Value (USD Million) & Volume (Units) Trend Analysis By Market Taxonomy, 2020 to 2024
    • Market Size Value (USD Million) & Volume (Units) Forecast By Market Taxonomy, 2025 to 2035
      • By Country
        • Turkey
        • UAE
        • Saudi Arabia
        • Israel
        • Other GCC Countries
        • North Africa
        • South Africa
      • By Source
      • By Application
      • By Product Type
      • By Channel
    • Market Attractiveness Analysis
      • By Country
      • By Source
      • By Application
      • By Product Type
      • By Channel
    • Key Takeaways
  16. Key Countries Market Analysis
    • USA
      • Pricing Analysis
      • Market Share Analysis, 2024
        • By Source
        • By Application
        • By Product Type
        • By Channel
    • Canada
      • Pricing Analysis
      • Market Share Analysis, 2024
        • By Source
        • By Application
        • By Product Type
        • By Channel
    • Brazil
      • Pricing Analysis
      • Market Share Analysis, 2024
        • By Source
        • By Application
        • By Product Type
        • By Channel
    • Mexico
      • Pricing Analysis
      • Market Share Analysis, 2024
        • By Source
        • By Application
        • By Product Type
        • By Channel
    • Colombia
      • Pricing Analysis
      • Market Share Analysis, 2024
        • By Source
        • By Application
        • By Product Type
        • By Channel
    • Germany
      • Pricing Analysis
      • Market Share Analysis, 2024
        • By Source
        • By Application
        • By Product Type
        • By Channel
    • UK
      • Pricing Analysis
      • Market Share Analysis, 2024
        • By Source
        • By Application
        • By Product Type
        • By Channel
    • France
      • Pricing Analysis
      • Market Share Analysis, 2024
        • By Source
        • By Application
        • By Product Type
        • By Channel
    • Italy
      • Pricing Analysis
      • Market Share Analysis, 2024
        • By Source
        • By Application
        • By Product Type
        • By Channel
    • Spain
      • Pricing Analysis
      • Market Share Analysis, 2024
        • By Source
        • By Application
        • By Product Type
        • By Channel
    • Belgium
      • Pricing Analysis
      • Market Share Analysis, 2024
        • By Source
        • By Application
        • By Product Type
        • By Channel
    • Netherlands
      • Pricing Analysis
      • Market Share Analysis, 2024
        • By Source
        • By Application
        • By Product Type
        • By Channel
    • Nordic
      • Pricing Analysis
      • Market Share Analysis, 2024
        • By Source
        • By Application
        • By Product Type
        • By Channel
    • Switzerland
      • Pricing Analysis
      • Market Share Analysis, 2024
        • By Source
        • By Application
        • By Product Type
        • By Channel
    • Russia
      • Pricing Analysis
      • Market Share Analysis, 2024
        • By Source
        • By Application
        • By Product Type
        • By Channel
    • Poland
      • Pricing Analysis
      • Market Share Analysis, 2024
        • By Source
        • By Application
        • By Product Type
        • By Channel
    • China
      • Pricing Analysis
      • Market Share Analysis, 2024
        • By Source
        • By Application
        • By Product Type
        • By Channel
    • Japan
      • Pricing Analysis
      • Market Share Analysis, 2024
        • By Source
        • By Application
        • By Product Type
        • By Channel
    • South Korea
      • Pricing Analysis
      • Market Share Analysis, 2024
        • By Source
        • By Application
        • By Product Type
        • By Channel
    • India
      • Pricing Analysis
      • Market Share Analysis, 2024
        • By Source
        • By Application
        • By Product Type
        • By Channel
    • Thailand
      • Pricing Analysis
      • Market Share Analysis, 2024
        • By Source
        • By Application
        • By Product Type
        • By Channel
    • Indonesia
      • Pricing Analysis
      • Market Share Analysis, 2024
        • By Source
        • By Application
        • By Product Type
        • By Channel
    • Australia
      • Pricing Analysis
      • Market Share Analysis, 2024
        • By Source
        • By Application
        • By Product Type
        • By Channel
    • New Zealand
      • Pricing Analysis
      • Market Share Analysis, 2024
        • By Source
        • By Application
        • By Product Type
        • By Channel
    • Turkey
      • Pricing Analysis
      • Market Share Analysis, 2024
        • By Source
        • By Application
        • By Product Type
        • By Channel
    • UAE
      • Pricing Analysis
      • Market Share Analysis, 2024
        • By Source
        • By Application
        • By Product Type
        • By Channel
    • Saudi Arabia
      • Pricing Analysis
      • Market Share Analysis, 2024
        • By Source
        • By Application
        • By Product Type
        • By Channel
    • Israel
      • Pricing Analysis
      • Market Share Analysis, 2024
        • By Source
        • By Application
        • By Product Type
        • By Channel
    • North Africa
      • Pricing Analysis
      • Market Share Analysis, 2024
        • By Source
        • By Application
        • By Product Type
        • By Channel
    • South Africa
      • Pricing Analysis
      • Market Share Analysis, 2024
        • By Source
        • By Application
        • By Product Type
        • By Channel
  17. Market Structure Analysis
    • Competition Dashboard
    • Competition Benchmarking
    • Market Share Analysis of Top Players
      • By Regional
      • By Source
      • By Application
      • By Product Type
      • By Channel
  18. Competition Analysis
    • Competition Deep Dive
      • Aromtech
        • Overview
        • Product Portfolio
        • Profitability by Market Segments (Product/Age /Sales Channel/Region)
        • Sales Footprint
        • Strategy Overview
          • Marketing Strategy
          • Product Strategy
          • Channel Strategy
      • BASF
        • Overview
        • Product Portfolio
        • Profitability by Market Segments (Product/Age /Sales Channel/Region)
        • Sales Footprint
        • Strategy Overview
          • Marketing Strategy
          • Product Strategy
          • Channel Strategy
      • Croda
        • Overview
        • Product Portfolio
        • Profitability by Market Segments (Product/Age /Sales Channel/Region)
        • Sales Footprint
        • Strategy Overview
          • Marketing Strategy
          • Product Strategy
          • Channel Strategy
      • DSM-Firmenich
        • Overview
        • Product Portfolio
        • Profitability by Market Segments (Product/Age /Sales Channel/Region)
        • Sales Footprint
        • Strategy Overview
          • Marketing Strategy
          • Product Strategy
          • Channel Strategy
      • Givaudan
        • Overview
        • Product Portfolio
        • Profitability by Market Segments (Product/Age /Sales Channel/Region)
        • Sales Footprint
        • Strategy Overview
          • Marketing Strategy
          • Product Strategy
          • Channel Strategy
      • Ashland
        • Overview
        • Product Portfolio
        • Profitability by Market Segments (Product/Age /Sales Channel/Region)
        • Sales Footprint
        • Strategy Overview
          • Marketing Strategy
          • Product Strategy
          • Channel Strategy
      • Sabinsa
        • Overview
        • Product Portfolio
        • Profitability by Market Segments (Product/Age /Sales Channel/Region)
        • Sales Footprint
        • Strategy Overview
          • Marketing Strategy
          • Product Strategy
          • Channel Strategy
      • Aldivia
        • Overview
        • Product Portfolio
        • Profitability by Market Segments (Product/Age /Sales Channel/Region)
        • Sales Footprint
        • Strategy Overview
          • Marketing Strategy
          • Product Strategy
          • Channel Strategy
      • Organic Harvest
        • Overview
        • Product Portfolio
        • Profitability by Market Segments (Product/Age /Sales Channel/Region)
        • Sales Footprint
        • Strategy Overview
          • Marketing Strategy
          • Product Strategy
          • Channel Strategy
      • Eminence
        • Overview
        • Product Portfolio
        • Profitability by Market Segments (Product/Age /Sales Channel/Region)
        • Sales Footprint
        • Strategy Overview
          • Marketing Strategy
          • Product Strategy
          • Channel Strategy
      • Others
        • Overview
        • Product Portfolio
        • Profitability by Market Segments (Product/Age /Sales Channel/Region)
        • Sales Footprint
        • Strategy Overview
          • Marketing Strategy
          • Product Strategy
          • Channel Strategy
  19. Assumptions & Acronyms Used
  20. Research Methodology

List of Tables

  • Table 1: Global Market Value (USD Million) Forecast by Region, 2020-2035
  • Table 2: Global Market Volume (Units) Forecast by Region, 2020-2035
  • Table 3: Global Market Value (USD Million) Forecast by Source, 2020-2035
  • Table 4: Global Market Volume (Units) Forecast by Source, 2020-2035
  • Table 5: Global Market Value (USD Million) Forecast by Application, 2020-2035
  • Table 6: Global Market Volume (Units) Forecast by Application, 2020-2035
  • Table 7: Global Market Value (USD Million) Forecast by Product Type, 2020-2035
  • Table 8: Global Market Volume (Units) Forecast by Product Type, 2020-2035
  • Table 9: Global Market Value (USD Million) Forecast by Channel, 2020-2035
  • Table 10: Global Market Volume (Units) Forecast by Channel, 2020-2035
  • Table 11: North America Market Value (USD Million) Forecast by Country, 2020-2035
  • Table 12: North America Market Volume (Units) Forecast by Country, 2020-2035
  • Table 13: North America Market Value (USD Million) Forecast by Source, 2020-2035
  • Table 14: North America Market Volume (Units) Forecast by Source, 2020-2035
  • Table 15: North America Market Value (USD Million) Forecast by Application, 2020-2035
  • Table 16: North America Market Volume (Units) Forecast by Application, 2020-2035
  • Table 17: North America Market Value (USD Million) Forecast by Product Type, 2020-2035
  • Table 18: North America Market Volume (Units) Forecast by Product Type, 2020-2035
  • Table 19: North America Market Value (USD Million) Forecast by Channel, 2020-2035
  • Table 20: North America Market Volume (Units) Forecast by Channel, 2020-2035
  • Table 21: Latin America Market Value (USD Million) Forecast by Country, 2020-2035
  • Table 22: Latin America Market Volume (Units) Forecast by Country, 2020-2035
  • Table 23: Latin America Market Value (USD Million) Forecast by Source, 2020-2035
  • Table 24: Latin America Market Volume (Units) Forecast by Source, 2020-2035
  • Table 25: Latin America Market Value (USD Million) Forecast by Application, 2020-2035
  • Table 26: Latin America Market Volume (Units) Forecast by Application, 2020-2035
  • Table 27: Latin America Market Value (USD Million) Forecast by Product Type, 2020-2035
  • Table 28: Latin America Market Volume (Units) Forecast by Product Type, 2020-2035
  • Table 29: Latin America Market Value (USD Million) Forecast by Channel, 2020-2035
  • Table 30: Latin America Market Volume (Units) Forecast by Channel, 2020-2035
  • Table 31: Europe Market Value (USD Million) Forecast by Country, 2020-2035
  • Table 32: Europe Market Volume (Units) Forecast by Country, 2020-2035
  • Table 33: Europe Market Value (USD Million) Forecast by Source, 2020-2035
  • Table 34: Europe Market Volume (Units) Forecast by Source, 2020-2035
  • Table 35: Europe Market Value (USD Million) Forecast by Application, 2020-2035
  • Table 36: Europe Market Volume (Units) Forecast by Application, 2020-2035
  • Table 37: Europe Market Value (USD Million) Forecast by Product Type, 2020-2035
  • Table 38: Europe Market Volume (Units) Forecast by Product Type, 2020-2035
  • Table 39: Europe Market Value (USD Million) Forecast by Channel, 2020-2035
  • Table 40: Europe Market Volume (Units) Forecast by Channel, 2020-2035
  • Table 41: East Asia Market Value (USD Million) Forecast by Country, 2020-2035
  • Table 42: East Asia Market Volume (Units) Forecast by Country, 2020-2035
  • Table 43: East Asia Market Value (USD Million) Forecast by Source, 2020-2035
  • Table 44: East Asia Market Volume (Units) Forecast by Source, 2020-2035
  • Table 45: East Asia Market Value (USD Million) Forecast by Application, 2020-2035
  • Table 46: East Asia Market Volume (Units) Forecast by Application, 2020-2035
  • Table 47: East Asia Market Value (USD Million) Forecast by Product Type, 2020-2035
  • Table 48: East Asia Market Volume (Units) Forecast by Product Type, 2020-2035
  • Table 49: East Asia Market Value (USD Million) Forecast by Channel, 2020-2035
  • Table 50: East Asia Market Volume (Units) Forecast by Channel, 2020-2035
  • Table 51: South Asia & Pacific Market Value (USD Million) Forecast by Country, 2020-2035
  • Table 52: South Asia & Pacific Market Volume (Units) Forecast by Country, 2020-2035
  • Table 53: South Asia & Pacific Market Value (USD Million) Forecast by Source, 2020-2035
  • Table 54: South Asia & Pacific Market Volume (Units) Forecast by Source, 2020-2035
  • Table 55: South Asia & Pacific Market Value (USD Million) Forecast by Application, 2020-2035
  • Table 56: South Asia & Pacific Market Volume (Units) Forecast by Application, 2020-2035
  • Table 57: South Asia & Pacific Market Value (USD Million) Forecast by Product Type, 2020-2035
  • Table 58: South Asia & Pacific Market Volume (Units) Forecast by Product Type, 2020-2035
  • Table 59: South Asia & Pacific Market Value (USD Million) Forecast by Channel, 2020-2035
  • Table 60: South Asia & Pacific Market Volume (Units) Forecast by Channel, 2020-2035
  • Table 61: Middle East and Africa Market Value (USD Million) Forecast by Country, 2020-2035
  • Table 62: Middle East and Africa Market Volume (Units) Forecast by Country, 2020-2035
  • Table 63: Middle East and Africa Market Value (USD Million) Forecast by Source, 2020-2035
  • Table 64: Middle East and Africa Market Volume (Units) Forecast by Source, 2020-2035
  • Table 65: Middle East and Africa Market Value (USD Million) Forecast by Application, 2020-2035
  • Table 66: Middle East and Africa Market Volume (Units) Forecast by Application, 2020-2035
  • Table 67: Middle East and Africa Market Value (USD Million) Forecast by Product Type, 2020-2035
  • Table 68: Middle East and Africa Market Volume (Units) Forecast by Product Type, 2020-2035
  • Table 69: Middle East and Africa Market Value (USD Million) Forecast by Channel, 2020-2035
  • Table 70: Middle East and Africa Market Volume (Units) Forecast by Channel, 2020-2035

List of Figures

  • Figure 1: Global Market Value (USD Million) by Source, 2025-2035
  • Figure 2: Global Market Value (USD Million) by Application, 2025-2035
  • Figure 3: Global Market Value (USD Million) by Product Type, 2025-2035
  • Figure 4: Global Market Value (USD Million) by Channel, 2025-2035
  • Figure 5: Global Market Value (USD Million) by Region, 2025-2035
  • Figure 6: Global Market Value (USD Million) Analysis by Region, 2020-2035
  • Figure 7: Global Market Volume (Units) Analysis by Region, 2020-2035
  • Figure 8: Global Market Value Share (%) and BPS Analysis by Region, 2025-2035
  • Figure 9: Global Market Y-o-Y Growth (%) Projections by Region, 2025-2035
  • Figure 10: Global Market Value (USD Million) Analysis by Source, 2020-2035
  • Figure 11: Global Market Volume (Units) Analysis by Source, 2020-2035
  • Figure 12: Global Market Value Share (%) and BPS Analysis by Source, 2025-2035
  • Figure 13: Global Market Y-o-Y Growth (%) Projections by Source, 2025-2035
  • Figure 14: Global Market Value (USD Million) Analysis by Application, 2020-2035
  • Figure 15: Global Market Volume (Units) Analysis by Application, 2020-2035
  • Figure 16: Global Market Value Share (%) and BPS Analysis by Application, 2025-2035
  • Figure 17: Global Market Y-o-Y Growth (%) Projections by Application, 2025-2035
  • Figure 18: Global Market Value (USD Million) Analysis by Product Type, 2020-2035
  • Figure 19: Global Market Volume (Units) Analysis by Product Type, 2020-2035
  • Figure 20: Global Market Value Share (%) and BPS Analysis by Product Type, 2025-2035
  • Figure 21: Global Market Y-o-Y Growth (%) Projections by Product Type, 2025-2035
  • Figure 22: Global Market Value (USD Million) Analysis by Channel, 2020-2035
  • Figure 23: Global Market Volume (Units) Analysis by Channel, 2020-2035
  • Figure 24: Global Market Value Share (%) and BPS Analysis by Channel, 2025-2035
  • Figure 25: Global Market Y-o-Y Growth (%) Projections by Channel, 2025-2035
  • Figure 26: Global Market Attractiveness by Source, 2025-2035
  • Figure 27: Global Market Attractiveness by Application, 2025-2035
  • Figure 28: Global Market Attractiveness by Product Type, 2025-2035
  • Figure 29: Global Market Attractiveness by Channel, 2025-2035
  • Figure 30: Global Market Attractiveness by Region, 2025-2035
  • Figure 31: North America Market Value (USD Million) by Source, 2025-2035
  • Figure 32: North America Market Value (USD Million) by Application, 2025-2035
  • Figure 33: North America Market Value (USD Million) by Product Type, 2025-2035
  • Figure 34: North America Market Value (USD Million) by Channel, 2025-2035
  • Figure 35: North America Market Value (USD Million) by Country, 2025-2035
  • Figure 36: North America Market Value (USD Million) Analysis by Country, 2020-2035
  • Figure 37: North America Market Volume (Units) Analysis by Country, 2020-2035
  • Figure 38: North America Market Value Share (%) and BPS Analysis by Country, 2025-2035
  • Figure 39: North America Market Y-o-Y Growth (%) Projections by Country, 2025-2035
  • Figure 40: North America Market Value (USD Million) Analysis by Source, 2020-2035
  • Figure 41: North America Market Volume (Units) Analysis by Source, 2020-2035
  • Figure 42: North America Market Value Share (%) and BPS Analysis by Source, 2025-2035
  • Figure 43: North America Market Y-o-Y Growth (%) Projections by Source, 2025-2035
  • Figure 44: North America Market Value (USD Million) Analysis by Application, 2020-2035
  • Figure 45: North America Market Volume (Units) Analysis by Application, 2020-2035
  • Figure 46: North America Market Value Share (%) and BPS Analysis by Application, 2025-2035
  • Figure 47: North America Market Y-o-Y Growth (%) Projections by Application, 2025-2035
  • Figure 48: North America Market Value (USD Million) Analysis by Product Type, 2020-2035
  • Figure 49: North America Market Volume (Units) Analysis by Product Type, 2020-2035
  • Figure 50: North America Market Value Share (%) and BPS Analysis by Product Type, 2025-2035
  • Figure 51: North America Market Y-o-Y Growth (%) Projections by Product Type, 2025-2035
  • Figure 52: North America Market Value (USD Million) Analysis by Channel, 2020-2035
  • Figure 53: North America Market Volume (Units) Analysis by Channel, 2020-2035
  • Figure 54: North America Market Value Share (%) and BPS Analysis by Channel, 2025-2035
  • Figure 55: North America Market Y-o-Y Growth (%) Projections by Channel, 2025-2035
  • Figure 56: North America Market Attractiveness by Source, 2025-2035
  • Figure 57: North America Market Attractiveness by Application, 2025-2035
  • Figure 58: North America Market Attractiveness by Product Type, 2025-2035
  • Figure 59: North America Market Attractiveness by Channel, 2025-2035
  • Figure 60: North America Market Attractiveness by Country, 2025-2035
  • Figure 61: Latin America Market Value (USD Million) by Source, 2025-2035
  • Figure 62: Latin America Market Value (USD Million) by Application, 2025-2035
  • Figure 63: Latin America Market Value (USD Million) by Product Type, 2025-2035
  • Figure 64: Latin America Market Value (USD Million) by Channel, 2025-2035
  • Figure 65: Latin America Market Value (USD Million) by Country, 2025-2035
  • Figure 66: Latin America Market Value (USD Million) Analysis by Country, 2020-2035
  • Figure 67: Latin America Market Volume (Units) Analysis by Country, 2020-2035
  • Figure 68: Latin America Market Value Share (%) and BPS Analysis by Country, 2025-2035
  • Figure 69: Latin America Market Y-o-Y Growth (%) Projections by Country, 2025-2035
  • Figure 70: Latin America Market Value (USD Million) Analysis by Source, 2020-2035
  • Figure 71: Latin America Market Volume (Units) Analysis by Source, 2020-2035
  • Figure 72: Latin America Market Value Share (%) and BPS Analysis by Source, 2025-2035
  • Figure 73: Latin America Market Y-o-Y Growth (%) Projections by Source, 2025-2035
  • Figure 74: Latin America Market Value (USD Million) Analysis by Application, 2020-2035
  • Figure 75: Latin America Market Volume (Units) Analysis by Application, 2020-2035
  • Figure 76: Latin America Market Value Share (%) and BPS Analysis by Application, 2025-2035
  • Figure 77: Latin America Market Y-o-Y Growth (%) Projections by Application, 2025-2035
  • Figure 78: Latin America Market Value (USD Million) Analysis by Product Type, 2020-2035
  • Figure 79: Latin America Market Volume (Units) Analysis by Product Type, 2020-2035
  • Figure 80: Latin America Market Value Share (%) and BPS Analysis by Product Type, 2025-2035
  • Figure 81: Latin America Market Y-o-Y Growth (%) Projections by Product Type, 2025-2035
  • Figure 82: Latin America Market Value (USD Million) Analysis by Channel, 2020-2035
  • Figure 83: Latin America Market Volume (Units) Analysis by Channel, 2020-2035
  • Figure 84: Latin America Market Value Share (%) and BPS Analysis by Channel, 2025-2035
  • Figure 85: Latin America Market Y-o-Y Growth (%) Projections by Channel, 2025-2035
  • Figure 86: Latin America Market Attractiveness by Source, 2025-2035
  • Figure 87: Latin America Market Attractiveness by Application, 2025-2035
  • Figure 88: Latin America Market Attractiveness by Product Type, 2025-2035
  • Figure 89: Latin America Market Attractiveness by Channel, 2025-2035
  • Figure 90: Latin America Market Attractiveness by Country, 2025-2035
  • Figure 91: Europe Market Value (USD Million) by Source, 2025-2035
  • Figure 92: Europe Market Value (USD Million) by Application, 2025-2035
  • Figure 93: Europe Market Value (USD Million) by Product Type, 2025-2035
  • Figure 94: Europe Market Value (USD Million) by Channel, 2025-2035
  • Figure 95: Europe Market Value (USD Million) by Country, 2025-2035
  • Figure 96: Europe Market Value (USD Million) Analysis by Country, 2020-2035
  • Figure 97: Europe Market Volume (Units) Analysis by Country, 2020-2035
  • Figure 98: Europe Market Value Share (%) and BPS Analysis by Country, 2025-2035
  • Figure 99: Europe Market Y-o-Y Growth (%) Projections by Country, 2025-2035
  • Figure 100: Europe Market Value (USD Million) Analysis by Source, 2020-2035
  • Figure 101: Europe Market Volume (Units) Analysis by Source, 2020-2035
  • Figure 102: Europe Market Value Share (%) and BPS Analysis by Source, 2025-2035
  • Figure 103: Europe Market Y-o-Y Growth (%) Projections by Source, 2025-2035
  • Figure 104: Europe Market Value (USD Million) Analysis by Application, 2020-2035
  • Figure 105: Europe Market Volume (Units) Analysis by Application, 2020-2035
  • Figure 106: Europe Market Value Share (%) and BPS Analysis by Application, 2025-2035
  • Figure 107: Europe Market Y-o-Y Growth (%) Projections by Application, 2025-2035
  • Figure 108: Europe Market Value (USD Million) Analysis by Product Type, 2020-2035
  • Figure 109: Europe Market Volume (Units) Analysis by Product Type, 2020-2035
  • Figure 110: Europe Market Value Share (%) and BPS Analysis by Product Type, 2025-2035
  • Figure 111: Europe Market Y-o-Y Growth (%) Projections by Product Type, 2025-2035
  • Figure 112: Europe Market Value (USD Million) Analysis by Channel, 2020-2035
  • Figure 113: Europe Market Volume (Units) Analysis by Channel, 2020-2035
  • Figure 114: Europe Market Value Share (%) and BPS Analysis by Channel, 2025-2035
  • Figure 115: Europe Market Y-o-Y Growth (%) Projections by Channel, 2025-2035
  • Figure 116: Europe Market Attractiveness by Source, 2025-2035
  • Figure 117: Europe Market Attractiveness by Application, 2025-2035
  • Figure 118: Europe Market Attractiveness by Product Type, 2025-2035
  • Figure 119: Europe Market Attractiveness by Channel, 2025-2035
  • Figure 120: Europe Market Attractiveness by Country, 2025-2035
  • Figure 121: East Asia Market Value (USD Million) by Source, 2025-2035
  • Figure 122: East Asia Market Value (USD Million) by Application, 2025-2035
  • Figure 123: East Asia Market Value (USD Million) by Product Type, 2025-2035
  • Figure 124: East Asia Market Value (USD Million) by Channel, 2025-2035
  • Figure 125: East Asia Market Value (USD Million) by Country, 2025-2035
  • Figure 126: East Asia Market Value (USD Million) Analysis by Country, 2020-2035
  • Figure 127: East Asia Market Volume (Units) Analysis by Country, 2020-2035
  • Figure 128: East Asia Market Value Share (%) and BPS Analysis by Country, 2025-2035
  • Figure 129: East Asia Market Y-o-Y Growth (%) Projections by Country, 2025-2035
  • Figure 130: East Asia Market Value (USD Million) Analysis by Source, 2020-2035
  • Figure 131: East Asia Market Volume (Units) Analysis by Source, 2020-2035
  • Figure 132: East Asia Market Value Share (%) and BPS Analysis by Source, 2025-2035
  • Figure 133: East Asia Market Y-o-Y Growth (%) Projections by Source, 2025-2035
  • Figure 134: East Asia Market Value (USD Million) Analysis by Application, 2020-2035
  • Figure 135: East Asia Market Volume (Units) Analysis by Application, 2020-2035
  • Figure 136: East Asia Market Value Share (%) and BPS Analysis by Application, 2025-2035
  • Figure 137: East Asia Market Y-o-Y Growth (%) Projections by Application, 2025-2035
  • Figure 138: East Asia Market Value (USD Million) Analysis by Product Type, 2020-2035
  • Figure 139: East Asia Market Volume (Units) Analysis by Product Type, 2020-2035
  • Figure 140: East Asia Market Value Share (%) and BPS Analysis by Product Type, 2025-2035
  • Figure 141: East Asia Market Y-o-Y Growth (%) Projections by Product Type, 2025-2035
  • Figure 142: East Asia Market Value (USD Million) Analysis by Channel, 2020-2035
  • Figure 143: East Asia Market Volume (Units) Analysis by Channel, 2020-2035
  • Figure 144: East Asia Market Value Share (%) and BPS Analysis by Channel, 2025-2035
  • Figure 145: East Asia Market Y-o-Y Growth (%) Projections by Channel, 2025-2035
  • Figure 146: East Asia Market Attractiveness by Source, 2025-2035
  • Figure 147: East Asia Market Attractiveness by Application, 2025-2035
  • Figure 148: East Asia Market Attractiveness by Product Type, 2025-2035
  • Figure 149: East Asia Market Attractiveness by Channel, 2025-2035
  • Figure 150: East Asia Market Attractiveness by Country, 2025-2035
  • Figure 151: South Asia & Pacific Market Value (USD Million) by Source, 2025-2035
  • Figure 152: South Asia & Pacific Market Value (USD Million) by Application, 2025-2035
  • Figure 153: South Asia & Pacific Market Value (USD Million) by Product Type, 2025-2035
  • Figure 154: South Asia & Pacific Market Value (USD Million) by Channel, 2025-2035
  • Figure 155: South Asia & Pacific Market Value (USD Million) by Country, 2025-2035
  • Figure 156: South Asia & Pacific Market Value (USD Million) Analysis by Country, 2020-2035
  • Figure 157: South Asia & Pacific Market Volume (Units) Analysis by Country, 2020-2035
  • Figure 158: South Asia & Pacific Market Value Share (%) and BPS Analysis by Country, 2025-2035
  • Figure 159: South Asia & Pacific Market Y-o-Y Growth (%) Projections by Country, 2025-2035
  • Figure 160: South Asia & Pacific Market Value (USD Million) Analysis by Source, 2020-2035
  • Figure 161: South Asia & Pacific Market Volume (Units) Analysis by Source, 2020-2035
  • Figure 162: South Asia & Pacific Market Value Share (%) and BPS Analysis by Source, 2025-2035
  • Figure 163: South Asia & Pacific Market Y-o-Y Growth (%) Projections by Source, 2025-2035
  • Figure 164: South Asia & Pacific Market Value (USD Million) Analysis by Application, 2020-2035
  • Figure 165: South Asia & Pacific Market Volume (Units) Analysis by Application, 2020-2035
  • Figure 166: South Asia & Pacific Market Value Share (%) and BPS Analysis by Application, 2025-2035
  • Figure 167: South Asia & Pacific Market Y-o-Y Growth (%) Projections by Application, 2025-2035
  • Figure 168: South Asia & Pacific Market Value (USD Million) Analysis by Product Type, 2020-2035
  • Figure 169: South Asia & Pacific Market Volume (Units) Analysis by Product Type, 2020-2035
  • Figure 170: South Asia & Pacific Market Value Share (%) and BPS Analysis by Product Type, 2025-2035
  • Figure 171: South Asia & Pacific Market Y-o-Y Growth (%) Projections by Product Type, 2025-2035
  • Figure 172: South Asia & Pacific Market Value (USD Million) Analysis by Channel, 2020-2035
  • Figure 173: South Asia & Pacific Market Volume (Units) Analysis by Channel, 2020-2035
  • Figure 174: South Asia & Pacific Market Value Share (%) and BPS Analysis by Channel, 2025-2035
  • Figure 175: South Asia & Pacific Market Y-o-Y Growth (%) Projections by Channel, 2025-2035
  • Figure 176: South Asia & Pacific Market Attractiveness by Source, 2025-2035
  • Figure 177: South Asia & Pacific Market Attractiveness by Application, 2025-2035
  • Figure 178: South Asia & Pacific Market Attractiveness by Product Type, 2025-2035
  • Figure 179: South Asia & Pacific Market Attractiveness by Channel, 2025-2035
  • Figure 180: South Asia & Pacific Market Attractiveness by Country, 2025-2035
  • Figure 181: Middle East and Africa Market Value (USD Million) by Source, 2025-2035
  • Figure 182: Middle East and Africa Market Value (USD Million) by Application, 2025-2035
  • Figure 183: Middle East and Africa Market Value (USD Million) by Product Type, 2025-2035
  • Figure 184: Middle East and Africa Market Value (USD Million) by Channel, 2025-2035
  • Figure 185: Middle East and Africa Market Value (USD Million) by Country, 2025-2035
  • Figure 186: Middle East and Africa Market Value (USD Million) Analysis by Country, 2020-2035
  • Figure 187: Middle East and Africa Market Volume (Units) Analysis by Country, 2020-2035
  • Figure 188: Middle East and Africa Market Value Share (%) and BPS Analysis by Country, 2025-2035
  • Figure 189: Middle East and Africa Market Y-o-Y Growth (%) Projections by Country, 2025-2035
  • Figure 190: Middle East and Africa Market Value (USD Million) Analysis by Source, 2020-2035
  • Figure 191: Middle East and Africa Market Volume (Units) Analysis by Source, 2020-2035
  • Figure 192: Middle East and Africa Market Value Share (%) and BPS Analysis by Source, 2025-2035
  • Figure 193: Middle East and Africa Market Y-o-Y Growth (%) Projections by Source, 2025-2035
  • Figure 194: Middle East and Africa Market Value (USD Million) Analysis by Application, 2020-2035
  • Figure 195: Middle East and Africa Market Volume (Units) Analysis by Application, 2020-2035
  • Figure 196: Middle East and Africa Market Value Share (%) and BPS Analysis by Application, 2025-2035
  • Figure 197: Middle East and Africa Market Y-o-Y Growth (%) Projections by Application, 2025-2035
  • Figure 198: Middle East and Africa Market Value (USD Million) Analysis by Product Type, 2020-2035
  • Figure 199: Middle East and Africa Market Volume (Units) Analysis by Product Type, 2020-2035
  • Figure 200: Middle East and Africa Market Value Share (%) and BPS Analysis by Product Type, 2025-2035
  • Figure 201: Middle East and Africa Market Y-o-Y Growth (%) Projections by Product Type, 2025-2035
  • Figure 202: Middle East and Africa Market Value (USD Million) Analysis by Channel, 2020-2035
  • Figure 203: Middle East and Africa Market Volume (Units) Analysis by Channel, 2020-2035
  • Figure 204: Middle East and Africa Market Value Share (%) and BPS Analysis by Channel, 2025-2035
  • Figure 205: Middle East and Africa Market Y-o-Y Growth (%) Projections by Channel, 2025-2035
  • Figure 206: Middle East and Africa Market Attractiveness by Source, 2025-2035
  • Figure 207: Middle East and Africa Market Attractiveness by Application, 2025-2035
  • Figure 208: Middle East and Africa Market Attractiveness by Product Type, 2025-2035
  • Figure 209: Middle East and Africa Market Attractiveness by Channel, 2025-2035
  • Figure 210: Middle East and Africa Market Attractiveness by Country, 2025-2035

Frequently Asked Questions

How big is the Antioxidant-Rich Fruit Oils Market in 2025?

The global Antioxidant-Rich Fruit Oils Market is estimated to be valued at USD 2,130.2 million in 2025, fueled by demand for natural skincare oils, sustainable beauty formulations, and increased consumer preference for antioxidant-rich actives in cosmeceuticals.

What will be the size of the Antioxidant-Rich Fruit Oils Market in 2035?

The market size for the Antioxidant-Rich Fruit Oils Market is projected to reach USD 6,211.2 million by 2035. Expansion will be driven by rising clean beauty adoption, D2C brand innovation, and growing awareness about bioavailable, plant-based antioxidants.

How much will the Antioxidant-Rich Fruit Oils Market grow between 2025 and 2035?

The Antioxidant-Rich Fruit Oils Market is expected to grow at a CAGR of 11.3% during the forecast period, underpinned by advances in botanical extraction, clean label demand, and shifting preferences toward preventative, non-synthetic skin nutrition.

What are the key product types in the Antioxidant-Rich Fruit Oils Market?

The primary product types include serums, creams & lotions, nutraceutical capsules, and hair oils, with multifunctional claims like anti-aging, skin repair, UV protection, and hydration driving formulation trends across beauty and wellness segments.

Which source segment is expected to contribute significant share in the Antioxidant-Rich Fruit Oils Market in 2025?

Pomegranate oil and grape seed oil are expected to hold significant share in 2025, owing to their high polyphenol content, skin rejuvenation properties, and increasing usage in organic skincare, particularly in face oils and leave-on applications.

Explore Similar Insights

Future Market Insights

Antioxidant-Rich Fruit Oils Market

Chat With

MaRIA

Hi There, I am MaRIA, Your Market Research Intelligence Assistant. How may I help you?