Aqueous-based Metal Cleaner Market Outlook from 2024 to 2034

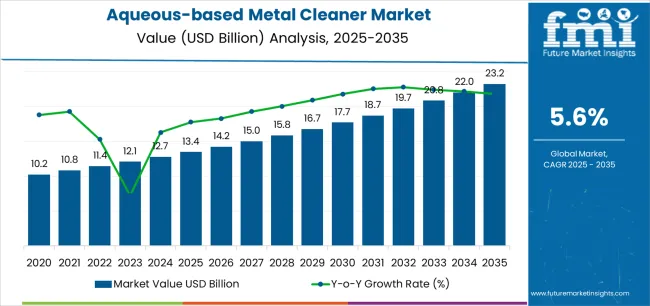
The aqueous-based metal cleaner market is estimated to be valued at US$ 12.70 billion in 2024. The demand for aqueous-based metal cleaners is projected to reach US$ 22.50 billion, exhibiting a CAGR of 5.9% through 2034.

Key Market Drivers

The aqueous-based metal cleaner market generated an estimated revenue of US$ 8.9 billion in 2019. In five years, the market grew at a 7.36% CAGR and added a staggering revenue of US$ 3.80 billion. Several reasons can be attributed to this growth:

  • Increasing adoption of aqueous-based metal cleaners in various industries due to their lower environmental impacts compared to traditional solvent-based cleaners.
  • The cost-efficiency of aqueous-based metal cleaners, coupled with their competitive performance, stimulates their demand in the market.
  • Ongoing research and development activities lead to innovations in aqueous-based formulations that enhance their effectiveness in metal cleaning applications.
  • The expanding metal fabrication industry due to infrastructure development and rising manufacturing needs in developing and underdeveloped countries drives market growth.
  • Supportive government initiatives promote the use of environmentally friendly and sustainable cleaning solutions.
  • The aerospace industry's stringent quality standards and the need for precision cleaning also drive the product demand.
  • The automotive industry's focus on sustainable practices and stringent quality standards fuel the adoption of aqueous-based metal cleaners in manufacturing and maintenance processes.
Attributes Key Statistics
Aqueous-based Metal Cleaner Market Value (2024) US$ 12.70 billion
Anticipated Market Value (2034) US$ 22.50 billion
Estimated Growth (2024 to 2034) 5.90% CAGR

Don't pay for what you don't need

Customize your report by selecting specific countries or regions and save 30%!

Consumption Analysis of the Aqueous-based Metal Cleaner Market

  • The automotive industry is increasingly adopting aqueous-based metal cleaners due to their effectiveness in meeting stringent cleanliness standards and the growing preference for eco-friendly products in manufacturing and maintenance processes.
  • The demand for aqueous-based cleaners is growing in the aerospace industry. The industry's emphasis on precision cleaning and the need for compliance with strict quality and safety standards is attributable to the rising product demand.
  • The electronics manufacturing sector is also contributing to the market as these cleaners provide effective cleaning without compromising the integrity of sensitive electronic components.
  • Power generation plants are opting for aqueous-based metal cleaners due to their ability to clean metal components used in power generation equipment efficiently.
  • The growing adoption of aqueous-based metal cleaners is also observed in the oil and gas industry, where they are used extensively for the cleaning and maintenance of crucial equipment such as pipelines, drilling components, and extraction machinery.
  • In the railway industry, there is a growing preference for aqueous-based metal cleaners for maintenance purposes for removing contaminants from metal surfaces in a safe and sustainable manner.

Restraining Factors Affecting the Aqueous-based Metal Cleaner Market

The market is anticipated to surpass a global valuation of US$ 22.50 billion by the year 2034, expanding at a 5.90% CAGR. While the market is expected to experience remarkable growth, several restraining factors could adversely affect its development:

  • Aqueous-based cleaners have limited applications in large-scale operations. This creates reluctance in the minds of business owners to opt for these solutions, hindering market growth.
  • The initial investment required for transitioning to aqueous-based cleaning systems, including equipment and infrastructure, is very costly. This becomes a major challenge for small companies with budget constraints away from the market.
  • There are still concerns about the efficacy of aqueous-based metal cleaners as compared to solvent-based cleaners. This negative perception also slows down the adoption of these cleaners in the manufacturing sector.
  • With the usage of aqueous-based metal cleaners, there are chances of corrosion, leading to concerns about their long-term impact on equipment integrity, potentially slowing down their adoption in critical applications.
Nikhil Kaitwade
Nikhil Kaitwade

Principal Consultant

Talk to Analyst

Find your sweet spots for generating winning opportunities in this market.

Category-wise Insights

Attributes Details
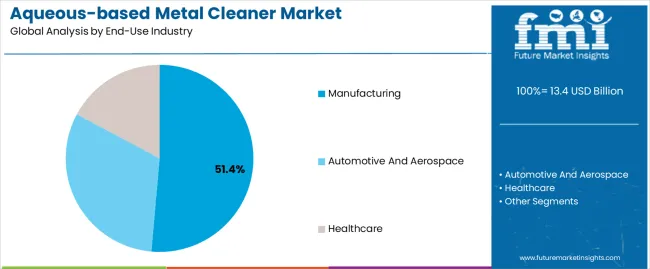
Top End-use Industry Manufacturing
CAGR (2024 to 2034) 5.70%

Aqueous-based Metal Cleaners find their Place in the Manufacturing Sector

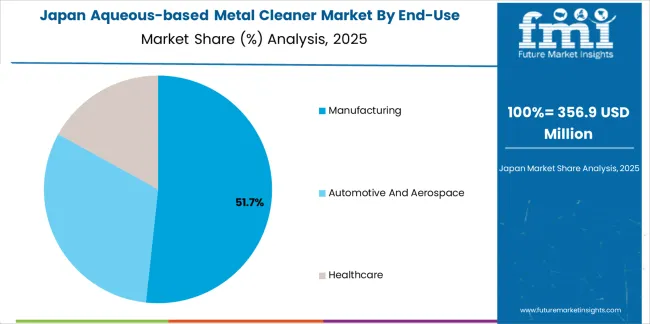
Depending on the end-users, the aqueous-based metal cleaner market is bifurcated into automotive and aerospace, manufacturing, and healthcare. The manufacturing segment is anticipated to grow at a 5.70% CAGR through 2034.

  • The demand for aqueous-based metal cleaners is touching the skies in the manufacturing sector as they are used in the production of high-performance and reliable machinery.
  • Factory units across the world are also adopting these cleaners due to their cost-effectiveness, efficiency in cleaning diverse metal surfaces, and alignment with sustainability goals.
  • Even in the electronics manufacturing industry, the demand for these cleaners is high, as they find their applications in cleaning electronic components and circuit boards.

Ultrasonic Metal Cleaners to Become the Next Phenomenon in the Industrial World

Attributes Details
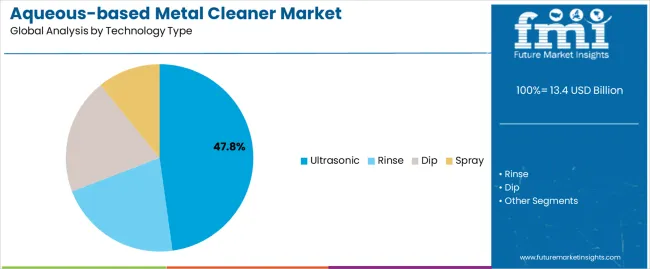
Top Technology Type Ultrasonic
CAGR (2024 to 2034) 5.50%

The aqueous-based metal cleaner market is categorized by technology type into ultrasonic, rinse, dip, and spray. The ultrasonic segment dominates the market and is anticipated to grow at a CAGR of 5.50% through 2034.

  • Ultrasonic metal cleaners are gaining dominance due to their high efficiency in removing contaminants through cavitation, making them ideal for intricate parts and complex geometries.
  • Factory units are also preferring ultrasonic metal cleaners due to their ability to reach and clean hard-to-reach areas. This makes them a perfect choice for manufacturers where precision cleaning of intricate components is crucial.

Country-wise Insights

The section provides an analysis of the aqueous-based metal cleaner market by country, including Japan, China, the United States, the United Kingdom, and South Korea. The table presents the CAGRs for each country, indicating the expected growth of the market in that country through 2034.

Countries CAGR (2024 to 2034)
South Korea 8.00%
Japan 7.40%
The United Kingdom 7.00%
China 6.50%
The United States 6.10%

Aqueous-based Metal Cleaner Market in South Korea

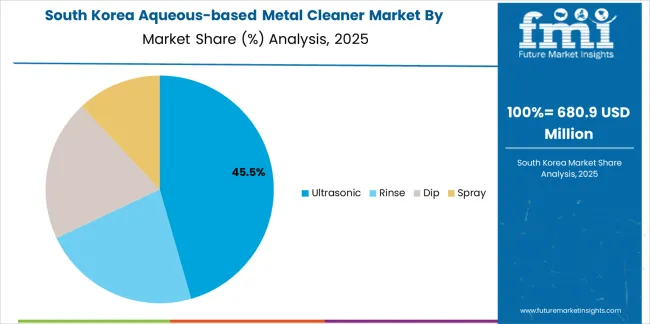
South Korea is one of the leading countries in this market. The South Korean market is anticipated to retain its dominance by progressing at an annual growth rate of 8.00% till 2034.

  • The automotive and electronics industries are expanding exponentially in South Korea. This is automatically pushing the demand for metal cleaners as they are used to eliminate contaminants from circuits and electronic components.
  • The country has always been at the forefront of technological advancements in the manufacturing sector, driving the adoption of advanced metal cleaning solutions to enhance manufacturing efficiency and the quality of finished goods.

Aqueous-based Metal Cleaner Market in Japan

Japan is another Asian country that leads the aqueous-based metal cleaner market. The Japanese market is anticipated to retain its dominance by progressing at an annual growth rate of 7.40% till 2034.

  • Japan's manufacturing sector, known for its high-precision processes, is one of the largest consumers of aqueous-based metal cleaners in the world. These entities use metal cleaners for meticulous cleaning of components.
  • Besides this, the Japanese industrial sector is also very keen on the environmental impact of their processes. Aqueous-based metal cleaners are relatively less harmful to the surroundings. This has made its adoption very crucial for eco-conscious businesses.

Aqueous-based Metal Cleaner Market in the United Kingdom

The United Kingdom dominates the market in the European region. The United Kingdom's aqueous-based metal cleaner market is anticipated to exhibit an annual growth rate of 7.00% through 2034.

  • The environmental regulations in the United Kingdom have significantly pushed companies and businesses in the region to transition from solvent-based to aqueous-based metal cleaners, as the latter is ecologically more supportive. This has expanded the market in the United Kingdom.
  • The United Kingdom is also blessed with a robust manufacturing and automotive sector. These sectors generate huge demand for aqueous-based metal cleaners as they are essential for ensuring the cleanliness and quality of manufactured components.

Aqueous-based Metal Cleaner Market in China

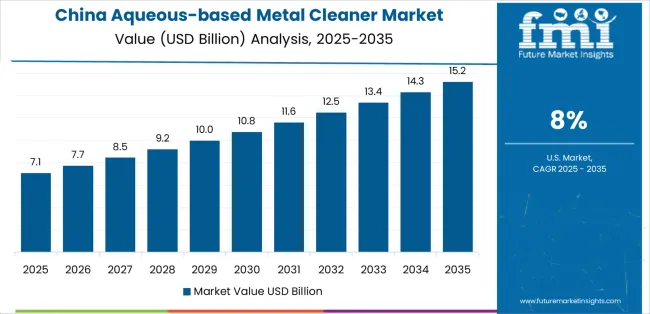
China, too, is one of the leading countries in the aqueous-based metal cleaner market, which is anticipated to register a CAGR of 6.50% through 2034.

  • Over the past few years, China has gone through a period of rapid industrialization. The same period also experienced massive growth in manufacturing activities, particularly in the automotive and electronics sectors. This has contributed to the demand for efficient metal cleaning solutions in the country.
  • Apart from this, government initiatives promoting green technologies and sustainable manufacturing practices also encourage the adoption of aqueous-based metal cleaners in the country.

Aqueous-based Metal Cleaner Market in the United States

The United States leads the market in the North American region. Over the next ten years, the demand for aqueous-based metal cleaners is projected to rise at a 6.10% CAGR.
  • Some of the major aviation companies, such as Boeing, Lockheed Martin Corporation, Airbus, etc., are present in the United States and they use metal cleaners for precision cleaning to ensure high-quality production.
  • Besides this, the United States regulatory environment emphasizes workplace safety, prompting industries to shift toward aqueous-based metal cleaners as safer alternatives to traditional solvents.

Get the data you need at a Fraction of the cost

Personalize your report by choosing insights you need
and save 40%!

Competitive Landscape

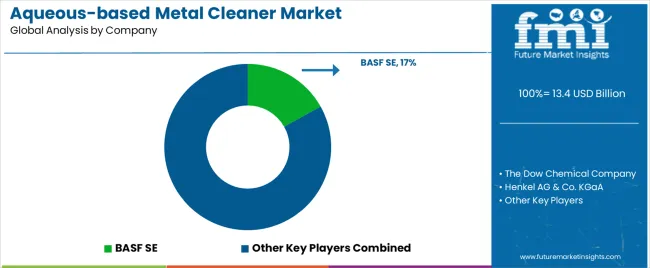
The market for aqueous-based metal cleaners is highly fragmented and is filled with numerous companies that not only cater to regional consumers but also international ones. BASF SE, The Dow Chemical Company, Henkel AG & Co., KGaA, 3M Company, PG Industries, Inc., Quaker Houghton, etc., are some of the most prominent companies that emphasize the development and promotion of environmentally sustainable cleaning solutions.

These companies are also expanding their consumer base by strategically marketing their products in underdeveloped and developing countries.

Recent Developments

  • In February 2022, Alconox supplied critical cleaning liquids and powders for precise sanitization in industries including pharmaceuticals. The high-quality biodegradable detergents used for cleaning equipment demonstrated consistent residue removal, meeting global healthcare and hospital cleaning standards.
  • Recently, NGL Aqueous processes demonstrated their efficacy in ultrasonic cleaning, emphasizing the critical role of substrate-specific detergent formulations. The water-based cleaning system, with advanced protective additives, safely and efficiently cleaned sensitive metal parts, ensuring superior quality and performance for coatings.

Key Companies in the Market

  • BASF SE
  • The Dow Chemical Company
  • Henkel AG & Co. KGaA
  • 3M Company
  • PPG Industries, Inc.
  • Quaker Houghton
  • Solvay S.A.
  • Stepan Company
  • Eastman Chemical Company
  • Diversey, Inc.
  • Chemetall (BASF Group)
  • Zep, Inc.
  • Croda International Plc
  • Nouryon
  • Clariant AG
  • W. R. Grace & Co.
  • Air Products and Chemicals, Inc.
  • Kao Corporation
  • Emerson Electric Co. (Branson Ultrasonics)
  • Evonik Industries AG

Key Segments

By End-Use Industry:

  • Manufacturing
  • Automotive and Aerospace
  • Healthcare

By Technology Type:

  • Ultrasonic
  • Rinse
  • Dip
  • Spray

By Region:

  • North America
  • Latin America
  • Asia Pacific
  • Middle East and Africa (MEA)
  • Europe

Frequently Asked Questions

How Big is the Aqueous-based Metal Cleaner Market in 2024?

The aqueous-based metal cleaner market is expected to be worth US$ 12.70 billion in 2024.

What is the Sales Forecast for Aqueous-based Metal Cleaners by 2034?

The market is expected to reach US$ 22.50 billion by 2034.

At What Rate is the Market Growing through 2034?

The market is growing at a CAGR of 5.90% from 2024 to 2034.

Who are the Key Manufacturing Companies in the Market?

Some of the key players in the market are BASF SE, The Dow Chemical Company, Henkel AG & Co., KGaA, 3M Company, PG Industries, Inc., Quaker Houghton, etc.

What was the Historical Valuation of the Market in 2023?

The valuation for the market was US$ 11.9 billion in 2023.

Table of Content
1. Executive Summary
    1.1. Global Market Outlook
    1.2. Demand-side Trends
    1.3. Supply-side Trends
    1.4. Technology Roadmap Analysis
    1.5. Analysis and Recommendations
2. Market Overview
    2.1. Market Coverage / Taxonomy
    2.2. Market Definition / Scope / Limitations
3. Market Background
    3.1. Market Dynamics
        3.1.1. Drivers
        3.1.2. Restraints
        3.1.3. Opportunity
        3.1.4. Trends
    3.2. Scenario Forecast
        3.2.1. Demand in Optimistic Scenario
        3.2.2. Demand in Likely Scenario
        3.2.3. Demand in Conservative Scenario
    3.3. Opportunity Map Analysis
    3.4. Product Life Cycle Analysis
    3.5. Supply Chain Analysis
        3.5.1. Supply Side Participants and their Roles
            3.5.1.1. Producers
            3.5.1.2. Mid-Level Participants (Traders/ Agents/ Brokers)
            3.5.1.3. Wholesalers and Distributors
        3.5.2. Value Added and Value Created at Node in the Supply Chain
        3.5.3. List of Raw Material Suppliers
        3.5.4. List of Existing and Potential Buyer’s
    3.6. Investment Feasibility Matrix
    3.7. Value Chain Analysis
        3.7.1. Profit Margin Analysis
        3.7.2. Wholesalers and Distributors
        3.7.3. Retailers
    3.8. PESTLE and Porter’s Analysis
    3.9. Regulatory Landscape
        3.9.1. By Key Regions
        3.9.2. By Key Countries
    3.10. Regional Parent Market Outlook
    3.11. Production and Consumption Statistics
    3.12. Import and Export Statistics
4. Global Market Analysis 2019 to 2023 and Forecast, 2024 to 2034
    4.1. Historical Market Size Value (US$ Million) & Volume (Tons) Analysis, 2019 to 2023
    4.2. Current and Future Market Size Value (US$ Million) & Volume (Tons) Projections, 2024 to 2034
        4.2.1. Y-o-Y Growth Trend Analysis
        4.2.2. Absolute $ Opportunity Analysis
5. Global Market Analysis 2019 to 2023 and Forecast 2024 to 2034, By Cleaning Chemicals
    5.1. Introduction / Key Findings
    5.2. Historical Market Size Value (US$ Million) & Volume (Tons) Analysis By Cleaning Chemicals, 2019 to 2023
    5.3. Current and Future Market Size Value (US$ Million) & Volume (Tons) Analysis and Forecast By Cleaning Chemicals, 2024 to 2034
        5.3.1. Builders
        5.3.2. Inhibitors
        5.3.3. Surfactants
    5.4. Y-o-Y Growth Trend Analysis By Cleaning Chemicals, 2019 to 2023
    5.5. Absolute $ Opportunity Analysis By Cleaning Chemicals, 2024 to 2034
6. Global Market Analysis 2019 to 2023 and Forecast 2024 to 2034, By End Use Industries
    6.1. Introduction / Key Findings
    6.2. Historical Market Size Value (US$ Million) & Volume (Tons) Analysis By End Use Industries, 2019 to 2023
    6.3. Current and Future Market Size Value (US$ Million) & Volume (Tons) Analysis and Forecast By End Use Industries, 2024 to 2034
        6.3.1. Manufacturing
        6.3.2. Automotive & Aerospace
        6.3.3. Healthcare
    6.4. Y-o-Y Growth Trend Analysis By End Use Industries, 2019 to 2023
    6.5. Absolute $ Opportunity Analysis By End Use Industries, 2024 to 2034
7. Global Market Analysis 2019 to 2023 and Forecast 2024 to 2034, By Chemistry Type
    7.1. Introduction / Key Findings
    7.2. Historical Market Size Value (US$ Million) & Volume (Tons) Analysis By Chemistry Type, 2019 to 2023
    7.3. Current and Future Market Size Value (US$ Million) & Volume (Tons) Analysis and Forecast By Chemistry Type, 2024 to 2034
        7.3.1. Alkaline
        7.3.2. Acidic
        7.3.3. Neutral
    7.4. Y-o-Y Growth Trend Analysis By Chemistry Type, 2019 to 2023
    7.5. Absolute $ Opportunity Analysis By Chemistry Type, 2024 to 2034
8. Global Market Analysis 2019 to 2023 and Forecast 2024 to 2034, By Technology
    8.1. Introduction / Key Findings
    8.2. Historical Market Size Value (US$ Million) & Volume (Tons) Analysis By Technology, 2019 to 2023
    8.3. Current and Future Market Size Value (US$ Million) & Volume (Tons) Analysis and Forecast By Technology, 2024 to 2034
        8.3.1. Ultrasonic
        8.3.2. Rinse
        8.3.3. Dip
        8.3.4. Spray
    8.4. Y-o-Y Growth Trend Analysis By Technology, 2019 to 2023
    8.5. Absolute $ Opportunity Analysis By Technology, 2024 to 2034
9. Global Market Analysis 2019 to 2023 and Forecast 2024 to 2034, By Region
    9.1. Introduction
    9.2. Historical Market Size Value (US$ Million) & Volume (Tons) Analysis By Region, 2019 to 2023
    9.3. Current Market Size Value (US$ Million) & Volume (Tons) Analysis and Forecast By Region, 2024 to 2034
        9.3.1. North America
        9.3.2. Latin America
        9.3.3. Western Europe
        9.3.4. Eastern Europe
        9.3.5. South Asia and Pacific
        9.3.6. East Asia
        9.3.7. Middle East and Africa
    9.4. Market Attractiveness Analysis By Region
10. North America Market Analysis 2019 to 2023 and Forecast 2024 to 2034, By Country
    10.1. Historical Market Size Value (US$ Million) & Volume (Tons) Trend Analysis By Market Taxonomy, 2019 to 2023
    10.2. Market Size Value (US$ Million) & Volume (Tons) Forecast By Market Taxonomy, 2024 to 2034
        10.2.1. By Country
            10.2.1.1. USA
            10.2.1.2. Canada
        10.2.2. By Cleaning Chemicals
        10.2.3. By End Use Industries
        10.2.4. By Chemistry Type
        10.2.5. By Technology
    10.3. Market Attractiveness Analysis
        10.3.1. By Country
        10.3.2. By Cleaning Chemicals
        10.3.3. By End Use Industries
        10.3.4. By Chemistry Type
        10.3.5. By Technology
    10.4. Key Takeaways
11. Latin America Market Analysis 2019 to 2023 and Forecast 2024 to 2034, By Country
    11.1. Historical Market Size Value (US$ Million) & Volume (Tons) Trend Analysis By Market Taxonomy, 2019 to 2023
    11.2. Market Size Value (US$ Million) & Volume (Tons) Forecast By Market Taxonomy, 2024 to 2034
        11.2.1. By Country
            11.2.1.1. Brazil
            11.2.1.2. Mexico
            11.2.1.3. Rest of Latin America
        11.2.2. By Cleaning Chemicals
        11.2.3. By End Use Industries
        11.2.4. By Chemistry Type
        11.2.5. By Technology
    11.3. Market Attractiveness Analysis
        11.3.1. By Country
        11.3.2. By Cleaning Chemicals
        11.3.3. By End Use Industries
        11.3.4. By Chemistry Type
        11.3.5. By Technology
    11.4. Key Takeaways
12. Western Europe Market Analysis 2019 to 2023 and Forecast 2024 to 2034, By Country
    12.1. Historical Market Size Value (US$ Million) & Volume (Tons) Trend Analysis By Market Taxonomy, 2019 to 2023
    12.2. Market Size Value (US$ Million) & Volume (Tons) Forecast By Market Taxonomy, 2024 to 2034
        12.2.1. By Country
            12.2.1.1. Germany
            12.2.1.2. UK
            12.2.1.3. France
            12.2.1.4. Spain
            12.2.1.5. Italy
            12.2.1.6. Rest of Western Europe
        12.2.2. By Cleaning Chemicals
        12.2.3. By End Use Industries
        12.2.4. By Chemistry Type
        12.2.5. By Technology
    12.3. Market Attractiveness Analysis
        12.3.1. By Country
        12.3.2. By Cleaning Chemicals
        12.3.3. By End Use Industries
        12.3.4. By Chemistry Type
        12.3.5. By Technology
    12.4. Key Takeaways
13. Eastern Europe Market Analysis 2019 to 2023 and Forecast 2024 to 2034, By Country
    13.1. Historical Market Size Value (US$ Million) & Volume (Tons) Trend Analysis By Market Taxonomy, 2019 to 2023
    13.2. Market Size Value (US$ Million) & Volume (Tons) Forecast By Market Taxonomy, 2024 to 2034
        13.2.1. By Country
            13.2.1.1. Poland
            13.2.1.2. Russia
            13.2.1.3. Czech Republic
            13.2.1.4. Romania
            13.2.1.5. Rest of Eastern Europe
        13.2.2. By Cleaning Chemicals
        13.2.3. By End Use Industries
        13.2.4. By Chemistry Type
        13.2.5. By Technology
    13.3. Market Attractiveness Analysis
        13.3.1. By Country
        13.3.2. By Cleaning Chemicals
        13.3.3. By End Use Industries
        13.3.4. By Chemistry Type
        13.3.5. By Technology
    13.4. Key Takeaways
14. South Asia and Pacific Market Analysis 2019 to 2023 and Forecast 2024 to 2034, By Country
    14.1. Historical Market Size Value (US$ Million) & Volume (Tons) Trend Analysis By Market Taxonomy, 2019 to 2023
    14.2. Market Size Value (US$ Million) & Volume (Tons) Forecast By Market Taxonomy, 2024 to 2034
        14.2.1. By Country
            14.2.1.1. India
            14.2.1.2. Bangladesh
            14.2.1.3. Australia
            14.2.1.4. New Zealand
            14.2.1.5. Rest of South Asia and Pacific
        14.2.2. By Cleaning Chemicals
        14.2.3. By End Use Industries
        14.2.4. By Chemistry Type
        14.2.5. By Technology
    14.3. Market Attractiveness Analysis
        14.3.1. By Country
        14.3.2. By Cleaning Chemicals
        14.3.3. By End Use Industries
        14.3.4. By Chemistry Type
        14.3.5. By Technology
    14.4. Key Takeaways
15. East Asia Market Analysis 2019 to 2023 and Forecast 2024 to 2034, By Country
    15.1. Historical Market Size Value (US$ Million) & Volume (Tons) Trend Analysis By Market Taxonomy, 2019 to 2023
    15.2. Market Size Value (US$ Million) & Volume (Tons) Forecast By Market Taxonomy, 2024 to 2034
        15.2.1. By Country
            15.2.1.1. China
            15.2.1.2. Japan
            15.2.1.3. South Korea
        15.2.2. By Cleaning Chemicals
        15.2.3. By End Use Industries
        15.2.4. By Chemistry Type
        15.2.5. By Technology
    15.3. Market Attractiveness Analysis
        15.3.1. By Country
        15.3.2. By Cleaning Chemicals
        15.3.3. By End Use Industries
        15.3.4. By Chemistry Type
        15.3.5. By Technology
    15.4. Key Takeaways
16. Middle East and Africa Market Analysis 2019 to 2023 and Forecast 2024 to 2034, By Country
    16.1. Historical Market Size Value (US$ Million) & Volume (Tons) Trend Analysis By Market Taxonomy, 2019 to 2023
    16.2. Market Size Value (US$ Million) & Volume (Tons) Forecast By Market Taxonomy, 2024 to 2034
        16.2.1. By Country
            16.2.1.1. GCC Countries
            16.2.1.2. South Africa
            16.2.1.3. Israel
            16.2.1.4. Rest of MEA
        16.2.2. By Cleaning Chemicals
        16.2.3. By End Use Industries
        16.2.4. By Chemistry Type
        16.2.5. By Technology
    16.3. Market Attractiveness Analysis
        16.3.1. By Country
        16.3.2. By Cleaning Chemicals
        16.3.3. By End Use Industries
        16.3.4. By Chemistry Type
        16.3.5. By Technology
    16.4. Key Takeaways
17. Key Countries Market Analysis
    17.1. USA
        17.1.1. Pricing Analysis
        17.1.2. Market Share Analysis, 2023
            17.1.2.1. By Cleaning Chemicals
            17.1.2.2. By End Use Industries
            17.1.2.3. By Chemistry Type
            17.1.2.4. By Technology
    17.2. Canada
        17.2.1. Pricing Analysis
        17.2.2. Market Share Analysis, 2023
            17.2.2.1. By Cleaning Chemicals
            17.2.2.2. By End Use Industries
            17.2.2.3. By Chemistry Type
            17.2.2.4. By Technology
    17.3. Brazil
        17.3.1. Pricing Analysis
        17.3.2. Market Share Analysis, 2023
            17.3.2.1. By Cleaning Chemicals
            17.3.2.2. By End Use Industries
            17.3.2.3. By Chemistry Type
            17.3.2.4. By Technology
    17.4. Mexico
        17.4.1. Pricing Analysis
        17.4.2. Market Share Analysis, 2023
            17.4.2.1. By Cleaning Chemicals
            17.4.2.2. By End Use Industries
            17.4.2.3. By Chemistry Type
            17.4.2.4. By Technology
    17.5. Germany
        17.5.1. Pricing Analysis
        17.5.2. Market Share Analysis, 2023
            17.5.2.1. By Cleaning Chemicals
            17.5.2.2. By End Use Industries
            17.5.2.3. By Chemistry Type
            17.5.2.4. By Technology
    17.6. UK
        17.6.1. Pricing Analysis
        17.6.2. Market Share Analysis, 2023
            17.6.2.1. By Cleaning Chemicals
            17.6.2.2. By End Use Industries
            17.6.2.3. By Chemistry Type
            17.6.2.4. By Technology
    17.7. France
        17.7.1. Pricing Analysis
        17.7.2. Market Share Analysis, 2023
            17.7.2.1. By Cleaning Chemicals
            17.7.2.2. By End Use Industries
            17.7.2.3. By Chemistry Type
            17.7.2.4. By Technology
    17.8. Spain
        17.8.1. Pricing Analysis
        17.8.2. Market Share Analysis, 2023
            17.8.2.1. By Cleaning Chemicals
            17.8.2.2. By End Use Industries
            17.8.2.3. By Chemistry Type
            17.8.2.4. By Technology
    17.9. Italy
        17.9.1. Pricing Analysis
        17.9.2. Market Share Analysis, 2023
            17.9.2.1. By Cleaning Chemicals
            17.9.2.2. By End Use Industries
            17.9.2.3. By Chemistry Type
            17.9.2.4. By Technology
    17.10. Poland
        17.10.1. Pricing Analysis
        17.10.2. Market Share Analysis, 2023
            17.10.2.1. By Cleaning Chemicals
            17.10.2.2. By End Use Industries
            17.10.2.3. By Chemistry Type
            17.10.2.4. By Technology
    17.11. Russia
        17.11.1. Pricing Analysis
        17.11.2. Market Share Analysis, 2023
            17.11.2.1. By Cleaning Chemicals
            17.11.2.2. By End Use Industries
            17.11.2.3. By Chemistry Type
            17.11.2.4. By Technology
    17.12. Czech Republic
        17.12.1. Pricing Analysis
        17.12.2. Market Share Analysis, 2023
            17.12.2.1. By Cleaning Chemicals
            17.12.2.2. By End Use Industries
            17.12.2.3. By Chemistry Type
            17.12.2.4. By Technology
    17.13. Romania
        17.13.1. Pricing Analysis
        17.13.2. Market Share Analysis, 2023
            17.13.2.1. By Cleaning Chemicals
            17.13.2.2. By End Use Industries
            17.13.2.3. By Chemistry Type
            17.13.2.4. By Technology
    17.14. India
        17.14.1. Pricing Analysis
        17.14.2. Market Share Analysis, 2023
            17.14.2.1. By Cleaning Chemicals
            17.14.2.2. By End Use Industries
            17.14.2.3. By Chemistry Type
            17.14.2.4. By Technology
    17.15. Bangladesh
        17.15.1. Pricing Analysis
        17.15.2. Market Share Analysis, 2023
            17.15.2.1. By Cleaning Chemicals
            17.15.2.2. By End Use Industries
            17.15.2.3. By Chemistry Type
            17.15.2.4. By Technology
    17.16. Australia
        17.16.1. Pricing Analysis
        17.16.2. Market Share Analysis, 2023
            17.16.2.1. By Cleaning Chemicals
            17.16.2.2. By End Use Industries
            17.16.2.3. By Chemistry Type
            17.16.2.4. By Technology
    17.17. New Zealand
        17.17.1. Pricing Analysis
        17.17.2. Market Share Analysis, 2023
            17.17.2.1. By Cleaning Chemicals
            17.17.2.2. By End Use Industries
            17.17.2.3. By Chemistry Type
            17.17.2.4. By Technology
    17.18. China
        17.18.1. Pricing Analysis
        17.18.2. Market Share Analysis, 2023
            17.18.2.1. By Cleaning Chemicals
            17.18.2.2. By End Use Industries
            17.18.2.3. By Chemistry Type
            17.18.2.4. By Technology
    17.19. Japan
        17.19.1. Pricing Analysis
        17.19.2. Market Share Analysis, 2023
            17.19.2.1. By Cleaning Chemicals
            17.19.2.2. By End Use Industries
            17.19.2.3. By Chemistry Type
            17.19.2.4. By Technology
    17.20. South Korea
        17.20.1. Pricing Analysis
        17.20.2. Market Share Analysis, 2023
            17.20.2.1. By Cleaning Chemicals
            17.20.2.2. By End Use Industries
            17.20.2.3. By Chemistry Type
            17.20.2.4. By Technology
    17.21. GCC Countries
        17.21.1. Pricing Analysis
        17.21.2. Market Share Analysis, 2023
            17.21.2.1. By Cleaning Chemicals
            17.21.2.2. By End Use Industries
            17.21.2.3. By Chemistry Type
            17.21.2.4. By Technology
    17.22. South Africa
        17.22.1. Pricing Analysis
        17.22.2. Market Share Analysis, 2023
            17.22.2.1. By Cleaning Chemicals
            17.22.2.2. By End Use Industries
            17.22.2.3. By Chemistry Type
            17.22.2.4. By Technology
    17.23. Israel
        17.23.1. Pricing Analysis
        17.23.2. Market Share Analysis, 2023
            17.23.2.1. By Cleaning Chemicals
            17.23.2.2. By End Use Industries
            17.23.2.3. By Chemistry Type
            17.23.2.4. By Technology
18. Market Structure Analysis
    18.1. Competition Dashboard
    18.2. Competition Benchmarking
    18.3. Market Share Analysis of Top Players
        18.3.1. By Regional
        18.3.2. By Cleaning Chemicals
        18.3.3. By End Use Industries
        18.3.4. By Chemistry Type
        18.3.5. By Technology
19. Competition Analysis
    19.1. Competition Deep Dive
        19.1.1. BASF SE
            19.1.1.1. Overview
            19.1.1.2. Product Portfolio
            19.1.1.3. Profitability by Market Segments
            19.1.1.4. Sales Footprint
            19.1.1.5. Strategy Overview
                19.1.1.5.1. Marketing Strategy
                19.1.1.5.2. Product Strategy
                19.1.1.5.3. Channel Strategy
        19.1.2. Stepan Company
            19.1.2.1. Overview
            19.1.2.2. Product Portfolio
            19.1.2.3. Profitability by Market Segments
            19.1.2.4. Sales Footprint
            19.1.2.5. Strategy Overview
                19.1.2.5.1. Marketing Strategy
                19.1.2.5.2. Product Strategy
                19.1.2.5.3. Channel Strategy
        19.1.3. Evonik Industries AG
            19.1.3.1. Overview
            19.1.3.2. Product Portfolio
            19.1.3.3. Profitability by Market Segments
            19.1.3.4. Sales Footprint
            19.1.3.5. Strategy Overview
                19.1.3.5.1. Marketing Strategy
                19.1.3.5.2. Product Strategy
                19.1.3.5.3. Channel Strategy
        19.1.4. Eastman Chemical Company
            19.1.4.1. Overview
            19.1.4.2. Product Portfolio
            19.1.4.3. Profitability by Market Segments
            19.1.4.4. Sales Footprint
            19.1.4.5. Strategy Overview
                19.1.4.5.1. Marketing Strategy
                19.1.4.5.2. Product Strategy
                19.1.4.5.3. Channel Strategy
        19.1.5. Nouryon
            19.1.5.1. Overview
            19.1.5.2. Product Portfolio
            19.1.5.3. Profitability by Market Segments
            19.1.5.4. Sales Footprint
            19.1.5.5. Strategy Overview
                19.1.5.5.1. Marketing Strategy
                19.1.5.5.2. Product Strategy
                19.1.5.5.3. Channel Strategy
        19.1.6. Clariant AG
            19.1.6.1. Overview
            19.1.6.2. Product Portfolio
            19.1.6.3. Profitability by Market Segments
            19.1.6.4. Sales Footprint
            19.1.6.5. Strategy Overview
                19.1.6.5.1. Marketing Strategy
                19.1.6.5.2. Product Strategy
                19.1.6.5.3. Channel Strategy
        19.1.7. The Chemours Company
            19.1.7.1. Overview
            19.1.7.2. Product Portfolio
            19.1.7.3. Profitability by Market Segments
            19.1.7.4. Sales Footprint
            19.1.7.5. Strategy Overview
                19.1.7.5.1. Marketing Strategy
                19.1.7.5.2. Product Strategy
                19.1.7.5.3. Channel Strategy
        19.1.8. Indorama Ventures Public Company Limited
            19.1.8.1. Overview
            19.1.8.2. Product Portfolio
            19.1.8.3. Profitability by Market Segments
            19.1.8.4. Sales Footprint
            19.1.8.5. Strategy Overview
                19.1.8.5.1. Marketing Strategy
                19.1.8.5.2. Product Strategy
                19.1.8.5.3. Channel Strategy
        19.1.9. Ashland Global Holdings
            19.1.9.1. Overview
            19.1.9.2. Product Portfolio
            19.1.9.3. Profitability by Market Segments
            19.1.9.4. Sales Footprint
            19.1.9.5. Strategy Overview
                19.1.9.5.1. Marketing Strategy
                19.1.9.5.2. Product Strategy
                19.1.9.5.3. Channel Strategy
        19.1.10. Dow
            19.1.10.1. Overview
            19.1.10.2. Product Portfolio
            19.1.10.3. Profitability by Market Segments
            19.1.10.4. Sales Footprint
            19.1.10.5. Strategy Overview
                19.1.10.5.1. Marketing Strategy
                19.1.10.5.2. Product Strategy
                19.1.10.5.3. Channel Strategy
20. Assumptions & Acronyms Used
21. Research Methodology
Recommendations

Healthcare

Surface Disinfectant Market

December 2023

REP-GB-1177

333 pages

Healthcare

Instrument Cleaners & Detergents Market

January 2023

REP-GB-10828

250 pages

Explore Chemicals & Materials Insights

View Reports
Future Market Insights

Aqueous-based Metal Cleaner Market

Schedule a Call