

- Market Size (2026)
- USD 1.3 Bn
- Forecast (2036)
- USD 2.4 Bn
- CAGR (2026 to 2036)
- 6.2%
How big is Automotive Fuel Analytics Modules Market in 2026?
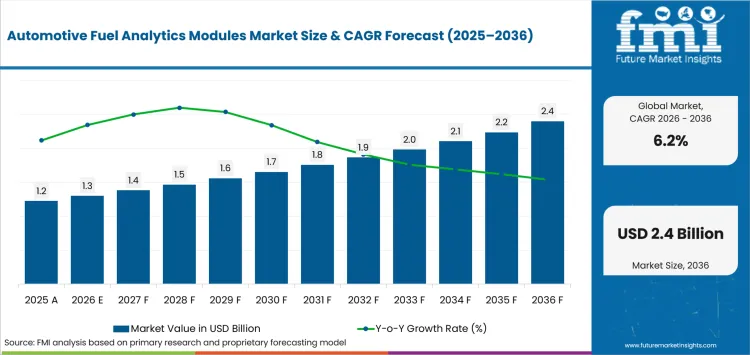
USD 1.3 billion in 2026 and USD 2.4 billion by 2036 at a 6.2% CAGR.
Demand for automotive fuel analytics modules is projected to expand at 6.2% CAGR between 2026 and 2036, pushing valuation from USD 1.3 billion in 2026 to USD 2.4 billion by 2036 as fleets tie fuel loss to specific operating actions. The USA Environmental Protection Agency stated in December 2025 that eliminating unnecessary idling can save a typical long-haul truck more than 900 gallons each year. The avoidable loss gives fuel analytics a direct cost-control role.
Country adoption diverges where fleet transition rules change the cost of conventional vehicles in urban service. In March 2025, the Dutch government confirmed that 14 municipalities had introduced zero-emission zones from January 1. Route eligibility therefore becomes part of fuel analysis as diesel and electric vehicles share delivery networks during replacement cycles.
Key Takeaways
- Fleet spending rises where fuel-loss data can be tied to idling, route planning or driver coaching with measurable operating savings.
- In 2026, cloud analytics modules are expected to lead module type with 28.0% share because centralized software compares many vehicles without replacing onboard hardware.
- By data source, CAN/OBD data is estimated to hold 27.0% in 2026 owing to direct engine signals that explain vehicle-level fuel performance.
- Commercial fleets are projected to hold 34.0% share in 2026 owing to repeated mileage that makes small efficiency changes financially visible.
- Data inconsistency and implementation cost can delay wider deployment because mixed fleets expose different signals and require extra mapping into existing systems.
- Some of the key players in this market include Geotab, Samsara, Verizon Connect, Webfleet, Trimble, Fleet Complete, Omnitracs, Solera Fleet Solutions, Bosch, and Continental.
Analyst Perspective
"Fuel analytics earns renewal budget after a fleet can trace waste to a route or vehicle and confirm the corrective action changed consumption. Platform depth carries less weight if mixed fleets expose incompatible signals or uneven OEM data access."
- Nikhil Kaitwade, Principal Consultant, Future Market Insights
How is the automotive fuel analytics modules market segmented?
The market is assessed by module type, data source, vehicle type, sales channel, application and region.
Module type identifies where the analytics logic runs. Data source separates direct vehicle signals from sensor and cloud records. Vehicle type captures duty-cycle economics while sales channel identifies the route to purchase. Application distinguishes fuel control from route efficiency, driver coaching and emissions reporting.
Why do cloud analytics modules lead the module type category?
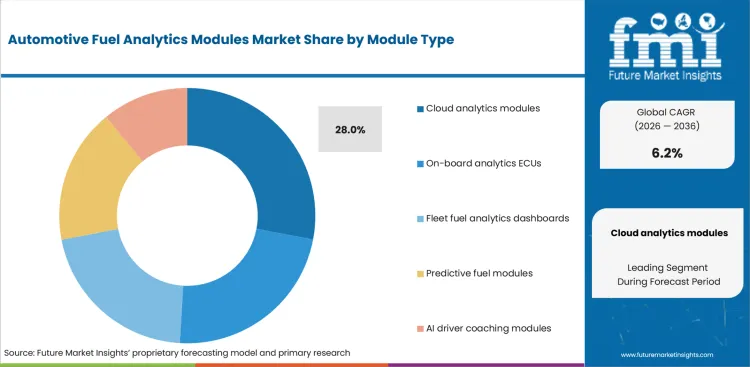
Cloud software centralizes fuel and idling records from vehicles using different onboard devices. Geotab expanded that model in February 2025 by introducing Sustainability Overview inside MyGeotab. The same account structure is common in commercial vehicle telematics deployments that centralize fleet oversight and distribute subscription updates to many fleet vehicles.
- In 2026, cloud analytics modules are expected to lead module type with 28.0% share because centralized processing scales comparison without replacing vehicle hardware.
- Subscription delivery lets fleet managers update reporting rules and compare mixed powertrains from one interface while vehicle hardware continues collecting source data.
Why does CAN/OBD data lead the data source category?
CAN/OBD feeds place engine state and diagnostic events beside mileage records for each vehicle. USA Department of Energy guidance updated in January 2026 says telematics can capture fuel consumption and mileage automatically for federal reporting. That record structure also supports automotive data management tasks requiring vehicle-level normalization.
- By data source, CAN/OBD data is estimated to hold 27.0% in 2026 owing to direct engine signals that explain fuel differences between similar routes.
- The feed becomes commercially useful after identifiers and units are normalized because location data alone cannot explain engine load or diagnostic conditions.
Why do commercial fleets lead the vehicle type category?
Commercial fleets accumulate enough mileage for small idling or routing changes to become financially visible. Natural Resources Canada reported in April 2026 that Green Freight Program funding had supported more than 50,000 truck and trailer retrofits. That upgrade cycle also sustains fleet management software purchases tied to operating efficiency.
- Commercial fleets are projected to hold 34.0% share in 2026 owing to repeated vehicle use that gives operators more chances to recover avoidable fuel loss.
- Retrofit timing lowers deployment friction because telematics can be installed during planned equipment work without requiring a separate vehicle replacement program.
Why do fleet telematics providers lead the sales channel category?
Fleet telematics providers already control device connectivity and account permissions for many commercial vehicles. In June 2025, Samsara and Element Fleet Management launched a joint offering that integrated procurement and onboarding for shared fleet customers. That route-to-market model shortens adoption for fleet telematics control units and paid analytics inside an existing fleet account.
- By sales channel, fleet telematics providers are forecast to represent 37.0% in 2026 driven by existing data permissions and active connected-fleet accounts.
- The channel can add fuel reporting without another login or device contract which reduces onboarding work for fleets already using telematics services.
Why does fuel cost optimization lead the application category?
Fuel cost optimization receives budget because fleets can act on idling or route variance without replacing vehicles. Samsara launched Fuel Command Center in August 2026 to centralize fuel use with driver behavior and routing recommendations. The spending logic also aligns with route optimization software used to remove avoidable distance.
- Based on application, fuel cost optimization is projected to account for 35.0% in 2026 due to direct links between analytics findings and controllable operating expense.
- Fleet managers can test one intervention against later consumption which makes fuel savings easier to verify than a broad dashboard improvement claim.
What are the drivers, restraints and opportunities in the Automotive Fuel Analytics Modules Market?
Fuel-cost accountability raises demand. Integration work delays rollout while direct vehicle-data access widens the fleet decisions one analytics layer can inform.
- Driver: Fleet operators fund analytics more readily if fuel efficiency can be compared against a specific route or operating change.
- Restraint: Mixed vehicle signals raise mapping work because fuel metrics lose comparability if engine parameters or identifiers change between platforms.
- Opportunity: Direct OEM data feeds can extend fuel analytics into route and maintenance decisions without adding another collection device.
Fuel-cost accountability strengthens the purchase case
Fuel analytics gains a stronger budget case where efficiency differences remain measurable at fleet level. The USA Environmental Protection Agency stated in July 2026 that fewer than 10% of SmartWay carriers qualified as carbon high performers. The performance spread gives fleet managers a benchmark for testing whether operating changes lower fuel use.
Integration work slows deployment in mixed fleets
Integration work begins before a dashboard can produce comparable fleet metrics. Bosch launched FleetME in July 2025 with more than 50 telematics and maintenance integrations on its platform. The breadth of those interfaces shows why mixed fleets need clear mapping rules before fuel records can support repeatable comparisons.
Direct vehicle feeds widen the analytics route
Direct vehicle feeds can widen fuel analytics beyond stand-alone consumption reporting. Geotab announced a cloud-to-cloud connection for eligible Tesla vehicles in September 2025 with owner-authorized access to vehicle data. Comparable OEM feeds can reduce device duplication and let connected vehicle technology rank energy exceptions beside route or maintenance conditions.
Which country CAGRs are profiled in the Automotive Fuel Analytics Modules Market?
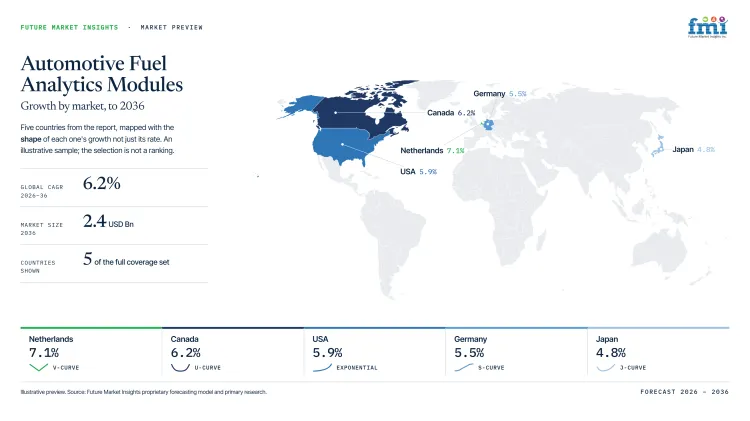
| Country | CAGR |
|---|---|
| Netherlands | 7.1% |
| Mexico | 6.5% |
| Canada | 6.2% |
| USA | 5.9% |
| Germany | 5.5% |
| France | 5.2% |
| Japan | 4.8% |
How do country-level CAGRs compare in the Automotive Fuel Analytics Modules Market?
The Netherlands and Mexico form the upper band followed by Canada and the USA. Germany and France sit in the middle while Japan advances more slowly as integration must fit established logistics routines.
- Netherlands favors earlier investment in dense urban deliveries.
- Mexico gives retrofit offers room inside dispatch budgets.
- Canada keeps energy-cost payback central to software approval.
- USA rewards platforms that normalize diverse telematics feeds.
- Germany values deeper utilization analysis on modern trucks.
- France links renewal planning with operating record continuity.
- Japan rewards software fitting existing shipper-carrier process controls.
Comparable CAGRs can yield different revenue pools because fleet population and connected-device penetration vary.The full report provides country-level CAGR analysis across North America, Latin America, Western Europe, Eastern Europe, East Asia, South Asia and Pacific and the Middle East and Africa.
Country-wise Analysis
- Dutch hauliers manage urban access rules beside high commercial road volumes in major cities, so vehicle assignment can change the value of each delivery. Statistics Netherlands reported in July 2026 that Dutch trucks carried 620 million tonnes of goods during 2025 for domestic and international freight. The Netherlands is projected to grow at 7.1% CAGR through 2036. Fuel comparisons remain useful during mixed diesel and electric operation in daily service. Large freight volumes favor fleet-level analytics, yet the commercial case weakens if energy records cannot stay comparable as city-serving contractors replace vehicles reliably on multi-year schedules.
- Mexican freight fleets often need efficiency gains that fit heterogeneous vehicles and existing dispatch tools in regional haulage without forcing a full systems replacement. Automotive fuel analytics module sales in Mexico are forecast to expand at 6.5% CAGR by 2036, aided by fuel-saving practices that fit retrofit programs at national scale today. SEMARNAT's March 2026 Transporte Limpio page sets a five-step reporting cycle for participating carriers ending with annual savings and emissions reporting. Participation is voluntary, so lower installation effort becomes a stronger entry advantage for operators requiring visible savings before extending analytics to additional vehicles at more depots.
- Canadian trucking businesses face long operating distances and fuel exposure through winter operations, which keeps payback central to technology approval even for mature fleets. Statistics Canada reported in September 2026 that 68.1% of truck transportation businesses cited energy costs as an operating obstacle during current planning. Existing telematics provide an adoption base during annual replacement cycles in large provincial fleet programs, though separate hardware or unfamiliar maintenance workflows can slow implementation. Canada's automotive fuel analytics modules outlook is anticipated to advance at 6.2% CAGR over the assessment period, tied to fuel-control pressure and better asset-use records in service.
- USA fleet operators usually extend software after vehicle-level evidence shows that a route or driver intervention can change fuel performance at scale. The Environmental Protection Agency stated in June 2026 that just over 2% of SmartWay truck carriers qualified as high performers on all metrics nationwide. USA is estimated to post 5.9% CAGR over the forecast period, because established telematics accounts make analytics easier to distribute through fleet groups. Vehicle diversity still complicates normalization, so platforms with broad vehicle tracking systems compete better in multi-brand fleets than tools tied to one device family or standardized engine-data feed reliably.
- German freight operators start from a modern heavy-truck base in long-haul service, which raises the threshold for software sold as an efficiency improvement. The German automotive fuel analytics modules sector is projected to record 5.5% CAGR during the assessment period, reflecting demand for utilization gains beyond basic emissions compliance. The Federal Ministry for Transport reported in August 2026 that Euro 6 vehicles generated 97.4% of 2025 freight transport performance. Automotive OEM telematics can shorten integration for newer vehicles, though mixed generations still require open interfaces before fuel and route metrics become comparable during fleet renewal and cross-border operations.
- French fleet operators must reconcile operating efficiency with renewal rules that change the powertrain mix inside covered public fleets and municipal service programs. The ecological transition ministry confirmed in June 2025 that local authorities must make low-emission vehicles at least 40% of annual renewals from 2025. Driver monitoring systems can add coaching context during implementation and multi-year public fleet renewal in regional service today, though transition costs may delay platform replacement. Adoption of automotive fuel analytics modules in France is estimated to expand at 5.2% CAGR through 2036, supported by reporting needs spanning conventional and electric vehicle replacement cycles.
- Japanese logistics operators work inside structured loading and dispatch routines, so analytics must fit existing process controls before managers change daily execution. METI published in July 2026 that truck drivers averaged 10 hours 13 minutes per operation with waiting and cargo handling taking 2 hours 2 minutes. Automotive fuel analytics module demand in Japan is forecast to rise at 4.8% CAGR over the forecast period, attributable to measurable route and dwell-time improvement. Transport management systems provide a familiar workflow base, but localized implementation is still necessary because fuel savings alone do not justify changing shipper-carrier procedures at company level.
Who are the notable companies in the Automotive Fuel Analytics Modules Market?
Geotab, Samsara, Verizon Connect, Webfleet, Trimble, Fleet Complete, Omnitracs, Solera Fleet Solutions, Bosch, and Continental are the notable companies serving this market.
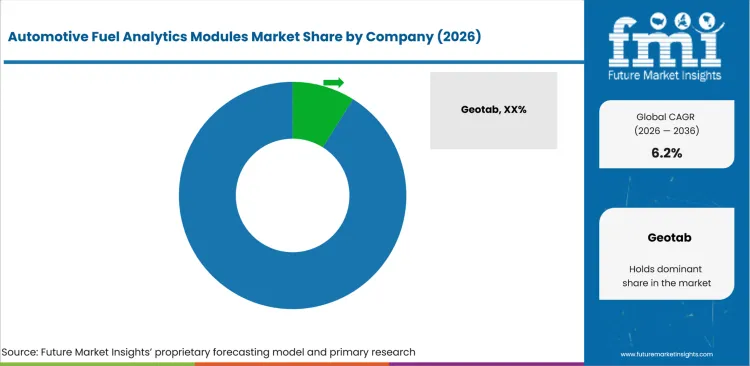
Competition turns on control of the vehicle-data path and the operating decision each platform can change. Fleet-facing telematics firms emphasize fuel visibility and workflow speed. Transportation software firms bring route or dispatch context, while Bosch and Continental enter through vehicle connectivity. Entry becomes harder once fleets require broad integrations plus proof that savings persist in mixed vehicle types.
- Fleet-facing telematics providers include Geotab and Samsara. Verizon Connect and Webfleet also emphasize connected vehicle data plus driver behavior and cloud reporting used by fleet operations teams.
- Transportation workflow platforms include Trimble and Fleet Complete. Omnitracs and Solera Fleet Solutions link analytics with routing plus dispatch and wider fleet operations.
- Vehicle-data specialists: Bosch and Continental provide automotive connectivity and commercial-vehicle data that can feed fleet analytics services.
Competitive Benchmarking: Automotive Fuel Analytics Modules Market
| Company | Fuel & Energy Analytics | Vehicle Data Integration | Driver/Route Optimization | Geographic Reach |
|---|---|---|---|---|
| Geotab | High | High | High | North America, Western Europe, Latin America and Asia-Pacific |
| Samsara | High | High | High | North America and Western Europe |
| Verizon Connect | High | High | High | United States, Canada and selected international markets |
| Webfleet | High | High | High | Western Europe, North America and selected international markets |
| Trimble | High | High | High | North America with international transportation-software reach |
| Fleet Complete | High | High | High | North America and selected international markets |
| Omnitracs | Medium | High | High | North America within Solera Fleet Solutions |
| Solera Fleet Solutions | High | High | High | North America and international fleet markets |
| Bosch | Medium | High | Medium | Europe, North America and Asia-Pacific |
| Continental | Medium | High | Medium | Europe with global commercial-vehicle systems reach |
Scoring basis: High requires broad documented functionality under the named criterion. Medium identifies a narrower documented role and Low requires a stated functional limit. Fuel and energy analytics covers consumption or efficiency. Vehicle-data integration covers connected inputs and normalization. Driver or route optimization requires a documented coaching, routing or dispatch action. Geographic reach reflects active markets documented in official company evidence.
Key Developments in the Automotive Fuel Analytics Modules Market
- In June 2026 Trimble introduced TMS for Shippers as a cloud-native platform covering freight planning and execution with monitoring and AI-supported transportation workflows.
- In November 2025, Samsara launched Commercial Navigation for USA trucking fleets to place truck-safe routing and compliance workflows inside its connected-operations platform.
- In March 2025, Continental introduced VDO DTCO 4.1a after receiving type approval for the updated smart tachograph used in European commercial fleets.
Key Players in the Automotive Fuel Analytics Modules Market
Cloud Telematics and Fuel Analytics Platforms
- Geotab
- Samsara
- Verizon Connect
- Webfleet
Transportation Workflow and Route Platforms
- Trimble
- Fleet Complete
- Omnitracs
- Solera Fleet Solutions
Embedded Vehicle Data and Connectivity
- Bosch
- Continental
Automotive Fuel Analytics Modules Market - Report Scope
| Coverage field | Report scope |
|---|---|
| Market breakdown | By module type, data source, vehicle type, sales channel, application and region. |
| Quantitative Units | USD million. |
| Market Definition | Paid automotive modules whose primary function is to analyze fuel consumption, fuel-related vehicle operation, route efficiency, driver behavior or emissions within the defined segmentation. Fuel itself, downstream transportation revenue, generic telematics without fuel analytics and stand-alone components without an analytics function are excluded. |
| Regions Covered | North America; Latin America; Western Europe; Eastern Europe; East Asia; South Asia and Pacific; Middle East and Africa. |
| Countries Covered | Netherlands, Mexico, Canada, USA, Germany, France, Japan, and 20+ countries included in the full report. |
| Key Companies Profiled | Geotab, Samsara, Verizon Connect, Webfleet, Trimble, Fleet Complete, Omnitracs, Solera Fleet Solutions, Bosch, Continental. |
| Forecast Period | 2026 to 2036. |
| Approach | Primary and secondary research with market triangulation. |
Automotive Fuel Analytics Modules Market - Research Methodology
| Method | Approach |
|---|---|
| Primary Research | FMI analysts gathered input from manufacturers, service providers, technology developers, distributors, end users, procurement teams, and subject-matter experts. Interviews examined purchasing decisions, product or service evaluation, adoption barriers, approval requirements, pricing considerations, and expectations for technical or commercial support. Respondents were also asked what evidence is required before a trial, pilot, or initial order develops into regular purchasing. |
| Desk Research | Desk research covered government statistics, regulatory publications, trade data, industry associations, technical literature, standards, company filings, product information, and official corporate announcements. Sources were reviewed for relevance, publication date, geographic coverage, and consistency with the defined market scope. Claims relating to performance, applications, approvals, capacity, investment, and commercial activity were retained only when supported by credible public evidence. |
| Market Sizing and Forecasting | The market model combined the baseline value with historical performance, segment structure, pricing and volume indicators, adoption levels, company participation, and country-level demand conditions. Forecast assumptions considered economic activity, investment trends, regulatory developments, technology adoption, purchasing cycles, supply availability, and barriers to wider market use. Segment and regional estimates were reconciled before the final market total was calculated. |
| Data Validation | Estimates were checked against multiple independent indicators, including public data, company activity, trade patterns, industry developments, and findings from primary interviews. Validation also tested whether products, services, applications, and company revenues fell within the defined market boundaries. Adjacent categories, unsupported claims, overlapping revenues, and activities without direct market relevance were excluded to reduce double counting and maintain consistency across segments and countries. |
Automotive Fuel Analytics Modules Market by Segments
Automotive Fuel Analytics Modules Market segmented by Module Type:
- Cloud analytics modules
- On-board analytics ECUs
- Fleet fuel analytics dashboards
- Predictive fuel modules
- AI driver coaching modules
Automotive Fuel Analytics Modules Market segmented by Data Source:
- CAN/OBD data
- Fuel flow sensors
- Telematics/GPS
- Engine ECU data
- Cloud fleet data
Automotive Fuel Analytics Modules Market segmented by Vehicle Type:
- Commercial fleets
- Passenger cars
- Buses/coaches
- Off-highway fleets
- Delivery vans
Automotive Fuel Analytics Modules Market segmented by Sales Channel:
- Fleet telematics providers
- OEM connected services
- Software subscription
- Aftermarket retrofit
Automotive Fuel Analytics Modules Market segmented by Application:
- Fuel cost optimization
- Route efficiency
- Driver coaching
- Emissions reporting
Automotive Fuel Analytics Modules Market by Region:
- North America
- United States
- Canada
- Latin America
- Brazil
- Mexico
- Argentina
- Chile
- Western Europe
- Germany
- France
- United Kingdom
- Italy
- Spain
- Benelux
- Nordics
- Eastern Europe
- Poland
- Czech Republic
- Romania
- Hungary
- East Asia
- China
- Japan
- South Korea
- South Asia and Pacific
- India
- ASEAN
- Australia and New Zealand
- Middle East and Africa
- GCC Countries
- South Africa
- Türkiye
- Israel
Research Sources and Bibliography
- USA Environmental Protection Agency. (2025, December 10). Idle Reduction.
- Government of the Netherlands. (2025, March 14). Gemeenten, brancheorganisaties en ministerie maken afspraken over zero-emissiezones.
- Geotab. (2025, December 8). Geotab Announces Sustainability Overview and EV Charge Monitoring for Improved Fleet Efficiency and Energy Cost Control.
- USA Department of Energy. (2026, January 15). Telematics for Federal Fleets: A Guide for Efficient Fleet Management.
- Natural Resources Canada. (2026, April 2). Green Freight Program drives change to more efficient fleets.
- Samsara. (2026, January 13). Samsara Releases 2025 Year in Review, Highlighting Safety, Fuel Efficiency, and Operations Across 90+ Billion Miles Driven.
- USA General Services Administration. (2025, September 22). GSA Fleet telematics.
- Verizon. (2026, February 24). 2026 Verizon Connect Fleet Technology Trends Report: AI-powered technology improves safety, productivity and data-driven decision-making.
- Webfleet. (2025, January 2). Fleet trends 2025: Technological advances.
- Samsara. (2025, June 10). Element and Samsara Partner to Launch Comprehensive Fleet and Operations Management Offering Across Canada and the United States.
- Statistics Netherlands. (2026, July 1). Lower volume of goods transported by road in 2025.
- USA Environmental Protection Agency. (2026, July 23). SmartWay High Performers: Truck Carriers, Carbon Metrics.
- Ministry of Economy, Trade and Industry, Japan. (2026, July 10). 物流効率化法に向けた荷主・物流事業者等の取組状況の調査の概要と調査結果の公表.
- Federal Ministry for Transport, Germany. (2026, August 4). Amtliche Güterkraftverkehrsstatistik.
- Statistics Canada. (2026, September 3). It all moves by truck.
- Ministry for Ecological Transition, France. (2025, June 26). Verdissement du parc automobile.
- Secretaría de Medio Ambiente y Recursos Naturales. (2026, August 3). Programa de Transporte Limpio.
- Samsara. (2026, August 19). Samsara Launches Fuel Command Center to Help Fleets Control Costs Amid Price Volatility.
- USA Environmental Protection Agency. (2026, June 22). SmartWay High Performers: Truck Carriers, All Metrics.
- Bosch. (2025, July 7). Bosch launches FleetME to help fleets manage maintenance in a unified solution.
- Powerfleet. (2025). Annual Report for the fiscal year ended March 31, 2025.
- Bridgestone EMEA. (2025, February 26). Frost & Sullivan names Webfleet European Fleet Telematics Company of the Year 2025.
- Solera. (2025, October 24). Solera Showcases the Future of Fleet Intelligence at ATA MCE 2025.
- Geotab. (2025, October 1). Geotab Acquires Verizon Connect's International Commercial Operations, Bolstering Global Reach and Small to Mid-Sized Fleet Solutions.
- Solera. (2025, April 7). Exciting News: Announcing the Addition of SmartDrive to the Solera Fleet Platform!.
- Geotab. (2025, October 2). Geotab Expands USA Operations in Metro Detroit to Meet Growing Demand for Connected Vehicle Solutions.
- Verizon Connect. (2025, November 12). Make smarter, faster decisions with AI-driven Operational Insights.
- Continental. (2025, March 26). Well Equipped for Europe: Continental Introduces the Smart Tachograph VDO DTCO 4.1a.
- Samsara. (2026, June 24). Samsara Launches New Agentic Capabilities to Automate Tedious Operational Tasks.
- Geotab. (2025, September 22). Geotab Announces Platform Can Now Connect to Tesla Vehicles, Unlocking Enhanced Fleet Performance and Efficiency.
- Samsara. (2025, November 12). Samsara Launches Leading Commercial Navigation Solution to Boost Safety and Compliance for USA Trucking Fleets.
- Trimble. (2026, June 16). Product announcement: Introducing Trimble TMS for Shippers.
- Continental. (2025, April 2). VDO Link: First Plug-and-play Solution for Connecting the Digital Tachograph to Cloud-based Services.
- Solera Holdings. (2025, March 24). The Solera Fleet Platform: Ushering in a New Era in Global Fleet Management.
This bibliography is provided for reader reference and is not exhaustive. The full report contains the complete reference list and detailed citations
This Report Answers
- What are the 2026 and 2036 market values?
- What makes fuel analytics spending easier to justify?
- Why do cloud analytics modules lead module type?
- How does CAN/OBD data improve fuel analysis?
- Why do commercial fleets lead vehicle type?
- How do integration work and uneven signals limit adoption?
- Why do CAGRs differ among seven profiled countries?
- How do ten profiled companies differ competitively?
- Which recent company actions affect fuel analytics workflows?
Frequently Asked Questions
How big is the automotive fuel analytics modules market in 2026?
The automotive fuel analytics modules market is valued at USD 1.3 billion in 2026 and is projected to reach USD 2.4 billion by 2036. Fleet spending rises where fuel loss can be tied to a controllable operating action.
What is the CAGR of the automotive fuel analytics modules market from 2026 to 2036?
The automotive fuel analytics modules market is projected to grow at a CAGR of 6.2% between 2026 and 2036. Expansion depends on connected vehicle data becoming usable for fuel control and routing plus driver coaching and emissions work.
Which module type leads the automotive fuel analytics modules market?
The cloud analytics modules segment is expected to hold 28.0% of the automotive fuel analytics modules market in 2026, driven by centralized multi-vehicle analysis. Cloud delivery also allows reporting updates without replacing vehicle hardware.
Which application leads the automotive fuel analytics modules market?
The fuel cost optimization segment is expected to hold 35.0% of the automotive fuel analytics modules market in 2026, attributable to direct operating savings. Idling and route variance give fleet managers specific actions to test against later consumption.
Which companies are active in the automotive fuel analytics modules market?
Key companies operating in the market include Geotab, Samsara, Verizon Connect, Webfleet, Trimble, Fleet Complete, Omnitracs, Solera Fleet Solutions, Bosch, and Continental. Their positions differ by vehicle-data coverage, fuel analytics depth, route context and fleet workflow integration.
Preview the report firsthand - request a free sample
Get SampleGet the brochure for pricing and purchase details.
Get PDFTable of Content
- Key Takeaways
- Market Size and CAGR
- Top Growth Driver
- Fastest Growing Segment
- Leading Region
- Key Companies
- Emerging Opportunities
- Executive Summary
- Global Market Outlook
- Demand-side Trends
- Supply-side Trends
- Technology Roadmap Analysis
- Analysis and Recommendations
- Analyst Perspective (What is happening? Why now? What should investors know?)
- Key Questions Answered
- How large is the market?
- What is the CAGR?
- What are key trends?
- Which region dominates?
- Who are the leaders?
- Market Overview
- Market Coverage / Taxonomy
- Market Definition / Scope / Limitations
- Research Methodology
- Chapter Orientation
- Analytical Lens and Working Hypotheses
- Market Structure, Signals, and Trend Drivers
- Benchmarking and Cross-market Comparability
- Market Sizing, Forecasting, and Opportunity Mapping
- Research Design and Evidence Framework
- Desk Research Programme (Secondary Evidence)
- Expert Input and Fieldwork (Primary Evidence)
- Tooling, Models, and Reference Databases
- Data Engineering and Model Build
- Quality Assurance and Audit Trail
- Market Background
- Market Dynamics (Drivers, Restraints, Opportunity, Trends)
- Scenario Forecast (Optimistic, Likely, Conservative)
- Impact Analysis
- AI Impact
- Sustainability Impact
- Regulatory Impact
- Technology Impact
- Consumer / Buyer Analysis
- Purchase Drivers
- Adoption Barriers
- Buyer Journey
- Opportunity Map Analysis
- Product Life Cycle Analysis
- Supply Chain Analysis
- Investment Feasibility Matrix
- Value Chain Analysis
- PESTLE and Porter's Analysis
- Regulatory Landscape
- Regional Parent Market Outlook
- Production and Consumption Statistics
- Import and Export Statistics
- Global Market Analysis and Forecast, 2021 to 2036
- Historical Market Size Value (USD Billion) Analysis, 2021 to 2025
- Current and Future Market Size Value (USD Billion) Projections, 2026 to 2036
- Y-o-Y Growth Trend Analysis
- Absolute $ Opportunity Analysis
- Global Market Pricing Analysis, 2021 to 2036
- Global Market Analysis and Forecast, By Module Type, 2021 to 2036
- Introduction / Key Findings
- Historical Market Size Value (USD Billion) Analysis By Module Type, 2021 to 2025
- Current and Future Market Size Value (USD Billion) Analysis and Forecast By Module Type, 2026 to 2036
- Cloud analytics modules
- On-board analytics ECUs
- Fleet fuel analytics dashboards
- Predictive fuel modules
- AI driver coaching modules
- Cloud analytics modules
- Y-o-Y Growth Trend Analysis By Module Type, 2021 to 2025
- Absolute $ Opportunity Analysis By Module Type, 2026 to 2036
- Global Market Analysis and Forecast, By Data Source, 2021 to 2036
- Introduction / Key Findings
- Historical Market Size Value (USD Billion) Analysis By Data Source, 2021 to 2025
- Current and Future Market Size Value (USD Billion) Analysis and Forecast By Data Source, 2026 to 2036
- CAN/OBD data
- Fuel flow sensors
- Telematics/GPS
- Engine ECU data
- Cloud fleet data
- CAN/OBD data
- Y-o-Y Growth Trend Analysis By Data Source, 2021 to 2025
- Absolute $ Opportunity Analysis By Data Source, 2026 to 2036
- Global Market Analysis and Forecast, By Vehicle Type, 2021 to 2036
- Introduction / Key Findings
- Historical Market Size Value (USD Billion) Analysis By Vehicle Type, 2021 to 2025
- Current and Future Market Size Value (USD Billion) Analysis and Forecast By Vehicle Type, 2026 to 2036
- Commercial fleets
- Passenger cars
- Buses/coaches
- Off-highway fleets
- Delivery vans
- Commercial fleets
- Y-o-Y Growth Trend Analysis By Vehicle Type, 2021 to 2025
- Absolute $ Opportunity Analysis By Vehicle Type, 2026 to 2036
- Global Market Analysis and Forecast, By Sales Channel, 2021 to 2036
- Introduction / Key Findings
- Historical Market Size Value (USD Billion) Analysis By Sales Channel, 2021 to 2025
- Current and Future Market Size Value (USD Billion) Analysis and Forecast By Sales Channel, 2026 to 2036
- Fleet telematics providers
- OEM connected services
- Software subscription
- Aftermarket retrofit
- Fleet telematics providers
- Y-o-Y Growth Trend Analysis By Sales Channel, 2021 to 2025
- Absolute $ Opportunity Analysis By Sales Channel, 2026 to 2036
- Global Market Analysis and Forecast, By Application, 2021 to 2036
- Introduction / Key Findings
- Historical Market Size Value (USD Billion) Analysis By Application, 2021 to 2025
- Current and Future Market Size Value (USD Billion) Analysis and Forecast By Application, 2026 to 2036
- Fuel cost optimization
- Route efficiency
- Driver coaching
- Emissions reporting
- Fuel cost optimization
- Y-o-Y Growth Trend Analysis By Application, 2021 to 2025
- Absolute $ Opportunity Analysis By Application, 2026 to 2036
- Global Market Analysis and Forecast, By Region, 2021 to 2036
- Introduction
- Historical Market Size Value (USD Billion) Analysis By Region, 2021 to 2025
- Current Market Size Value (USD Billion) Analysis and Forecast By Region, 2026 to 2036
- North America
- Latin America
- Western Europe
- Eastern Europe
- East Asia
- South Asia and Pacific
- Middle East & Africa
- Market Attractiveness Analysis By Region
- North America Market Analysis and Forecast, By Country, 2021 to 2036
- Historical Market Size Value (USD Billion) Trend Analysis By Market Taxonomy, 2021 to 2025
- Market Size Value (USD Billion) Forecast By Market Taxonomy, 2026 to 2036
- By Country
- USA
- Canada
- By Module Type
- By Data Source
- By Vehicle Type
- By Sales Channel
- By Application
- By Country
- Market Attractiveness Analysis
- By Country
- By Module Type
- By Data Source
- By Vehicle Type
- By Sales Channel
- By Application
- Key Takeaways
- Latin America Market Analysis and Forecast, By Country
- Historical Market Size Value (USD Billion) Trend Analysis By Market Taxonomy, 2021 to 2025
- Market Size Value (USD Billion) Forecast By Market Taxonomy, 2026 to 2036
- By Country
- Brazil
- Mexico
- Chile
- Rest of Latin America
- By Module Type
- By Data Source
- By Vehicle Type
- By Sales Channel
- By Application
- By Country
- Market Attractiveness Analysis
- By Country
- By Module Type
- By Data Source
- By Vehicle Type
- By Sales Channel
- By Application
- Key Takeaways
- Western Europe Market Analysis and Forecast, By Country
- Historical Market Size Value (USD Billion) Trend Analysis By Market Taxonomy, 2021 to 2025
- Market Size Value (USD Billion) Forecast By Market Taxonomy, 2026 to 2036
- By Country
- Germany
- UK
- Italy
- Spain
- France
- Nordic
- BENELUX
- Rest of Western Europe
- By Module Type
- By Data Source
- By Vehicle Type
- By Sales Channel
- By Application
- By Country
- Market Attractiveness Analysis
- By Country
- By Module Type
- By Data Source
- By Vehicle Type
- By Sales Channel
- By Application
- Key Takeaways
- Eastern Europe Market Analysis and Forecast, By Country
- Historical Market Size Value (USD Billion) Trend Analysis By Market Taxonomy, 2021 to 2025
- Market Size Value (USD Billion) Forecast By Market Taxonomy, 2026 to 2036
- By Country
- Russia
- Poland
- Hungary
- Balkan & Baltic
- Rest of Eastern Europe
- By Module Type
- By Data Source
- By Vehicle Type
- By Sales Channel
- By Application
- By Country
- Market Attractiveness Analysis
- By Country
- By Module Type
- By Data Source
- By Vehicle Type
- By Sales Channel
- By Application
- Key Takeaways
- East Asia Market Analysis and Forecast, By Country
- Historical Market Size Value (USD Billion) Trend Analysis By Market Taxonomy, 2021 to 2025
- Market Size Value (USD Billion) Forecast By Market Taxonomy, 2026 to 2036
- By Country
- China
- Japan
- South Korea
- By Module Type
- By Data Source
- By Vehicle Type
- By Sales Channel
- By Application
- By Country
- Market Attractiveness Analysis
- By Country
- By Module Type
- By Data Source
- By Vehicle Type
- By Sales Channel
- By Application
- Key Takeaways
- South Asia and Pacific Market Analysis and Forecast, By Country
- Historical Market Size Value (USD Billion) Trend Analysis By Market Taxonomy, 2021 to 2025
- Market Size Value (USD Billion) Forecast By Market Taxonomy, 2026 to 2036
- By Country
- India
- ASEAN
- Australia & New Zealand
- Rest of South Asia and Pacific
- By Module Type
- By Data Source
- By Vehicle Type
- By Sales Channel
- By Application
- By Country
- Market Attractiveness Analysis
- By Country
- By Module Type
- By Data Source
- By Vehicle Type
- By Sales Channel
- By Application
- Key Takeaways
- Middle East & Africa Market Analysis and Forecast, By Country
- Historical Market Size Value (USD Billion) Trend Analysis By Market Taxonomy, 2021 to 2025
- Market Size Value (USD Billion) Forecast By Market Taxonomy, 2026 to 2036
- By Country
- Kingdom of Saudi Arabia
- Other GCC Countries
- Türkiye
- South Africa
- Other African Union
- Rest of Middle East & Africa
- By Module Type
- By Data Source
- By Vehicle Type
- By Sales Channel
- By Application
- By Country
- Market Attractiveness Analysis
- By Country
- By Module Type
- By Data Source
- By Vehicle Type
- By Sales Channel
- By Application
- Key Takeaways
- Key Countries Market Analysis
- USA
- Pricing Analysis
- Market Share Analysis, 2025
- By Module Type
- By Data Source
- By Vehicle Type
- By Sales Channel
- By Application
- Canada
- Pricing Analysis
- Market Share Analysis, 2025
- By Module Type
- By Data Source
- By Vehicle Type
- By Sales Channel
- By Application
- Mexico
- Pricing Analysis
- Market Share Analysis, 2025
- By Module Type
- By Data Source
- By Vehicle Type
- By Sales Channel
- By Application
- Brazil
- Pricing Analysis
- Market Share Analysis, 2025
- By Module Type
- By Data Source
- By Vehicle Type
- By Sales Channel
- By Application
- Chile
- Pricing Analysis
- Market Share Analysis, 2025
- By Module Type
- By Data Source
- By Vehicle Type
- By Sales Channel
- By Application
- Germany
- Pricing Analysis
- Market Share Analysis, 2025
- By Module Type
- By Data Source
- By Vehicle Type
- By Sales Channel
- By Application
- UK
- Pricing Analysis
- Market Share Analysis, 2025
- By Module Type
- By Data Source
- By Vehicle Type
- By Sales Channel
- By Application
- Italy
- Pricing Analysis
- Market Share Analysis, 2025
- By Module Type
- By Data Source
- By Vehicle Type
- By Sales Channel
- By Application
- Spain
- Pricing Analysis
- Market Share Analysis, 2025
- By Module Type
- By Data Source
- By Vehicle Type
- By Sales Channel
- By Application
- France
- Pricing Analysis
- Market Share Analysis, 2025
- By Module Type
- By Data Source
- By Vehicle Type
- By Sales Channel
- By Application
- India
- Pricing Analysis
- Market Share Analysis, 2025
- By Module Type
- By Data Source
- By Vehicle Type
- By Sales Channel
- By Application
- ASEAN
- Pricing Analysis
- Market Share Analysis, 2025
- By Module Type
- By Data Source
- By Vehicle Type
- By Sales Channel
- By Application
- Australia & New Zealand
- Pricing Analysis
- Market Share Analysis, 2025
- By Module Type
- By Data Source
- By Vehicle Type
- By Sales Channel
- By Application
- China
- Pricing Analysis
- Market Share Analysis, 2025
- By Module Type
- By Data Source
- By Vehicle Type
- By Sales Channel
- By Application
- Japan
- Pricing Analysis
- Market Share Analysis, 2025
- By Module Type
- By Data Source
- By Vehicle Type
- By Sales Channel
- By Application
- South Korea
- Pricing Analysis
- Market Share Analysis, 2025
- By Module Type
- By Data Source
- By Vehicle Type
- By Sales Channel
- By Application
- Russia
- Pricing Analysis
- Market Share Analysis, 2025
- By Module Type
- By Data Source
- By Vehicle Type
- By Sales Channel
- By Application
- Poland
- Pricing Analysis
- Market Share Analysis, 2025
- By Module Type
- By Data Source
- By Vehicle Type
- By Sales Channel
- By Application
- Hungary
- Pricing Analysis
- Market Share Analysis, 2025
- By Module Type
- By Data Source
- By Vehicle Type
- By Sales Channel
- By Application
- Kingdom of Saudi Arabia
- Pricing Analysis
- Market Share Analysis, 2025
- By Module Type
- By Data Source
- By Vehicle Type
- By Sales Channel
- By Application
- Türkiye
- Pricing Analysis
- Market Share Analysis, 2025
- By Module Type
- By Data Source
- By Vehicle Type
- By Sales Channel
- By Application
- South Africa
- Pricing Analysis
- Market Share Analysis, 2025
- By Module Type
- By Data Source
- By Vehicle Type
- By Sales Channel
- By Application
- USA
- Market Structure Analysis
- Competition Dashboard
- Competition Benchmarking
- Market Share Analysis of Top Players
- By Regional
- By Module Type
- By Data Source
- By Vehicle Type
- By Sales Channel
- By Application
- Emerging Startups
- Innovation Benchmarking
- Competition Analysis
- Competition Deep Dive
- Geotab
- Overview
- Product Portfolio
- Profitability by Market Segments
- Sales Footprint
- Strategy Overview
- Marketing Strategy
- Product Strategy
- Channel Strategy
- Samsara
- Verizon Connect
- Trimble
- Bosch
- Continental
- Fleet Complete
- Omnitracs
- Webfleet
- Solera Fleet Solutions
- Geotab
- Case Studies
- Success Stories
- Recent Developments
- Competition Deep Dive
- Assumptions & Acronyms Used


