
- Market Size (2026)
- USD 820.0 Bn
- Forecast (2036)
- USD 1361.4 Bn
- CAGR (2026 to 2036)
- 5.2%
How big is Automotive Repair & Maintenance Services Market in 2026?
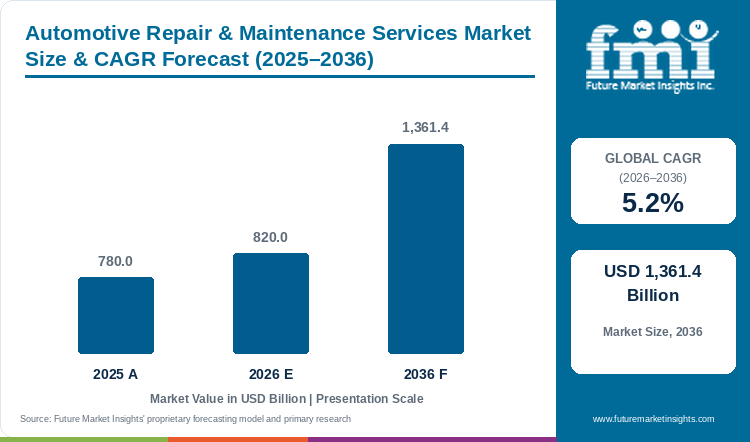
Assessed at USD 780.0 billion in 2025 and progressing to USD 820.0 billion in 2026, the automotive repair and maintenance services market valuation is on course to reach USD 1,361.4 billion by 2036, supported by a forecast-period CAGR of 5.2%.
The global automotive repair and maintenance services market was valued at USD 780.0 billion in 2025 and is estimated to reach USD 820.0 billion in 2026. Overall industry valuation is projected to reach USD 1,361.4 billion by 2036, expanding at a compound annual growth rate (CAGR) of 5.2% between 2026 and 2036. Mechanical Repair covering engines, transmissions, steering, and brakes is estimated to capture a leading 44.0% share of 2026 service category demand, given that vehicle owners retaining cars past 12 years face recurring wear-part and driveline replacements. Buyer adoption tracking at FMI shows that motorists, commercial fleet operators, and motor insurers are purchasing workshop bay hours at higher average ticket values since embedded radar, camera, and battery-management electronics turn routine bumper, glass, and suspension repairs into multi-stage diagnostic and calibration jobs. That labor-rate and ticket-complexity dynamic separates general repair bays from the faster-growing ADAS calibration equipment systems category at an 11.3% CAGR, since tool makers sell optical target rigs during initial bay retrofits whereas repair garages bill calibration labor on every post-collision and windshield visit. Official consumer price tracking from the US Bureau of Transportation Statistics confirmed this ticket expansion in February 2026, reporting that motor vehicle maintenance and repair prices rose 4.9% year-over-year in January 2026 as the single largest transportation contributor to consumer price inflation [1]. Multi-store service chains are actively acquiring bays to capture that recurring traffic, evidenced when Valvoline reported a 24% top-line increase and 47 net store additions in its third quarter of fiscal 2026 in August 2026 [2]. Service networks that combine certified high-voltage and optical calibration tooling with sub-30-minute express maintenance lanes retain both retail drivers and commercial fleet maintenance accounts through 2036.
Key Market Trends & Insights
- By service category: Mechanical Repair (Engine, Transmission, Steering, and Brakes) holds an estimated 44.0% share in 2026 given that aging out-of-warranty vehicles require labor-intensive chassis, brake, and driveline overhauls.
- By service provider channel: Franchised Dealership OEM Service Centers (4S) represent 58.0% in 2026 since encrypted onboard diagnostics, warranty recall work, and software updates anchor dealer workshop retention.
- By vehicle class: Passenger Cars and SUVs account for 72.0% in 2026 owing to high global private motorization rates and heavier sport-utility curb weights that accelerate tire, brake, and suspension wear.
- By propulsion type: Internal Combustion Engine (ICE) Vehicles secure 76.0% in 2026 on account of the massive installed global parc of gasoline and diesel vehicles requiring scheduled oil, filter, timing-belt, and exhaust maintenance.
- By customer and billing type: Individual Retail Vehicle Owners command 66.0% in 2026 through out-of-pocket maintenance and post-warranty mechanical repairs on household vehicles.
Regional Highlights
- Top national expansion: India leads national growth projections at a 6.7% CAGR through 2036 under rapid passenger car parc expansion, highway mileage growth, and organized multi-brand workshop rollouts.
- Broader country progression: Poland tracks at a 5.8% CAGR ahead of Canada at 5.6% and the USA at 5.3%, whereas Germany follows at 5.0% and France, Italy, and the UK advance at 4.8%, 4.6%, and 4.5%.
Market Size & Forecast
Table 1: Market Size and Forecast for the Automotive Repair & Maintenance Services Market (USD billion and CAGR percentage), 2025 to 2036
| Metric | Value |
|---|---|
| 2025 Market Size | USD 780.0 billion |
| Estimated Market Size in 2026 | USD 820.0 billion |
| Projected Market Size by 2036 | USD 1,361.4 billion |
| CAGR, 2026 to 2036 | 5.2% |
| Added Revenue, 2026 to 2036 | USD 541.4 billion |
Elevated new-vehiclesticker prices and financing rates across North America and Europe are prompting households and commercial delivery fleets to keep existing cars and vans in active road service for more than a decade. When vehicles pass the six-to-eight-year mark, routine oil and filter visits give way to high-margin timing chain, alternator, turbocharger, strut, and dual-clutch transmission replacements across garage and service station networks. Official data from October 2026 economic indicator data from the US Census Bureau, private construction spending on automotive service and parts establishments in the United States reached a seasonally adjusted annualized level of USD 6.2 billion in August 2026, nearly double the USD 3.2 billion spent on new-car dealership showrooms [3]. That physical bay investment confirms that aftermarket operators are building capacity for long-term post-warranty repair demand.
Workshop Labor Economics and Technician Productivity Sizing
Table 2: Workshop Bay Throughput and Labor Economics for the Automotive Repair & Maintenance Services Market (USD billion and operational ranges), 2025 to 2036
| Metric | 2025 | 2026 | 2036 |
|---|---|---|---|
| Market size (USD billion) | 780.0 | 820.0 | 1,361.4 |
| Global active light and commercial vehicle parc in service (billion vehicles) | 1.48 to 1.52 | 1.51 to 1.56 | 1.82 to 1.90 |
| Average annual maintenance and repair spend per active vehicle (USD) | 515.0 to 530.0 | 530.0 to 550.0 | 720.0 to 755.0 |
| Repair orders requiring electronic diagnostic scan or ADAS calibration (%) | 28.0% to 32.0% | 31.0% to 35.0% | 58.0% to 64.0% |
Operational note: Repair order (RO) ticket ranges blend quick-lube preventative maintenance visits (USD 85 to USD 140) with mechanical, collision, and ADAS calibration repair orders (USD 450 to USD 3,200).
Modern service garages require mechanics trained in both mechanical torque specifications and computerized controller-area-network (CAN-bus) fault tracing to prevent repeat comebacks. Official occupational employment projections updated by the US Bureau of Labor Statistics in September 2026 confirm that median annual wages for automotive service technicians reached USD 50,620 in May 2025 with 66,200 annual technician openings projected from 2025 to 2035 [4]. Higher technician wage rates and extended drain intervals using synthetic lubricants and functional fluids push shop owners to invest in automated alignment racks and digital vehicle inspection tablets that boost billed labor hours per bay.
Global Vehicle Parc & Electrified Powertrain Service Indicators
Table 3: Global Vehicle Parc and Service Ticket Indicators for the Automotive Repair & Maintenance Services Market (operational metrics), 2025 to 2036
| Metric | 2025 | 2026 | 2036 |
|---|---|---|---|
| US median automotive service technician annual wage (USD, BLS basis) | 50,620 | 52,800 | 74,500 |
| EU registered battery-electric passenger car fleet requiring EV-certified bays (million units, Eurostat) | 7.59 | 9.60 | 38.50 |
| US private construction spending on auto service/parts facilities (USD billion SAAR, Census Bureau) | 5.8 | 6.2 | 9.8 |
| Average passenger car age across North America and EU-27 (years) | 12.4 to 12.7 | 12.6 to 12.8 | 13.4 to 13.8 |
Table 4: Channel & Macroeconomic Reference Indicators for the Automotive Repair & Maintenance Services Market (values and institutional reference basis), 2026
| Metric | Value | Institutional Reference Basis |
|---|---|---|
| Market size, 2026 | USD 820.0 billion | 2026 global revenue baseline |
| US motor vehicle maintenance & repair CPI inflation rate, Jan 2026 | +4.9% YoY (+2.1% headline contribution) | US Bureau of Transportation Statistics (BTS) CPI release |
| US annual projected automotive technician job openings, 2025-2035 | 66,200 openings per year | US Bureau of Labor Statistics Occupational Outlook |
| Franchised Dealership OEM Service Centers (4S) revenue, 2026 | USD 475.6 billion | 58.0% service provider channel allocation |
While internal combustion engines still generate the bulk of mechanical bay volume, the rapid expansion of battery-electric and hybrid passenger fleets is reshaping workshop tooling toward high-voltage insulated bays, heavy-duty battery lifts, and thermal-management fluid flushes. As reported by Eurostat in July 2026, new battery-only electric passenger car registrations in the European Union rose 29.7% in 2025 to 1.89 million units, lifting the active EU battery-electric car fleet by 31.5% to 7.59 million vehicles and 1.03 million new plug-in hybrids [5]. Collision and mechanical chains adopting OEM-approved collision repair adhesive systems and high-voltage safety certifications capture lucrative insurer and fleet referrals on these heavier electrified models.
Analyst Perspective
"Independent workshops and regional service chains can no longer compete on cheap oil changes alone when every late-model bumper removal or windshield replacement triggers a mandatory radar and camera recalibration. Multi-brand service consolidators that equip local bays with OEM diagnostic scan tools, high-voltage EV lift bays, and insurer-integrated digital estimating software will capture the highest-margin repair orders through 2036."
- Nikhil Kaitwade, Principal Consultant, Future Market Insights.
How is the automotive repair & maintenance services market segmented?
The automotive repair & maintenance services market is segmented by service category, service provider channel, vehicle class, propulsion type, and customer & billing type. In 2026, Mechanical Repair is projected at 44.0%, Franchised Dealership OEM Service Centers (4S) at 58.0%, Passenger Cars and SUVs at 72.0%, Internal Combustion Engine (ICE) Vehicles at 76.0%, and Individual Retail Vehicle Owners at 66.0%.
By service category: Mechanical Repair (Engine, Transmission, Steering, and Brakes), Collision Bodywork Paint and Dent Repair, Routine Maintenance (Oil Change, Filters, Tires, and Alignment), and Electrical and Electronic ADAS Sensor Calibration & Battery Diagnostics.
By service provider channel: Franchised Dealership OEM Service Centers (4S), Independent Multi-Brand Repair Garages and Workshops, Tire and Fast-Lube Chains, and Mobile On-Site Mechanics & Fleet Maintenance Hubs.
By vehicle class: Passenger Cars and SUVs, Light Commercial Vans and Pickups, Heavy Commercial Trucks and Buses, and Two-Wheelers & Urban Micro-Mobility Vehicles.
By propulsion type: Internal Combustion Engine (ICE) Vehicles, Hybrid Electric Vehicles (HEV and PHEV), Battery Electric Vehicles (BEV), and Alternative Fuel (CNG, LPG, and Commercial Diesel) Vehicles.
By customer and billing type: Individual Retail Vehicle Owners, Commercial and Corporate Fleet Contracts, Insurance and Extended Warranty Direct-Repair Programs, and Vehicle Leasing & Subscription Operators.
Why does Mechanical Repair lead the service category?
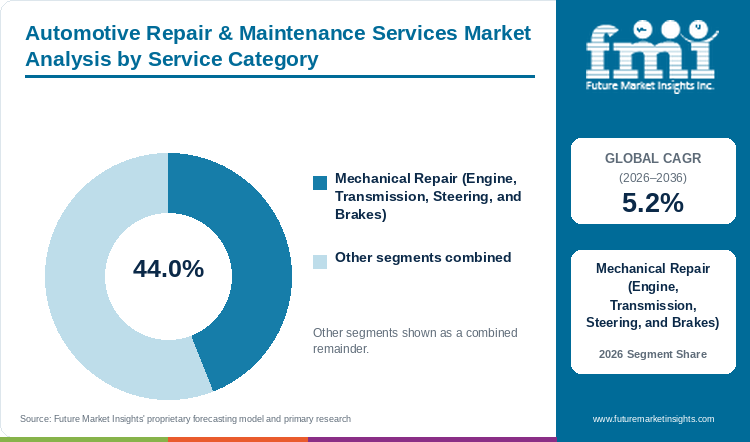
Mechanical Repair holds an estimated 44.0% of service category demand in 2026, anchored by high-ticket engine, transmission, steering, and brake overhauls across out-of-warranty vehicles.
Table 5: Service Category Share for the Automotive Repair & Maintenance Services Market (percentage share), 2026
| Service Category | Share (2026) |
|---|---|
| Mechanical Repair (Engine, Transmission, Steering, and Brakes) | 44.0% |
| Other Segments Combined | 56.0%* |
| Total | 100.0% |
*Note: Remaining service categories account for the balance of 2026 global automotive repair and maintenance services demand.
Table 6: Service Category Leadership and Market Growth for the Automotive Repair & Maintenance Services Market (segment and CAGR percentage), 2026 to 2036
| Metric | Value |
|---|---|
| Global CAGR (2026 to 2036) | 5.2% |
| Leading Segment | Mechanical Repair (Engine, Transmission, Steering, and Brakes) |
Mechanical Repair encompassing engine overhaul, transmission rebuilds, steering rack replacement, and brake system servicing commands the largest share of workshop revenue since high cumulative mileage subjects moving metal and hydraulic assemblies to unavoidable friction and thermal fatigue. Drivers logging heavy commuter miles generate recurring replacement demand for automotive brake systems and components such as calipers, rotors, master cylinders, and wheel bearings. Traffic monitoring released by the US Federal Highway Administration in March 2026 confirmed that seasonally adjusted US vehicle miles traveled reached 277.2 billion miles in January 2026 and 3,323.9 billion miles in full-year 2025, sustaining intense mechanical wear across the active vehicle fleet [6]. However, rising component modularity often forces mechanics to replace entire sealed sub-assemblies rather than rebuilding individual valves or gears.
- Within the service category segment, Mechanical Repair is projected to account for a leading 44.0% share in 2026, driven by high-ticket engine, transmission, steering, and braking repairs on out-of-warranty vehicles.
- While mechanical repair retains top revenue share, Electrical and Electronic ADAS Sensor Calibration and Battery Diagnostics is forecast to record the fastest category growth rate through 2036 as software-defined vehicles proliferate.
What sustains Franchised Dealership OEM Service Centers (4S) leadership in the service provider channel?
Franchised Dealership OEM Service Centers (4S) represent 58.0% of the service provider channel in 2026, supported by encrypted OEM diagnostic software, warranty recalls, and prepaid service plans.
Franchised Dealership OEM Service Centers (4S) capture the majority of global service expenditure by combining factory-trained technicians, proprietary over-the-air and wired diagnostic gateways, genuine OEM replacement parts, and bundled prepaid maintenance plans sold at vehicle purchase. Automakers steadily lock safety-critical electronic control units, battery management systems, and automotive suspension systems behind encrypted dealer software portals, compelling owners of zero-to-six-year-old vehicles and leased fleets to return to authorized 4S service lanes. Even so, higher dealer hourly labor rates compared with independent multi-brand garages cause many price-sensitive motorists to defect to aftermarket chains once factory warranties expire.
- In 2026, Franchised Dealership OEM Service Centers (4S) are anticipated to capture 58.0% of global service provider channel value, supported by recall campaigns, factory warranty coverage, and proprietary EV and ADAS tooling.
- AutoNation reported in its second quarter 2026 financial release in July 2026 that Parts and Service revenue rose 3.4% year-over-year while segment gross margin expanded 30 basis points to 48.1%, generating 49.3% of total dealership gross profit [7].
How do Passenger Cars and SUVs lead the vehicle class category?
Passenger Cars and SUVs account for 72.0% of vehicle class demand in 2026, driven by high global household car ownership and heavier SUV curb weights that accelerate chassis wear.
Passenger Cars and SUVs generate the dominant share of global repair bay bookings since household motorization exceeds 1.3 billion active light vehicles globally and consumer preference has shifted decisively toward heavier sport-utility crossovers. Heavier SUV unladen curb weights place substantially higher dynamic loads on ball joints, control arms, tires, and hydraulic automotive brake fluids during urban stop-and-go driving. Fleet weight statistics published by Eurostat in July 2026 confirmed that the share of heavy passenger cars with unladen weight of 1,500 kilograms or more is rising continuously across the European Union due to SUV popularity, safety equipment, and hybrid battery packs [8]. Despite strong visit volume, fragmented consumer scheduling creates seasonal bay-utilization swings compared with contracted commercial truck fleets.
- By vehicle class, Passenger Cars and SUVs are estimated to reach 72.0% of total category share in 2026 as high global car ownership and heavier crossover curb weights sustain tire, brake, and chassis servicing.
- Light Commercial Vans and Pickups are projected to post rapid incremental bay growth through 2036 as e-commerce last-mile delivery fleets run high daily stop-start duty cycles requiring frequent preventative maintenance.
Why do Internal Combustion Engine (ICE) Vehicles lead the propulsion type category?
Internal Combustion Engine (ICE) Vehicles secure 76.0% of propulsion type service volume in 2026, supported by the vast installed parc of 6-to-15-year-old gasoline and diesel vehicles.
Internal Combustion Engine (ICE) Vehicles running on gasoline and diesel remain the primary revenue engine for global repair shops since internal combustion powertrains contain more than 2,000 moving parts requiring periodic lubrication, spark plug, fuel injector, turbocharger, timing belt, and exhaust after-treatment servicing. Even in countries with high electric-vehicle sales shares, the slow turnover of the on-road vehicle parc means that legacy gasoline and diesel cars dominate the 6-to-15-year-old age bracket that visits aftermarket repair bays most heavily. Over the second half of the forecast decade, however, gradual ICE fleet retirements in Western Europe and East Asia will moderate baseline oil-change volume growth.
- Strong aftermarket repair intensity across aging vehicle fleets places Internal Combustion Engine (ICE) Vehicles on course to hold an estimated 76.0% share of the propulsion type category in 2026.
- Official vehicle registration statistics released by Statistics Canada in September 2026 confirm that gasoline-powered light-duty vehicles accounted for 90.8% of all 25.3 million active light-duty vehicle registrations in Canada in 2025 while hybrid-electric and battery-electric vehicles reached 772,562 and 623,481 units [9].
What gives Individual Retail Vehicle Owners the leading position in customer and billing type?
Individual Retail Vehicle Owners command 66.0% of customer and billing type share in 2026, anchored by out-of-pocket post-warranty maintenance and mechanical repairs.
Individual Retail Vehicle Owners represent the largest billing category in automotive repair and maintenance since private households own the vast majority of active passenger vehicles and pay retail labor rates and parts markups once factory warranties expire. Service chains build recurring retail loyalty through digital maintenance reminders, subscription motoring clubs, and bundled inspection and tire packages. To show how workshop chains balance retail and fleet revenue, Halfords Group reported in its June 2026 full-year FY26 results that its Autocentres division grew revenue to GBP 739.7 million with 5.8% like-for-like growth across 496 consumer garages, 92 commercial fleet locations, and 250 mobile vans [10]. Even so, retail drivers occasionally defer non-urgent cosmetic or preventative repairs during periods of household inflation.
- Individual Retail Vehicle Owners are predicted to secure 66.0% of customer and billing type demand in 2026, anchored by out-of-pocket mechanical, tire, and routine service expenditure across private vehicles.
- Commercial and Corporate Fleet Contracts and Insurance Direct-Repair Programs are anticipated to expand faster than retail cash billing through 2036 as businesses outsource fleet uptime compliance to national service networks.
What are the drivers, restraints, and opportunities in the automotive repair & maintenance services market?
In the automotive repair & maintenance services market, aging vehicle parcs and mandatory post-collision ADAS sensor recalibrations are projected to drive revenue expansion whereas certified diagnostic technician shortages and encrypted OEM telematics restrain independent workshops and mobile service vans and EV battery health diagnostics unlock new growth.
- Driver: Aging global vehicle parcs and mandatory post-collision ADAS camera, radar, and LiDAR recalibrations increase both repair frequency and average ticket value.
- Restraint: Acute shortages of certified diagnostic and high-voltage EV technicians combine with restricted access to encrypted OEM telematics data to constrain independent shop throughput.
- Opportunity: Mobile on-site service vans, predictive telematics maintenance contracts, and dedicated hybrid and EV battery health conditioning bays open high-margin fleet and retail revenue.
Growth Analysis and Future Potential: Qualitative Demand Catalysts
Prolonged vehicle ownership cycles combined with the rapid proliferation of forward-facing cameras, bumper radar sensors, and lane-keeping actuators are structurally raising revenue per workshop visit across global repair networks. Whenever a late-model passenger car undergoes a minor front-end collision repair, strut replacement, or windshield swap via ADAS-compatible windshield replacement services, technicians must perform static and dynamic optical sensor recalibrations to restore safety system functionality and satisfy insurer liability rules. Corporate operational disclosures from Belron International in May 2026 substantiate this trend, detailing how the group completed 17.1 million vehicle glass repair, replacement, and ADAS recalibration jobs across 42 countries in 2025 while refreshing its global ADAS calibration equipment [11]. Consequently, workshops equipped with digital calibration bays capture substantially higher labor billing per repair order.
Risk Assessment of the Automotive Repair & Maintenance Services Market: Operational and Formulation Friction
Persistent shortages of master diagnostic technicians capable of troubleshooting multiplexed electrical architectures and high-voltage battery packs represent the primary operational bottleneck restraining bay capacity utilization across independent and franchised garages. Recruitment and retention of qualified mechanics requires rising wage packages and continuous training investments, while smaller neighborhood garages struggle to afford multi-brand OEM diagnostic subscriptions beyond basic mechanical and tire repair patch servicing. Empirical research published in MDPI Vehicles in July 2026 analyzing 8,500 real-world maintenance records across 67 automotive service centers between 2022 and 2025 confirmed that technician competency requirements have shifted sharply toward system-level electronic diagnostics, creating severe skill gaps across traditional workshops [12]. Unfilled technician benches directly cap weekly repair order volume.
Commercial Opportunity Analysis: Formulation Differentiation and Value-Add Formats
Service chains and dealership groups are creating new recurring revenue streams by launching mobile on-site maintenance vans, subscription preventative care memberships, and specialized hybrid and battery-electric state-of-health diagnostic packages. Rather than waiting for catastrophic roadside breakdowns, fleet managers and retail EV owners steadily subscribe to telematics-guided battery thermal conditioning, brake-fluid regeneration servicing, and bundled automated car washing services and detailing packages. Technical modeling published in the World Electric Vehicle Journal in May 2026 demonstrates that integrating short-horizon state-of-health forecasting and degradation warning algorithms into EV maintenance workflows enables workshops to schedule proactive module balancing and cooling repairs before battery failure occurs [13]. Providers offering certified EV battery health certificates for used-car resales capture high-margin diagnostic fees.
Automotive Repair & Maintenance Services Market by Country (2026 to 2036)
FMI country modeling indicates that India leads automotive repair and maintenance services expansion at a 6.7% CAGR through 2036, while Poland advances at 5.8%, Canada at 5.6%, the USA at 5.3%, Germany at 5.0%, France at 4.8%, Italy at 4.6%, and the UK at 4.5%. National variations reflect local passenger car parc age, mandatory roadworthiness inspection schedules, winter road-salt corrosion intensity, and organized multi-brand workshop consolidation.
Table 7: Country CAGR and Primary Growth Levers for the Automotive Repair & Maintenance Services Market (CAGR percentage and operational drivers), 2026 to 2036
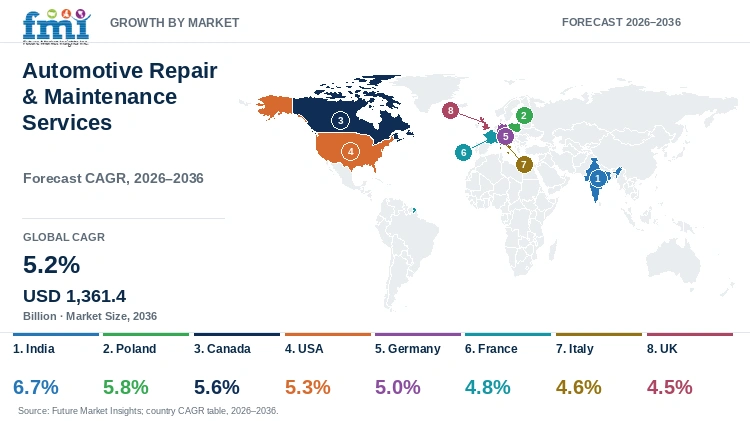
| Country | CAGR (2026 to 2036) | Primary Growth Lever |
|---|---|---|
| India | 6.7% | Expanding post-warranty SUV and passenger car parc and organized multi-brand workshop chains |
| Poland | 5.8% | High mechanical overhaul demand on imported 14+ year-old passenger cars and cross-border freight fleets |
| Canada | 5.6% | Winter road-salt corrosion repair, biannual tire changeovers, and 39.5% hybrid registration surge |
| USA | 5.3% | Record 12.8-year average vehicle age, 277.2B monthly vehicle miles traveled, and ADAS calibration rules |
| Germany | 5.0% | Strict biennial HU/TÜV inspections across 49M passenger cars and certified high-voltage EV service bays |
| France | 4.8% | Mandatory Contrôle Technique inspections and statutory circular-economy (PIEC) remanufactured part repairs |
| Italy | 4.6% | EU-leading density of 709 passenger cars per 1,000 inhabitants and urban mechanical and LPG servicing |
| UK | 4.5% | Annual MOT testing across 35M+ vehicles, suspension/alignment repairs, and mobile service van adoption |
Source: Future Market Insights analysis
India Automotive Repair & Maintenance Services Market Outlook (2026 to 2036)
Demand for automotive repair and maintenance services in India is projected to expand at a leading 6.7% CAGR between 2026 and 2036 as millions of passenger cars and utility vehicles sold during the post-2021 mobility boom age out of factory warranty coverage. What sets India apart from mature Western markets is the rapid formalization of vehicle servicing, where authorized OEM touchpoints and organized multi-brand workshop networks are steadily capturing repair traffic from unorganized roadside mechanics across Tier-2 and Tier-3 cities. Official Index of Industrial Production statistics published by the Press Information Bureau of the Government of India in October 2026 confirm this automotive parts and vehicle momentum, reporting that manufacture of motor vehicles, trailers, and auto components and spares grew 19.0% year-over-year in September 2026 [14]. Wider adoption of turbo-petrol, CNG, and compact SUV models further lifts average mechanical and air-conditioning service ticket values.
Key takeaway: In India, an expanding post-warranty SUV and passenger car parc and organized workshop network expansion are projected to drive a leading 6.7% CAGR through 2036.
Poland Automotive Repair & Maintenance Services Market Outlook (2026 to 2036)
In Poland, market growth is anticipated to reach a 5.8% CAGR over the 2026 to 2036 forecast period, driven by Central Europe's largest cross-border logistics fleet and a high volume of imported used passenger cars from Western Europe. Compared with Western European countries where new-car leasing dominates, Polish households and small businesses operate passenger vehicles with an average age exceeding 14 years, generating intensive demand for timing-belt, clutch, turbocharger, suspension, and corrosion repairs. Academic fleet reliability research published in MDPI Systems in June 2026 examining European automotive after-sales and maintenance services confirmed that structured preventative maintenance networks directly govern fleet uptime and parts replacement velocity across aging European vehicle parcs [15]. Independent Polish garages affiliated with distributor-backed workshop networks such as LKQ and Bosch Car Service capture the bulk of these mechanical overhauls.
Key takeaway: In Poland, heavy mechanical repair demand across imported used passenger cars and trans-European commercial freight fleets is anticipated to support a 5.8% CAGR.
Canada Automotive Repair & Maintenance Services Market Outlook (2026 to 2036)
Canadian automotive repair and maintenance services revenue is forecast to advance at a 5.6% CAGR through 2036, supported by severe winter freeze-thaw driving conditions, mandatory biannual tire changeovers, and rising hybrid and electric vehicle service complexity. Unlike warm-climate automotive markets, Canadian workshops derive substantial recurring revenue from underbody road-salt rust remediation, brake-caliper seizure repairs, cold-cranking battery replacements, and stone-chip windshield recalibrations. Official figures released by Statistics Canada in September 2026 reported that Canadians registered 547,673 new motor vehicles in the second quarter of 2026, the highest quarterly volume since 2019, led by a 39.5% surge in hybrid-electric vehicles and a 37.4% rise in battery-electric vehicles [16]. That growing hybrid and EV cohort requires specialized dual-powertrain and high-voltage bay servicing across Ontario, Quebec, and British Columbia.
Key takeaway: In Canada, harsh winter corrosion and tire changeover cycles combined with surging hybrid and EV registrations are forecast to sustain a 5.6% CAGR.
USA Automotive Repair & Maintenance Services Market Outlook (2026 to 2036)
Commercial automotive repair and maintenance services valuation in the USA is estimated to progress at a 5.3% CAGR between 2026 and 2036, anchored by a record average light-vehicle age approaching 12.8 years and high annual highway commuter mileage. American aftermarket demand is characterized by rapid private-equity and corporate roll-ups of quick-lube, collision, and tire chains and dealer mobile service van dispatches. Federal vehicle safety rulemaking further elevates electronic diagnostic complexity in American bays, as documented in the February 2026 National Highway Traffic Safety Administration Report to Congress detailing camera-based driver monitoring and impaired-driving prevention technology across 227 billion annual US driving trips [17]. National chains including Driven Brands, Valvoline, Monro, Bridgestone Firestone, and AutoNation are expanding multi-bay service centers across Sunbelt suburban growth corridors.
Key takeaway: In the USA, record vehicle fleet age, high commuter mileage, and ADAS electronic safety mandates are estimated to drive a 5.3% CAGR through 2036.
Germany Automotive Repair & Maintenance Services Market Outlook (2026 to 2036)
Automotive repair and maintenance expenditure in Germany is projected to grow at a 5.0% CAGR from 2026 to 2036, supported by strict biennial Hauptuntersuchung (HU) roadworthiness inspections and Europe's largest domestic fleet of passenger cars and electrified vehicles. German vehicle owners and corporate company-car fleets adhere strictly to manufacturer service schedules and TÜV/DEKRA safety standards, generating high average invoice values for precision brake, adaptive damping, matrix-LED lighting, and high-voltage battery servicing. Official European passenger car fleet statistics published by Eurostat in July 2026 confirmed that Germany holds the largest registered passenger car fleet in the European Union at more than 49 million cars, with 15.5% of passenger cars aged under two years and 13% powered by hybrid or battery-electric powertrains [18]. Franchised OEM dealerships and Bosch Car Service workshops lead German high-voltage and ADAS bay investments.
Key takeaway: In Germany, rigorous biennial roadworthiness inspections across 49 million passenger cars and rapid EV fleet integration are projected to maintain a 5.0% CAGR.
France Automotive Repair & Maintenance Services Market Outlook (2026 to 2036)
In France, automotive repair and maintenance services demand is slated to expand at a 4.8% CAGR over the 2026 to 2036 horizon, supported by mandatory Contrôle Technique emission and safety inspections and national circular-economy repair regulations. What distinguishes France from other European repair markets is its statutory mandate requiring workshops to offer customers certified remanufactured or recycled circular-economy automotive parts and new OEM components during mechanical and collision repairs. To expand multi-brand collision and mechanical coverage across France and Europe, Stellantis launched its Eurorepar Car Service All-makes Bodyshop label in September 2026 across its 6,200-workshop network, integrating Mopar Original Parts, Eurorepar, and SUSTAINera remanufactured parts [19]. Fast-fit and multi-brand networks including Euromaster, Eurorepar Car Service, Midas, and Norauto anchor French urban and peri-urban servicing.
Key takeaway: In France, deferred new-car replacement, mandatory Contrôle Technique inspections, and circular-economy part repairs are slated to support a 4.8% CAGR.
Italy Automotive Repair & Maintenance Services Market Outlook (2026 to 2036)
Sales of motor vehicle repair and maintenance services in Italy are anticipated to advance at a 4.6% CAGR between 2026 and 2036, driven by the highest passenger-car motorization density in the European Union and an aging national vehicle fleet. Italian households rely heavily on private automobiles across both metropolitan rings and regional towns, resulting in intensive urban clutch, brake, suspension, and collision repair demand. Official transport and mobility statistics published by the Italian National Institute of Statistics (Istat) in July 2026 confirmed that Italy holds 709 passenger cars per 1,000 inhabitants and recorded over 86 billion motorway vehicle-kilometres in 2025 (up 1.9% year-over-year) and 177,207 road traffic accidents (+2.2%) even as new car registrations contracted 2.6% [20]. Mandatory biennial Revisione Ministeriale vehicle inspections across Lombardy, Veneto, Lazio, and Emilia-Romagna sustain steady utilization for authorized OEM dealers and multi-brand partner garages.
Key takeaway: In Italy, the European Union's highest passenger car density (709 cars per 1,000 inhabitants) and aging urban fleets are anticipated to drive a 4.6% CAGR.
UK Automotive Repair & Maintenance Services Market Outlook (2026 to 2036)
UK automotive repair and maintenance services expenditure is predicted to rise at a 4.5% CAGR from 2026 to 2036 across franchised dealerships, fast-fit autocentre chains, and mobile service fleets. British workshop demand is structured around the mandatory annual Ministry of Transport (MOT) roadworthiness test for all vehicles over three years old and high volumes of coil-spring, shock-absorber, tire, and wheel-alignment repairs caused by weathered urban road surfaces. On October 14, 2026, the UK Driver and Vehicle Standards Agency (DVSA) issued updated MOT inspection manual rules covering Class 7 zero-emission commercial vans between 3,501 and 4,250 kilograms and ECE-approved LED replacement headlamps across British testing stations [21]. Major UK operators such as Halfords Autocentres, Kwik Fit, and Belron's Autoglass are rapidly scaling mobile driveway service vans to serve time-pressed commuters and commercial delivery vans.
Key takeaway: In the UK, annual MOT inspection compliance and pothole-related suspension, tire, and alignment repairs are predicted to sustain a 4.5% CAGR.
Full report country CAGRs cover: North America; Latin America; Western Europe; Eastern Europe; East Asia; South Asia and Pacific; Middle East and Africa.
Who are the notable companies in the automotive repair & maintenance services market?
Driven Brands Holdings Inc., Bridgestone Corporation, Monro, Inc., Valvoline Inc., AutoNation, Inc., Compagnie Générale des Établissements Michelin SCA (Euromaster), Mavis Tire Express Services Corp. (Midas International), Robert Bosch GmbH (Bosch Car Service), Belron International Ltd., and Halfords Group plc are the notable companies in the automotive repair & maintenance services market.
Competitive structure across the automotive repair and maintenance services landscape divides into multi-brand aftermarket service and collision consolidators, franchised dealership service groups and global workshop networks, and specialized glazing, ADAS calibration, and fleet maintenance operators. Driven Brands Holdings, Bridgestone Corporation, Monro, and Valvoline operate thousands of company-owned and franchised quick-lube, tire, mechanical, and collision bays. AutoNation, Michelin's Euromaster, Mavis Tire Express Services (Midas International), and Robert Bosch GmbH (Bosch Car Service) anchor dealer and multi-brand workshop networks, whereas Belron International and Halfords Group lead specialized ADAS glazing and UK autocentre operations.
- Multi-Brand Aftermarket Service and Collision Consolidators: Driven Brands Holdings, Bridgestone Corporation, Monro, and Valvoline scale high-throughput quick-lube, tire, brake, and collision repair chains across North America and international markets.
- Franchised Dealership Networks and Global Multi-Brand Workshop Chains: AutoNation, Compagnie Générale des Établissements Michelin SCA (Euromaster), Mavis Tire Express Services (Midas International), and Robert Bosch GmbH (Bosch Car Service) provide OEM-grade diagnostics and mechanical servicing.
- Specialized ADAS Calibration, Glazing, and Fleet Service Leaders: Belron International and Halfords Group operate high-density fixed and mobile recalibration, tire, and mechanical maintenance networks across Europe and North America.
Competitive Benchmarking: Automotive Repair & Maintenance Services Market
Table 8: Competitive Benchmarking for the Automotive Repair & Maintenance Services Market (qualitative capability ratings), 2026
| Company | ADAS & EV Diagnostic Readiness | Fleet & Insurer Direct-Repair Integration | Network Scale & Mobile Service Reach | Geographic Reach |
|---|---|---|---|---|
| Driven Brands Holdings Inc. | High | High | High | North America and international across Take 5 Oil Change, Meineke, Maaco, and CARSTAR collision centers |
| Bridgestone Corporation | High | High | High | Global service network with 2,200+ Firestone Complete Auto Care stores in US and First Stop in Europe |
| Monro, Inc. | Medium | Medium | High | Over 1,250 company-operated auto service and tire centers across 32 US states |
| Valvoline Inc. | Medium | High | High | Over 2,000 Valvoline Instant Oil Change and Great Canadian Oil Change stores across US and Canada |
| AutoNation, Inc. | High | High | High | Hundreds of franchised OEM dealership service departments and AutoNation Mobile Service across the US |
| Michelin SCA (Euromaster) | High | High | High | Over 2,500 Euromaster light and commercial vehicle service and mobile centers across 18 European countries |
| Mavis Tire Express Services Corp. (Midas) | Medium | Medium | High | 3,500+ combined Mavis, Midas, Express Oil Change, and Tire Kingdom locations across North America |
| Robert Bosch GmbH (Bosch Car Service) | High | High | High | Global multi-brand franchise network of 13,000+ diagnostic and EV-capable workshops in 150 countries |
| Belron International Ltd. | High | High | High | Global vehicle glass and ADAS recalibration leader (Safelite in US, Carglass in Europe, Autoglass in UK) |
| Halfords Group plc | High | High | High | UK leader operating 600+ Halfords Autocentres, National Tyres, Lodge Tyre commercial hubs, and mobile vans |
Evaluation basis: ADAS & EV Diagnostic Readiness evaluates documented workshop deployment of optical sensor calibration rigs, OEM scan tools, and insulated high-voltage EV service bays, whereas Fleet & Insurer Direct-Repair Integration rates commercial fleet account management and insurance direct-repair-program (DRP) connectivity. Network Scale & Mobile Service Reach measures total service bay footprint and on-site mobile van capabilities.
Key Developments in the Automotive Repair & Maintenance Services Market
- Bridgestone Americas unveiled a new USD 3 million Bandag retread and commercial truck maintenance training center in Akron, Ohio on October 29, 2026 to train hundreds of commercial fleet service technicians annually in advanced tire and casing maintenance [22].
- Driven Brands Holdings announced a realigned segment reporting structure on February 9, 2026 centered on its fast-growing Take 5 Oil Change quick-lube network and its franchise collision and maintenance brands (Meineke, Maaco, and CARSTAR) [23].
- TBC Corporation completed the strategic divestiture of the Midas automotive service franchise network (comprising more than 1,900 franchised and licensed shops across the US, Canada, and international markets) to Mavis Tire Express Services on June 16, 2025, creating a combined North American tire and mechanical service platform exceeding 3,500 locations [24].
Key Players in the Automotive Repair & Maintenance Services Market
Multi-Brand Aftermarket Service and Collision Consolidators
- Driven Brands Holdings
- Bridgestone Corporation
- Monro
- Valvoline
Franchised Dealership Networks and Global Multi-Brand Workshop Chains
- AutoNation
- Compagnie Générale des Établissements Michelin SCA (Euromaster)
- Mavis Tire Express Services (Midas International)
- Robert Bosch GmbH (Bosch Car Service)
Specialized ADAS Calibration, Glazing, and Fleet Service Leaders
- Belron International
- Halfords Group
Automotive Repair & Maintenance Services Market - Report Scope
Table 9: Report Scope for the Automotive Repair & Maintenance Services Market (coverage fields and definitions), 2026 to 2036
| Coverage field | Report scope |
|---|---|
| Market breakdown | Service Category; Service Provider Channel; Vehicle Class; Propulsion Type; Customer & Billing Type |
| Quantitative Units | USD Billion |
| Market Definition | Includes commercial workshop labor billings and installed replacement-part revenues generated from mechanical engine/transmission/brake/suspension repairs, collision bodywork and paint restoration, scheduled preventative maintenance (oil, filters, tires, wheel alignment), and electrical/ADAS sensor calibration and battery diagnostics across light, commercial, and two-wheeled motor vehicles. Category Scope Note: Excludes factory OEM assembly-line warranty manufacturing, standalone do-it-yourself (DIY) retail auto parts counter sales where no professional labor is performed, and retail motor fuel dispensing. |
| Regions Covered | North America; Latin America; Western Europe; Eastern Europe; East Asia; South Asia and Pacific; Middle East and Africa |
| Countries Covered | India, Poland, Canada, USA, Germany, France, Italy, UK, and additional countries in the full report |
| Key Companies Covered | Driven Brands Holdings Inc., Bridgestone Corporation, Monro, Inc., Valvoline Inc., AutoNation, Inc., Compagnie Générale des Établissements Michelin SCA (Euromaster), Mavis Tire Express Services Corp. (Midas International), Robert Bosch GmbH (Bosch Car Service), Belron International Ltd., Halfords Group plc |
| Forecast Period | 2026 to 2036 |
| Approach | Primary and secondary research with top-down household/fleet expenditure and bottom-up vehicle-parc repair-order triangulation. |
Automotive Repair & Maintenance Services Market - Research Methodology
Table 10: Research Methodology for the Automotive Repair & Maintenance Services Market (research methods and approach), 2026 edition
| Method | Approach |
|---|---|
| Primary Research | Analysis of U.S. Bureau of Transportation Statistics (BTS) CPI data, U.S. Census Bureau construction and retail trade series, U.S. BLS technician employment tables, Eurostat and Istat European vehicle parc registries, Statistics Canada registration releases, and corporate 10-K/RNS filings. |
| Secondary Research | Analysis of U.S. Bureau of Transportation Statistics (BTS) CPI data, U.S. Census Bureau construction and retail trade series, U.S. BLS technician employment tables, Eurostat and Destatis European vehicle parc registries, Statistics Canada registration releases, and corporate 10-K/RNS filings. |
| Market Sizing and Forecasting | Top-down national motor vehicle maintenance and repair expenditure baselines reconciled against bottom-up active vehicle parc cohorts (1.51B to 1.56B vehicles in 2026), annual workshop visit frequency, and average billed ticket sizes from 2026 to 2036. |
| Country Forecasting Model | Econometric national models weight average passenger car age, annual vehicle kilometers/miles traveled, statutory inspection regimes (MOT, HU/TÜV, Contrôle Technique), and ADAS/EV parc penetration across eight key national markets. |
| Operational Benchmark Traceability | Workshop wage, construction spending, fleet electrification, and inflation indicators in Tables 2, 3, and 4 trace to U.S. BLS, U.S. Census Bureau, U.S. BTS, and Eurostat official statistical publications. |
| Data Triangulation and Validation | Revenue estimates isolate professional paid repair and maintenance services (labor plus shop-installed parts) while strictly excluding DIY retail counter parts sales, wholesale distributor inter-company transfers, and motor fuel sales. |
Automotive Repair & Maintenance Services Market by Segments
Automotive Repair & Maintenance Services Market segmented by Service Category:
- Mechanical Repair (Engine, Transmission, Steering, and Brakes)
- Collision Bodywork Paint and Dent Repair
- Routine Maintenance (Oil Change, Filters, Tires, and Alignment)
- Electrical and Electronic ADAS Sensor Calibration & Battery Diagnostics
Automotive Repair & Maintenance Services Market segmented by Service Provider Channel:
- Franchised Dealership OEM Service Centers (4S)
- Independent Multi-Brand Repair Garages and Workshops
- Tire and Fast-Lube Chains
- Mobile On-Site Mechanics & Fleet Maintenance Hubs
Automotive Repair & Maintenance Services Market segmented by Vehicle Class:
- Passenger Cars and SUVs
- Light Commercial Vans and Pickups
- Heavy Commercial Trucks and Buses
- Two-Wheelers & Urban Micro-Mobility Vehicles
- Municipal & Off-Highway Service Fleet Vehicles
Automotive Repair & Maintenance Services Market segmented by Propulsion Type:
- Internal Combustion Engine (ICE) Vehicles
- Hybrid Electric Vehicles (HEV and PHEV)
- Battery Electric Vehicles (BEV)
- Alternative Fuel (CNG, LPG, and Commercial Diesel) Vehicles
Automotive Repair & Maintenance Services Market segmented by Customer & Billing Type:
- Individual Retail Vehicle Owners
- Commercial and Corporate Fleet Contracts
- Insurance and Extended Warranty Direct-Repair Programs
- Vehicle Leasing & Subscription Operators
Automotive Repair & Maintenance Services Market by Region
- North America
- United States
- Canada
- Latin America
- Brazil
- Mexico
- Argentina
- Chile
- Western Europe
- Germany
- France
- United Kingdom
- Italy
- Spain
- Benelux
- Nordics
- Eastern Europe
- Poland
- Czech Republic
- Romania
- Hungary
- East Asia
- China
- Japan
- South Korea
- South Asia and Pacific
- India
- ASEAN
- Australia and New Zealand
- Middle East and Africa
- GCC Countries
- South Africa
- Türkiye
- Israel
Research Sources and Bibliography
- [1] U.S. Bureau of Transportation Statistics. (2026, February 13). Transportation Consumer Price Index - January 2026. U.S. Department of Transportation BTS Newsroom.
- [2] Valvoline Inc. (2026, August 5). Valvoline Inc. Reports Third Quarter Results. Valvoline Investor Relations News Releases.
- [3] U.S. Census Bureau. (2026, October 14). Automotive Statistics: Consumer Spending. U.S. Department of Commerce Economic Indicators.
- [4] U.S. Bureau of Labor Statistics. (2026, September 14). Automotive Service Technicians and Mechanics : Occupational Outlook Handbook. U.S. Department of Labor BLS.
- [5] Eurostat. (2026, July 31). New battery-only electric cars up 30% in 2025. European Commission Eurostat News Articles.
- [6] Federal Highway Administration. (2026, March 9). Traffic Volume Trends - January 2026. U.S. Department of Transportation ROSA P Repository.
- [7] AutoNation, Inc. (2026, July 31). AutoNation Reports Second Quarter 2026 Results. AutoNation Investor Relations Press Releases.
- [8] Eurostat. (2026, July 31). Passenger cars in the EU Statistics Explained. European Commission Statistics Explained PDF.
- [9] Statistics Canada. (2026, September 22). The Daily - Vehicle registrations, 2025. Government of Canada Official Statistical Release.
- [10] Halfords Group plc. (2026, June 25). Halfords Group plc Preliminary results for the 53-week period ended 3 April 2026. Halfords Corporate Regulatory News Service Filing.
- [11] Belron International Ltd. (2026, May 15). Belron Group Responsible Business Report 2025. Belron Corporate Sustainability Publications.
- [12] Vehicles (MDPI). (2026, July 20). A Sustainable Competency Assessment Framework for Automotive Maintenance Technicians: Integrating Maintenance Record Analysis and Expert Consensus. MDPI Vehicles Open-Access Journal, 8(7), 166.
- [13] World Electric Vehicle Journal (MDPI). (2026, May 28). Integrated Predictive-Maintenance Framework for EV Batteries Using Short-Horizon SoH Forecasting, Degradation Warning, and Acceleration Risk Detection. MDPI World Electric Vehicle Journal, 17(6), 286.
- [14] Press Information Bureau, Government of India. (2026, October 28). Quick Estimates of Index of Industrial Production and Use- Based Index for the Month of September 2026 (Base 2022-23=100). Ministry of Statistics and Programme Implementation PIB.
- [15] Systems (MDPI). (2026, June 4). After-Sales and Maintenance Services: The Hidden Pillar Behind a Successful Electric Vehicle Deployment-A Systematic Literature Review. MDPI Systems Open-Access Journal, 14(6), 642.
- [16] Statistics Canada. (2026, September 8). The Daily - New motor vehicle registrations, second quarter 2026. Government of Canada Official Statistical Release.
- [17] National Highway Traffic Safety Administration. (2026, February 20). Advanced Impaired Driving Prevention Technology: Report to Congress. U.S. Department of Transportation NHTSA Docket.
- [18] Eurostat. (2026, July 31). Passenger cars in the EU - Statistics Explained. European Commission Eurostat Statistics Explained.
- [19] Stellantis N.V. (2026, September 8). Stellantis launches the Eurorepar Car Service All-makes Bodyshop Label. Stellantis Corporate Media Press Releases.
- [20] Italian National Institute of Statistics (Istat). (2026, July 24). Road accidents - 2025. Istat Official Statistical Press Releases.
- [21] UK Driver and Vehicle Standards Agency (DVSA). (2026, October 14). Updates: MOT inspection manual: cars and passenger vehicles. GOV.UK Official Guidance.
- [22] Bridgestone Americas, Inc. (2026, October 29). Bridgestone Unveils New $3 Million Bandag Training Center. Bridgestone Americas Newsroom.
- [23] Driven Brands Holdings Inc. (2026, February 9). Driven Brands Announces New Segment Reporting. Driven Brands Investor Relations News.
- [24] TBC Corporation. (2025, June 16). TBC Corporation Completes Divestiture of Midas to Mavis. TBC Corporation Corporate Newsroom.
This bibliography is provided for reader reference and is not exhaustive. The full report contains the complete reference list and detailed citations.
This Report Answers
- How large is the automotive repair and maintenance services market in 2026 and what is forecast for 2036?
- How do aging vehicle parcs and ADAS sensor recalibration rules drive workshop revenue?
- Why does Mechanical Repair lead the service category globally?
- Why do Franchised Dealership OEM Service Centers (4S) lead the service provider channel?
- How do national growth rates compare across India, Poland, Canada, the USA, Germany, France, Italy, and the UK?
- Which leading companies operate multi-brand quick-lube and collision chains versus OEM dealer and ADAS networks?
- How do diagnostic technician shortages and encrypted vehicle telematics restrain independent repair shops?
- What investments should workshop operators prioritize to capture hybrid, battery-electric, and commercial fleet service contracts?
Table of Content
Table of Content
- Key Takeaways
- Market Size and CAGR
- Top Growth Driver
- Fastest Growing Segment
- Leading Region
- Key Companies
- Emerging Opportunities
- Executive Summary
- Global Market Outlook
- Demand-side Trends
- Supply-side Trends
- Technology Roadmap Analysis
- Analysis and Recommendations
- Analyst Perspective (What is happening? Why now? What should investors know?)
- Key Questions Answered
- How large is the market?
- What is the CAGR?
- What are key trends?
- Which region dominates?
- Who are the leaders?
Read More...
- Market Overview
- Market Coverage / Taxonomy
- Market Definition / Scope / Limitations
- Research Methodology
- Chapter Orientation
- Analytical Lens and Working Hypotheses
- Market Structure, Signals, and Trend Drivers
- Benchmarking and Cross-market Comparability
- Market Sizing, Forecasting, and Opportunity Mapping
- Research Design and Evidence Framework
- Desk Research Programme (Secondary Evidence)
- Expert Input and Fieldwork (Primary Evidence)
- Tooling, Models, and Reference Databases
- Data Engineering and Model Build
- Quality Assurance and Audit Trail
- Market Background
- Market Dynamics (Drivers, Restraints, Opportunity, Trends)
- Scenario Forecast (Optimistic, Likely, Conservative)
- Impact Analysis
- AI Impact
- Sustainability Impact
- Regulatory Impact
- Technology Impact
- Consumer / Buyer Analysis
- Purchase Drivers
- Adoption Barriers
- Buyer Journey
- Opportunity Map Analysis
- Product Life Cycle Analysis
- Supply Chain Analysis
- Investment Feasibility Matrix
- Value Chain Analysis
- PESTLE and Porter's Analysis
- Regulatory Landscape
- Regional Parent Market Outlook
- Production and Consumption Statistics
- Import and Export Statistics
- Global Market Analysis and Forecast, 2021 to 2036
- Historical Market Size Value (USD Billion) Analysis, 2021 to 2025
- Current and Future Market Size Value (USD Billion) Projections, 2026 to 2036
- Y-o-Y Growth Trend Analysis
- Absolute $ Opportunity Analysis
- Global Market Pricing Analysis, 2021 to 2036
- Global Market Analysis and Forecast, By Service Category, 2021 to 2036
- Introduction / Key Findings
- Historical Market Size Value (USD Billion) Analysis By Service Category, 2021 to 2025
- Current and Future Market Size Value (USD Billion) Analysis and Forecast By Service Category, 2026 to 2036
- Mechanical Repair (Engine, Transmission, Steering, and Brakes)
- Collision Bodywork Paint and Dent Repair
- Routine Maintenance (Oil Change, Filters, Tires, and Alignment)
- Electrical and Electronic ADAS Sensor Calibration & Battery Diagnostics
- Y-o-Y Growth Trend Analysis By Service Category, 2021 to 2025
- Absolute $ Opportunity Analysis By Service Category, 2026 to 2036
- Global Market Analysis and Forecast, By Service Provider Channel, 2021 to 2036
- Introduction / Key Findings
- Historical Market Size Value (USD Billion) Analysis By Service Provider Channel, 2021 to 2025
- Current and Future Market Size Value (USD Billion) Analysis and Forecast By Service Provider Channel, 2026 to 2036
- Franchised Dealership OEM Service Centers (4S)
- Independent Multi-Brand Repair Garages and Workshops
- Tire and Fast-Lube Chains
- Mobile On-Site Mechanics & Fleet Maintenance Hubs
- Y-o-Y Growth Trend Analysis By Service Provider Channel, 2021 to 2025
- Absolute $ Opportunity Analysis By Service Provider Channel, 2026 to 2036
- Global Market Analysis and Forecast, By Vehicle Class, 2021 to 2036
- Introduction / Key Findings
- Historical Market Size Value (USD Billion) Analysis By Vehicle Class, 2021 to 2025
- Current and Future Market Size Value (USD Billion) Analysis and Forecast By Vehicle Class, 2026 to 2036
- Passenger Cars and SUVs
- Light Commercial Vans and Pickups
- Heavy Commercial Trucks and Buses
- Two-Wheelers & Urban Micro-Mobility Vehicles
- Municipal & Off-Highway Service Fleet Vehicles
- Y-o-Y Growth Trend Analysis By Vehicle Class, 2021 to 2025
- Absolute $ Opportunity Analysis By Vehicle Class, 2026 to 2036
- Global Market Analysis and Forecast, By Propulsion Type, 2021 to 2036
- Introduction / Key Findings
- Historical Market Size Value (USD Billion) Analysis By Propulsion Type, 2021 to 2025
- Current and Future Market Size Value (USD Billion) Analysis and Forecast By Propulsion Type, 2026 to 2036
- Internal Combustion Engine (ICE) Vehicles
- Hybrid Electric Vehicles (HEV and PHEV)
- Battery Electric Vehicles (BEV)
- Alternative Fuel (CNG, LPG, and Commercial Diesel) Vehicles
- Y-o-Y Growth Trend Analysis By Propulsion Type, 2021 to 2025
- Absolute $ Opportunity Analysis By Propulsion Type, 2026 to 2036
- Global Market Analysis and Forecast, By Customer & Billing Type, 2021 to 2036
- Introduction / Key Findings
- Historical Market Size Value (USD Billion) Analysis By Customer & Billing Type, 2021 to 2025
- Current and Future Market Size Value (USD Billion) Analysis and Forecast By Customer & Billing Type, 2026 to 2036
- Individual Retail Vehicle Owners
- Commercial and Corporate Fleet Contracts
- Insurance and Extended Warranty Direct-Repair Programs
- Vehicle Leasing & Subscription Operators
- Y-o-Y Growth Trend Analysis By Customer & Billing Type, 2021 to 2025
- Absolute $ Opportunity Analysis By Customer & Billing Type, 2026 to 2036
- Global Market Analysis and Forecast, By Region, 2021 to 2036
- Introduction
- Historical Market Size Value (USD Billion) Analysis By Region, 2021 to 2025
- Current Market Size Value (USD Billion) Analysis and Forecast By Region, 2026 to 2036
- North America
- Latin America
- Western Europe
- Eastern Europe
- East Asia
- South Asia and Pacific
- Middle East and Africa
- Market Attractiveness Analysis By Region
- North America Market Analysis and Forecast, By Country, 2021 to 2036
- Historical Market Size Value (USD Billion) Trend Analysis By Market Taxonomy, 2021 to 2025
- Market Size Value (USD Billion) Forecast By Market Taxonomy, 2026 to 2036
- By Country
- United States
- Canada
- By Service Category
- By Service Provider Channel
- By Vehicle Class
- By Propulsion Type
- By Customer & Billing Type
- By Country
- Market Attractiveness Analysis
- By Country
- By Service Category
- By Service Provider Channel
- By Vehicle Class
- By Propulsion Type
- By Customer & Billing Type
- Key Takeaways
- Latin America Market Analysis and Forecast, By Country
- Historical Market Size Value (USD Billion) Trend Analysis By Market Taxonomy, 2021 to 2025
- Market Size Value (USD Billion) Forecast By Market Taxonomy, 2026 to 2036
- By Country
- Brazil
- Mexico
- Argentina
- Chile
- By Service Category
- By Service Provider Channel
- By Vehicle Class
- By Propulsion Type
- By Customer & Billing Type
- By Country
- Market Attractiveness Analysis
- By Country
- By Service Category
- By Service Provider Channel
- By Vehicle Class
- By Propulsion Type
- By Customer & Billing Type
- Key Takeaways
- Western Europe Market Analysis and Forecast, By Country
- Historical Market Size Value (USD Billion) Trend Analysis By Market Taxonomy, 2021 to 2025
- Market Size Value (USD Billion) Forecast By Market Taxonomy, 2026 to 2036
- By Country
- Germany
- France
- United Kingdom
- Italy
- Spain
- Benelux
- Nordics
- By Service Category
- By Service Provider Channel
- By Vehicle Class
- By Propulsion Type
- By Customer & Billing Type
- By Country
- Market Attractiveness Analysis
- By Country
- By Service Category
- By Service Provider Channel
- By Vehicle Class
- By Propulsion Type
- By Customer & Billing Type
- Key Takeaways
- Eastern Europe Market Analysis and Forecast, By Country
- Historical Market Size Value (USD Billion) Trend Analysis By Market Taxonomy, 2021 to 2025
- Market Size Value (USD Billion) Forecast By Market Taxonomy, 2026 to 2036
- By Country
- Poland
- Czech Republic
- Romania
- Hungary
- By Service Category
- By Service Provider Channel
- By Vehicle Class
- By Propulsion Type
- By Customer & Billing Type
- By Country
- Market Attractiveness Analysis
- By Country
- By Service Category
- By Service Provider Channel
- By Vehicle Class
- By Propulsion Type
- By Customer & Billing Type
- Key Takeaways
- East Asia Market Analysis and Forecast, By Country
- Historical Market Size Value (USD Billion) Trend Analysis By Market Taxonomy, 2021 to 2025
- Market Size Value (USD Billion) Forecast By Market Taxonomy, 2026 to 2036
- By Country
- China
- Japan
- South Korea
- By Service Category
- By Service Provider Channel
- By Vehicle Class
- By Propulsion Type
- By Customer & Billing Type
- By Country
- Market Attractiveness Analysis
- By Country
- By Service Category
- By Service Provider Channel
- By Vehicle Class
- By Propulsion Type
- By Customer & Billing Type
- Key Takeaways
- South Asia and Pacific Market Analysis and Forecast, By Country
- Historical Market Size Value (USD Billion) Trend Analysis By Market Taxonomy, 2021 to 2025
- Market Size Value (USD Billion) Forecast By Market Taxonomy, 2026 to 2036
- By Country
- India
- ASEAN
- Australia and New Zealand
- By Service Category
- By Service Provider Channel
- By Vehicle Class
- By Propulsion Type
- By Customer & Billing Type
- By Country
- Market Attractiveness Analysis
- By Country
- By Service Category
- By Service Provider Channel
- By Vehicle Class
- By Propulsion Type
- By Customer & Billing Type
- Key Takeaways
- Middle East and Africa Market Analysis and Forecast, By Country
- Historical Market Size Value (USD Billion) Trend Analysis By Market Taxonomy, 2021 to 2025
- Market Size Value (USD Billion) Forecast By Market Taxonomy, 2026 to 2036
- By Country
- GCC Countries
- South Africa
- Türkiye
- Israel
- By Service Category
- By Service Provider Channel
- By Vehicle Class
- By Propulsion Type
- By Customer & Billing Type
- By Country
- Market Attractiveness Analysis
- By Country
- By Service Category
- By Service Provider Channel
- By Vehicle Class
- By Propulsion Type
- By Customer & Billing Type
- Key Takeaways
- Key Countries Market Analysis
- United States
- Pricing Analysis
- Market Share Analysis, 2025
- By Service Category
- By Service Provider Channel
- By Vehicle Class
- By Propulsion Type
- By Customer & Billing Type
- Canada
- Pricing Analysis
- Market Share Analysis, 2025
- By Service Category
- By Service Provider Channel
- By Vehicle Class
- By Propulsion Type
- By Customer & Billing Type
- Mexico
- Pricing Analysis
- Market Share Analysis, 2025
- By Service Category
- By Service Provider Channel
- By Vehicle Class
- By Propulsion Type
- By Customer & Billing Type
- Brazil
- Pricing Analysis
- Market Share Analysis, 2025
- By Service Category
- By Service Provider Channel
- By Vehicle Class
- By Propulsion Type
- By Customer & Billing Type
- Chile
- Pricing Analysis
- Market Share Analysis, 2025
- By Service Category
- By Service Provider Channel
- By Vehicle Class
- By Propulsion Type
- By Customer & Billing Type
- Germany
- Pricing Analysis
- Market Share Analysis, 2025
- By Service Category
- By Service Provider Channel
- By Vehicle Class
- By Propulsion Type
- By Customer & Billing Type
- United Kingdom
- Pricing Analysis
- Market Share Analysis, 2025
- By Service Category
- By Service Provider Channel
- By Vehicle Class
- By Propulsion Type
- By Customer & Billing Type
- Italy
- Pricing Analysis
- Market Share Analysis, 2025
- By Service Category
- By Service Provider Channel
- By Vehicle Class
- By Propulsion Type
- By Customer & Billing Type
- Spain
- Pricing Analysis
- Market Share Analysis, 2025
- By Service Category
- By Service Provider Channel
- By Vehicle Class
- By Propulsion Type
- By Customer & Billing Type
- France
- Pricing Analysis
- Market Share Analysis, 2025
- By Service Category
- By Service Provider Channel
- By Vehicle Class
- By Propulsion Type
- By Customer & Billing Type
- India
- Pricing Analysis
- Market Share Analysis, 2025
- By Service Category
- By Service Provider Channel
- By Vehicle Class
- By Propulsion Type
- By Customer & Billing Type
- ASEAN
- Pricing Analysis
- Market Share Analysis, 2025
- By Service Category
- By Service Provider Channel
- By Vehicle Class
- By Propulsion Type
- By Customer & Billing Type
- Australia and New Zealand
- Pricing Analysis
- Market Share Analysis, 2025
- By Service Category
- By Service Provider Channel
- By Vehicle Class
- By Propulsion Type
- By Customer & Billing Type
- China
- Pricing Analysis
- Market Share Analysis, 2025
- By Service Category
- By Service Provider Channel
- By Vehicle Class
- By Propulsion Type
- By Customer & Billing Type
- Japan
- Pricing Analysis
- Market Share Analysis, 2025
- By Service Category
- By Service Provider Channel
- By Vehicle Class
- By Propulsion Type
- By Customer & Billing Type
- South Korea
- Pricing Analysis
- Market Share Analysis, 2025
- By Service Category
- By Service Provider Channel
- By Vehicle Class
- By Propulsion Type
- By Customer & Billing Type
- Poland
- Pricing Analysis
- Market Share Analysis, 2025
- By Service Category
- By Service Provider Channel
- By Vehicle Class
- By Propulsion Type
- By Customer & Billing Type
- Hungary
- Pricing Analysis
- Market Share Analysis, 2025
- By Service Category
- By Service Provider Channel
- By Vehicle Class
- By Propulsion Type
- By Customer & Billing Type
- Türkiye
- Pricing Analysis
- Market Share Analysis, 2025
- By Service Category
- By Service Provider Channel
- By Vehicle Class
- By Propulsion Type
- By Customer & Billing Type
- South Africa
- Pricing Analysis
- Market Share Analysis, 2025
- By Service Category
- By Service Provider Channel
- By Vehicle Class
- By Propulsion Type
- By Customer & Billing Type
- United States
- Market Structure Analysis
- Competition Dashboard
- Competition Benchmarking
- Market Share Analysis of Top Players
- By Regional
- By Service Category
- By Service Provider Channel
- By Vehicle Class
- By Propulsion Type
- By Customer & Billing Type
- Emerging Startups
- Innovation Benchmarking
- Competition Analysis
- Competition Deep Dive
- Driven Brands Holdings Inc.
- Overview
- Product Portfolio
- Profitability by Market Segments
- Sales Footprint
- Strategy Overview
- Marketing Strategy
- Product Strategy
- Channel Strategy
- Bridgestone Corporation
- Monro, Inc.
- Valvoline Inc.
- AutoNation, Inc.
- Michelin SCA (Euromaster)
- Mavis Tire Express Services Corp. (Midas)
- Robert Bosch GmbH (Bosch Car Service)
- Belron International Ltd.
- Halfords Group plc
- Compagnie Générale des Établissements Michelin SCA (Euromaster)
- Mavis Tire Express Services (Midas International)
- Belron International
- Halfords Group
- Driven Brands Holdings Inc.
- Case Studies
- Success Stories
- Recent Developments
- Competition Deep Dive
- Assumptions & Acronyms Used
List of Tables
- Table 1: Global Market Value (USD Billion) Forecast by Region, 2021 to 2036
- Table 2: Global Market Value (USD Billion) Forecast by Service Category, 2021 to 2036
- Table 3: Global Market Value (USD Billion) Forecast by Service Provider Channel, 2021 to 2036
- Table 4: Global Market Value (USD Billion) Forecast by Vehicle Class, 2021 to 2036
- Table 5: Global Market Value (USD Billion) Forecast by Propulsion Type, 2021 to 2036
- Table 6: Global Market Value (USD Billion) Forecast by Customer & Billing Type, 2021 to 2036
- Table 7: North America Market Value (USD Billion) Forecast by Country, 2021 to 2036
- Table 8: North America Market Value (USD Billion) Forecast by Service Category, 2021 to 2036
- Table 9: North America Market Value (USD Billion) Forecast by Service Provider Channel, 2021 to 2036
- Table 10: North America Market Value (USD Billion) Forecast by Vehicle Class, 2021 to 2036
- Table 11: North America Market Value (USD Billion) Forecast by Propulsion Type, 2021 to 2036
- Table 12: North America Market Value (USD Billion) Forecast by Customer & Billing Type, 2021 to 2036
- Table 13: Latin America Market Value (USD Billion) Forecast by Country, 2021 to 2036
- Table 14: Latin America Market Value (USD Billion) Forecast by Service Category, 2021 to 2036
- Table 15: Latin America Market Value (USD Billion) Forecast by Service Provider Channel, 2021 to 2036
- Table 16: Latin America Market Value (USD Billion) Forecast by Vehicle Class, 2021 to 2036
- Table 17: Latin America Market Value (USD Billion) Forecast by Propulsion Type, 2021 to 2036
- Table 18: Latin America Market Value (USD Billion) Forecast by Customer & Billing Type, 2021 to 2036
- Table 19: Western Europe Market Value (USD Billion) Forecast by Country, 2021 to 2036
- Table 20: Western Europe Market Value (USD Billion) Forecast by Service Category, 2021 to 2036
- Table 21: Western Europe Market Value (USD Billion) Forecast by Service Provider Channel, 2021 to 2036
- Table 22: Western Europe Market Value (USD Billion) Forecast by Vehicle Class, 2021 to 2036
- Table 23: Western Europe Market Value (USD Billion) Forecast by Propulsion Type, 2021 to 2036
- Table 24: Western Europe Market Value (USD Billion) Forecast by Customer & Billing Type, 2021 to 2036
- Table 25: Eastern Europe Market Value (USD Billion) Forecast by Country, 2021 to 2036
- Table 26: Eastern Europe Market Value (USD Billion) Forecast by Service Category, 2021 to 2036
- Table 27: Eastern Europe Market Value (USD Billion) Forecast by Service Provider Channel, 2021 to 2036
- Table 28: Eastern Europe Market Value (USD Billion) Forecast by Vehicle Class, 2021 to 2036
- Table 29: Eastern Europe Market Value (USD Billion) Forecast by Propulsion Type, 2021 to 2036
- Table 30: Eastern Europe Market Value (USD Billion) Forecast by Customer & Billing Type, 2021 to 2036
- Table 31: East Asia Market Value (USD Billion) Forecast by Country, 2021 to 2036
- Table 32: East Asia Market Value (USD Billion) Forecast by Service Category, 2021 to 2036
- Table 33: East Asia Market Value (USD Billion) Forecast by Service Provider Channel, 2021 to 2036
- Table 34: East Asia Market Value (USD Billion) Forecast by Vehicle Class, 2021 to 2036
- Table 35: East Asia Market Value (USD Billion) Forecast by Propulsion Type, 2021 to 2036
- Table 36: East Asia Market Value (USD Billion) Forecast by Customer & Billing Type, 2021 to 2036
- Table 37: South Asia and Pacific Market Value (USD Billion) Forecast by Country, 2021 to 2036
- Table 38: South Asia and Pacific Market Value (USD Billion) Forecast by Service Category, 2021 to 2036
- Table 39: South Asia and Pacific Market Value (USD Billion) Forecast by Service Provider Channel, 2021 to 2036
- Table 40: South Asia and Pacific Market Value (USD Billion) Forecast by Vehicle Class, 2021 to 2036
- Table 41: South Asia and Pacific Market Value (USD Billion) Forecast by Propulsion Type, 2021 to 2036
- Table 42: South Asia and Pacific Market Value (USD Billion) Forecast by Customer & Billing Type, 2021 to 2036
- Table 43: Middle East and Africa Market Value (USD Billion) Forecast by Country, 2021 to 2036
- Table 44: Middle East and Africa Market Value (USD Billion) Forecast by Service Category, 2021 to 2036
- Table 45: Middle East and Africa Market Value (USD Billion) Forecast by Service Provider Channel, 2021 to 2036
- Table 46: Middle East and Africa Market Value (USD Billion) Forecast by Vehicle Class, 2021 to 2036
- Table 47: Middle East and Africa Market Value (USD Billion) Forecast by Propulsion Type, 2021 to 2036
- Table 48: Middle East and Africa Market Value (USD Billion) Forecast by Customer & Billing Type, 2021 to 2036
List of Figures
- Figure 1: Global Market Pricing Analysis
- Figure 2: Global Market Value (USD Billion) Forecast 2021-2036
- Figure 3: Global Market Value Share and BPS Analysis by Service Category, 2026 and 2036
- Figure 4: Global Market Y-o-Y Growth Comparison by Service Category, 2026-2036
- Figure 5: Global Market Attractiveness Analysis by Service Category
- Figure 6: Global Market Value Share and BPS Analysis by Service Provider Channel, 2026 and 2036
- Figure 7: Global Market Y-o-Y Growth Comparison by Service Provider Channel, 2026-2036
- Figure 8: Global Market Attractiveness Analysis by Service Provider Channel
- Figure 9: Global Market Value Share and BPS Analysis by Vehicle Class, 2026 and 2036
- Figure 10: Global Market Y-o-Y Growth Comparison by Vehicle Class, 2026-2036
- Figure 11: Global Market Attractiveness Analysis by Vehicle Class
- Figure 12: Global Market Value Share and BPS Analysis by Propulsion Type, 2026 and 2036
- Figure 13: Global Market Y-o-Y Growth Comparison by Propulsion Type, 2026-2036
- Figure 14: Global Market Attractiveness Analysis by Propulsion Type
- Figure 15: Global Market Value Share and BPS Analysis by Customer & Billing Type, 2026 and 2036
- Figure 16: Global Market Y-o-Y Growth Comparison by Customer & Billing Type, 2026-2036
- Figure 17: Global Market Attractiveness Analysis by Customer & Billing Type
- Figure 18: Global Market Value (USD Billion) Share and BPS Analysis by Region, 2026 and 2036
- Figure 19: Global Market Y-o-Y Growth Comparison by Region, 2026-2036
- Figure 20: Global Market Attractiveness Analysis by Region
- Figure 21: North America Market Incremental Dollar Opportunity, 2026-2036
- Figure 22: Latin America Market Incremental Dollar Opportunity, 2026-2036
- Figure 23: Western Europe Market Incremental Dollar Opportunity, 2026-2036
- Figure 24: Eastern Europe Market Incremental Dollar Opportunity, 2026-2036
- Figure 25: East Asia Market Incremental Dollar Opportunity, 2026-2036
- Figure 26: South Asia and Pacific Market Incremental Dollar Opportunity, 2026-2036
- Figure 27: Middle East and Africa Market Incremental Dollar Opportunity, 2026-2036
- Figure 28: North America Market Value Share and BPS Analysis by Country, 2026 and 2036
- Figure 29: North America Market Value Share and BPS Analysis by Service Category, 2026 and 2036
- Figure 30: North America Market Y-o-Y Growth Comparison by Service Category, 2026-2036
- Figure 31: North America Market Attractiveness Analysis by Service Category
- Figure 32: North America Market Value Share and BPS Analysis by Service Provider Channel, 2026 and 2036
- Figure 33: North America Market Y-o-Y Growth Comparison by Service Provider Channel, 2026-2036
- Figure 34: North America Market Attractiveness Analysis by Service Provider Channel
- Figure 35: North America Market Value Share and BPS Analysis by Vehicle Class, 2026 and 2036
- Figure 36: North America Market Y-o-Y Growth Comparison by Vehicle Class, 2026-2036
- Figure 37: North America Market Attractiveness Analysis by Vehicle Class
- Figure 38: North America Market Value Share and BPS Analysis by Propulsion Type, 2026 and 2036
- Figure 39: North America Market Y-o-Y Growth Comparison by Propulsion Type, 2026-2036
- Figure 40: North America Market Attractiveness Analysis by Propulsion Type
- Figure 41: North America Market Value Share and BPS Analysis by Customer & Billing Type, 2026 and 2036
- Figure 42: North America Market Y-o-Y Growth Comparison by Customer & Billing Type, 2026-2036
- Figure 43: North America Market Attractiveness Analysis by Customer & Billing Type
- Figure 44: Latin America Market Value Share and BPS Analysis by Country, 2026 and 2036
- Figure 45: Latin America Market Value Share and BPS Analysis by Service Category, 2026 and 2036
- Figure 46: Latin America Market Y-o-Y Growth Comparison by Service Category, 2026-2036
- Figure 47: Latin America Market Attractiveness Analysis by Service Category
- Figure 48: Latin America Market Value Share and BPS Analysis by Service Provider Channel, 2026 and 2036
- Figure 49: Latin America Market Y-o-Y Growth Comparison by Service Provider Channel, 2026-2036
- Figure 50: Latin America Market Attractiveness Analysis by Service Provider Channel
- Figure 51: Latin America Market Value Share and BPS Analysis by Vehicle Class, 2026 and 2036
- Figure 52: Latin America Market Y-o-Y Growth Comparison by Vehicle Class, 2026-2036
- Figure 53: Latin America Market Attractiveness Analysis by Vehicle Class
- Figure 54: Latin America Market Value Share and BPS Analysis by Propulsion Type, 2026 and 2036
- Figure 55: Latin America Market Y-o-Y Growth Comparison by Propulsion Type, 2026-2036
- Figure 56: Latin America Market Attractiveness Analysis by Propulsion Type
- Figure 57: Latin America Market Value Share and BPS Analysis by Customer & Billing Type, 2026 and 2036
- Figure 58: Latin America Market Y-o-Y Growth Comparison by Customer & Billing Type, 2026-2036
- Figure 59: Latin America Market Attractiveness Analysis by Customer & Billing Type
- Figure 60: Western Europe Market Value Share and BPS Analysis by Country, 2026 and 2036
- Figure 61: Western Europe Market Value Share and BPS Analysis by Service Category, 2026 and 2036
- Figure 62: Western Europe Market Y-o-Y Growth Comparison by Service Category, 2026-2036
- Figure 63: Western Europe Market Attractiveness Analysis by Service Category
- Figure 64: Western Europe Market Value Share and BPS Analysis by Service Provider Channel, 2026 and 2036
- Figure 65: Western Europe Market Y-o-Y Growth Comparison by Service Provider Channel, 2026-2036
- Figure 66: Western Europe Market Attractiveness Analysis by Service Provider Channel
- Figure 67: Western Europe Market Value Share and BPS Analysis by Vehicle Class, 2026 and 2036
- Figure 68: Western Europe Market Y-o-Y Growth Comparison by Vehicle Class, 2026-2036
- Figure 69: Western Europe Market Attractiveness Analysis by Vehicle Class
- Figure 70: Western Europe Market Value Share and BPS Analysis by Propulsion Type, 2026 and 2036
- Figure 71: Western Europe Market Y-o-Y Growth Comparison by Propulsion Type, 2026-2036
- Figure 72: Western Europe Market Attractiveness Analysis by Propulsion Type
- Figure 73: Western Europe Market Value Share and BPS Analysis by Customer & Billing Type, 2026 and 2036
- Figure 74: Western Europe Market Y-o-Y Growth Comparison by Customer & Billing Type, 2026-2036
- Figure 75: Western Europe Market Attractiveness Analysis by Customer & Billing Type
- Figure 76: Eastern Europe Market Value Share and BPS Analysis by Country, 2026 and 2036
- Figure 77: Eastern Europe Market Value Share and BPS Analysis by Service Category, 2026 and 2036
- Figure 78: Eastern Europe Market Y-o-Y Growth Comparison by Service Category, 2026-2036
- Figure 79: Eastern Europe Market Attractiveness Analysis by Service Category
- Figure 80: Eastern Europe Market Value Share and BPS Analysis by Service Provider Channel, 2026 and 2036
- Figure 81: Eastern Europe Market Y-o-Y Growth Comparison by Service Provider Channel, 2026-2036
- Figure 82: Eastern Europe Market Attractiveness Analysis by Service Provider Channel
- Figure 83: Eastern Europe Market Value Share and BPS Analysis by Vehicle Class, 2026 and 2036
- Figure 84: Eastern Europe Market Y-o-Y Growth Comparison by Vehicle Class, 2026-2036
- Figure 85: Eastern Europe Market Attractiveness Analysis by Vehicle Class
- Figure 86: Eastern Europe Market Value Share and BPS Analysis by Propulsion Type, 2026 and 2036
- Figure 87: Eastern Europe Market Y-o-Y Growth Comparison by Propulsion Type, 2026-2036
- Figure 88: Eastern Europe Market Attractiveness Analysis by Propulsion Type
- Figure 89: Eastern Europe Market Value Share and BPS Analysis by Customer & Billing Type, 2026 and 2036
- Figure 90: Eastern Europe Market Y-o-Y Growth Comparison by Customer & Billing Type, 2026-2036
- Figure 91: Eastern Europe Market Attractiveness Analysis by Customer & Billing Type
- Figure 92: East Asia Market Value Share and BPS Analysis by Country, 2026 and 2036
- Figure 93: East Asia Market Value Share and BPS Analysis by Service Category, 2026 and 2036
- Figure 94: East Asia Market Y-o-Y Growth Comparison by Service Category, 2026-2036
- Figure 95: East Asia Market Attractiveness Analysis by Service Category
- Figure 96: East Asia Market Value Share and BPS Analysis by Service Provider Channel, 2026 and 2036
- Figure 97: East Asia Market Y-o-Y Growth Comparison by Service Provider Channel, 2026-2036
- Figure 98: East Asia Market Attractiveness Analysis by Service Provider Channel
- Figure 99: East Asia Market Value Share and BPS Analysis by Vehicle Class, 2026 and 2036
- Figure 100: East Asia Market Y-o-Y Growth Comparison by Vehicle Class, 2026-2036
- Figure 101: East Asia Market Attractiveness Analysis by Vehicle Class
- Figure 102: East Asia Market Value Share and BPS Analysis by Propulsion Type, 2026 and 2036
- Figure 103: East Asia Market Y-o-Y Growth Comparison by Propulsion Type, 2026-2036
- Figure 104: East Asia Market Attractiveness Analysis by Propulsion Type
- Figure 105: East Asia Market Value Share and BPS Analysis by Customer & Billing Type, 2026 and 2036
- Figure 106: East Asia Market Y-o-Y Growth Comparison by Customer & Billing Type, 2026-2036
- Figure 107: East Asia Market Attractiveness Analysis by Customer & Billing Type
- Figure 108: South Asia and Pacific Market Value Share and BPS Analysis by Country, 2026 and 2036
- Figure 109: South Asia and Pacific Market Value Share and BPS Analysis by Service Category, 2026 and 2036
- Figure 110: South Asia and Pacific Market Y-o-Y Growth Comparison by Service Category, 2026-2036
- Figure 111: South Asia and Pacific Market Attractiveness Analysis by Service Category
- Figure 112: South Asia and Pacific Market Value Share and BPS Analysis by Service Provider Channel, 2026 and 2036
- Figure 113: South Asia and Pacific Market Y-o-Y Growth Comparison by Service Provider Channel, 2026-2036
- Figure 114: South Asia and Pacific Market Attractiveness Analysis by Service Provider Channel
- Figure 115: South Asia and Pacific Market Value Share and BPS Analysis by Vehicle Class, 2026 and 2036
- Figure 116: South Asia and Pacific Market Y-o-Y Growth Comparison by Vehicle Class, 2026-2036
- Figure 117: South Asia and Pacific Market Attractiveness Analysis by Vehicle Class
- Figure 118: South Asia and Pacific Market Value Share and BPS Analysis by Propulsion Type, 2026 and 2036
- Figure 119: South Asia and Pacific Market Y-o-Y Growth Comparison by Propulsion Type, 2026-2036
- Figure 120: South Asia and Pacific Market Attractiveness Analysis by Propulsion Type
- Figure 121: South Asia and Pacific Market Value Share and BPS Analysis by Customer & Billing Type, 2026 and 2036
- Figure 122: South Asia and Pacific Market Y-o-Y Growth Comparison by Customer & Billing Type, 2026-2036
- Figure 123: South Asia and Pacific Market Attractiveness Analysis by Customer & Billing Type
- Figure 124: Middle East and Africa Market Value Share and BPS Analysis by Country, 2026 and 2036
- Figure 125: Middle East and Africa Market Value Share and BPS Analysis by Service Category, 2026 and 2036
- Figure 126: Middle East and Africa Market Y-o-Y Growth Comparison by Service Category, 2026-2036
- Figure 127: Middle East and Africa Market Attractiveness Analysis by Service Category
- Figure 128: Middle East and Africa Market Value Share and BPS Analysis by Service Provider Channel, 2026 and 2036
- Figure 129: Middle East and Africa Market Y-o-Y Growth Comparison by Service Provider Channel, 2026-2036
- Figure 130: Middle East and Africa Market Attractiveness Analysis by Service Provider Channel
- Figure 131: Middle East and Africa Market Value Share and BPS Analysis by Vehicle Class, 2026 and 2036
- Figure 132: Middle East and Africa Market Y-o-Y Growth Comparison by Vehicle Class, 2026-2036
- Figure 133: Middle East and Africa Market Attractiveness Analysis by Vehicle Class
- Figure 134: Middle East and Africa Market Value Share and BPS Analysis by Propulsion Type, 2026 and 2036
- Figure 135: Middle East and Africa Market Y-o-Y Growth Comparison by Propulsion Type, 2026-2036
- Figure 136: Middle East and Africa Market Attractiveness Analysis by Propulsion Type
- Figure 137: Middle East and Africa Market Value Share and BPS Analysis by Customer & Billing Type, 2026 and 2036
- Figure 138: Middle East and Africa Market Y-o-Y Growth Comparison by Customer & Billing Type, 2026-2036
- Figure 139: Middle East and Africa Market Attractiveness Analysis by Customer & Billing Type
- Figure 140: Global Market - Tier Structure Analysis
- Figure 141: Global Market - Company Share Analysis
Frequently Asked Questions
How big is the automotive repair & maintenance services market in 2026, and what is forecast for 2036?
FMI estimates that the global automotive repair and maintenance services market size stood at USD 780.0 billion in 2025 and reached USD 820.0 billion in 2026. Total industry valuation is projected to hit USD 1,361.4 billion by 2036 as aging vehicle fleets and sensor-intensive repair tickets boost global workshop billings.
What is the CAGR for the automotive repair & maintenance services market from 2026 to 2036?
The automotive repair and maintenance services sector is projected to expand at a 5.2% CAGR over the 2026 to 2036 forecast period, adding USD 541.4 billion in incremental service and replacement-part revenue.
Which service category segment leads the automotive repair & maintenance services market?
Mechanical Repair covering engines, transmissions, steering, and brakes holds an estimated 44.0% share of service category demand in 2026 since vehicles aged past six years require high-ticket driveline, chassis, and brake overhauls.
Which service provider channel leads the automotive repair & maintenance services market?
Franchised Dealership OEM Service Centers (4S) represent 58.0% of the service provider channel in 2026 owing to factory warranty retention, recall campaigns, and encrypted OEM diagnostic software access.
Which country has a notable growth outlook during the assessment period?
India leads national growth projections at a 6.7% CAGR through 2036, driven by a rapidly expanding post-warranty passenger car and SUV parc and the rollout of organized multi-brand service centers.
Who are the key players in the market?
Driven Brands Holdings, Bridgestone Corporation, Monro, Valvoline, AutoNation, Michelin (Euromaster), Mavis Tire Express Services (Midas International), Robert Bosch GmbH (Bosch Car Service), Belron International, and Halfords Group lead commercial operations.
Preview the report firsthand - request a free sample
Get SampleGet the brochure for pricing and purchase details.
Get PDF
