

- Market Size (2026)
- USD 1.7 Bn
- Forecast (2036)
- USD 3.5 Bn
- CAGR (2026 to 2036)
- 7.5%
How big is Behavioral Health Analytics Market in 2026?
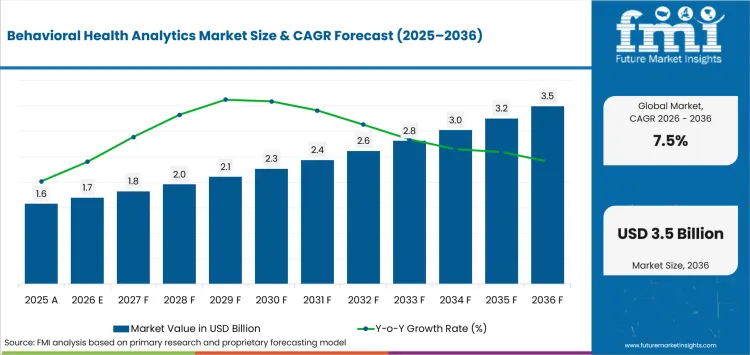
USD 1.7 billion in 2026 and is forecast to reach USD 3.5 billion by 2036 at a 7.5% CAGR
Behavioral health analytics demand is expected to push the valuation from USD 1.7 billion in 2026 to reach USD 3.5 billion by 2036 at a 7.5% CAGR, driven by health systems that need to connect behavioral screening and outcomes across separate care settings. SAMHSA reported in July 2025 that 60.1 million US adults received some form of mental health treatment during 2024. The scale of remote care produces more encounter and assessment records that require consistent clinical data analytics. A platform earns commercial value when it converts those records into care-gap lists and risk signals that clinicians can review inside daily workflows.
US demand is shaped by payer programs, while the UK market depends more heavily on shared NHS measures and integrated care governance. CMS set aside USD 60 million in June 2024 for the Innovation in Behavioral Health Model and capped each state award at USD 7.5 million. The funding supports health information technology and secure data exchange inside specialty behavioral health settings nationwide. Reliable healthcare cloud infrastructure can reduce local maintenance work and improve version control across distributed services. The commercial implication favors products that match local payment rules and data controls instead of forcing one global configuration.
Key Takeaways of Behavioral Health Analytics Market
- Demand for behavioral health analytics is driven by wider use of outcomes and risk measures across clinical and payer workflows, with commercial value depending on whether alerts and dashboards lead to documented action inside clinical and care-management workflows.
- By solution type, descriptive analytics holds the leading share at 30.5% in 2026, driven by demand for trusted trend views before model-governance infrastructure is in place.
- Cloud-based deployment accounts for 41.4% share in 2026, supported by distributed care networks needing consistent software and measure definitions across locations.
- Mental health outcome tracking represents 33.5% application share in 2026, attributable to reporting requirements connecting clinical progress with service performance across treatment episodes.
- Hospitals lead end-user demand at 39.0% share in 2026, owing to broad access to emergency, inpatient, outpatient, and financial records that support coordinated risk identification and follow-up.
- South Korea and the USA post the two higher country CAGRs in the profile, supported by case-management expansion and payer-led analytics, while Germany and the UK require products fitting national data rules and established reporting structures across public care systems.
- Competition centers on Oracle Health, Epic, Optum, and SAS through broad clinical and population platforms, while NextGen, Netsmart, Qualifacts, Eleos, NeuroFlow, and Holmusk compete through specialized behavioral health capabilities built around defined care workflows.
Analyst Perspective
"The behavioral health analytics market will be shaped by clinical usability rather than analytical sophistication alone. Healthcare organizations are prioritizing platforms that generate actionable insights, support accountable decision-making, and integrate seamlessly into behavioral care workflows. Vendors that combine transparent analytics with measurable clinical value and workflow alignment will be better positioned to achieve sustained adoption."
- Anurag Sharma, Principal Analyst at Future Market Insights
How is the Behavioral Health Analytics Market segmented?
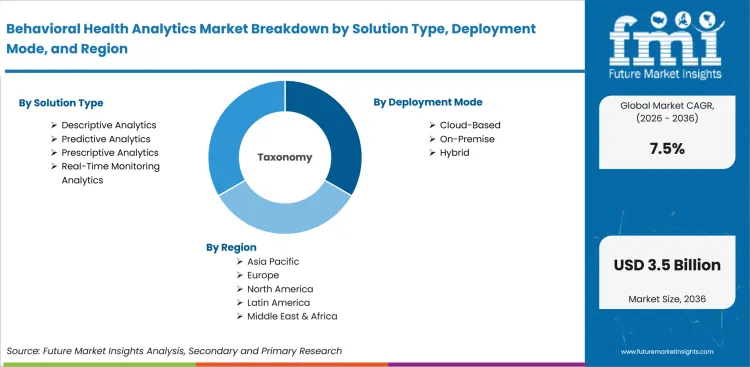
Behavioral health analytics is segmented by solution type, deployment mode, application and end user to show how organizations purchase analytical functions and apply them within care delivery.
The segmentation structure separates what the software does from how it is delivered and who uses the result. Solution Type follows the path from descriptive reporting toward prediction and recommendations that support real-time monitoring across care settings. Deployment Mode reflects hosting and governance choices across cloud, on-premise and hybrid environments with different security responsibilities. Application categories show whether analytics is used for outcomes, substance use, population management, decision support, or risk stratification. End User categories distinguish hospitals from behavioral health clinics, payers, government agencies and employee assistance programs. The final purchasing decision often depends on how closely the product connects with clinical decision support systems that care teams already use.
How does descriptive analytics shape demand within solution type?
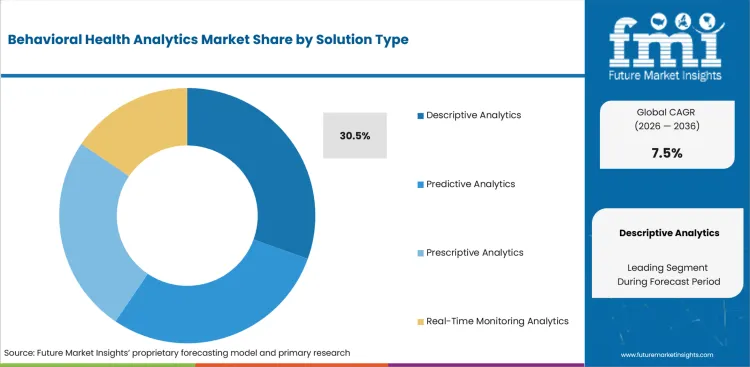
Descriptive Analytics turns encounter and outcome data into an agreed operating baseline before an organization adopts risk models. Qualifacts reported in December 2025 that CHE Behavioral Health tracked weekly performance and budgets across about 500 facilities while monitoring measures such as PHQ-9. The case shows why healthcare business intelligence remains useful at the first stage of analytics maturity. Consistent definitions help managers identify meaningful service variation before they change staffing plans or clinical protocols across facilities.
- In 2026, descriptive analytics is projected to account for 30.5% share in 2026, driven by demand for trusted trend views that can be reviewed without model-governance infrastructure. Hospitals and behavioral health clinics can deploy these functions before they build the validation processes required for predictive or prescriptive tools. The lower operational threshold makes descriptive reporting a practical entry point for organizations standardizing measures across locations.
- Behavioral health service directors are increasingly purchasing Descriptive Analytics, supported by the need to compare access and outcome measures across sites. Regular reporting exposes data-definition problems early and creates a practical reference point for later risk modeling. The immediate commercial benefit comes from operational control and reliable comparison rather than model sophistication that teams cannot yet govern.
What supports demand for cloud-based deployment within deployment mode?
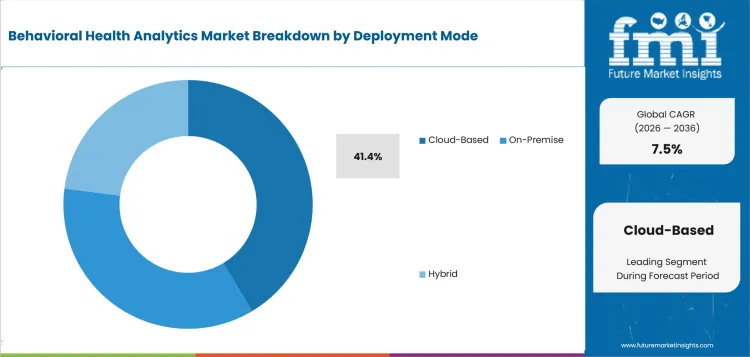
Cloud-Based systems can centralize those controls across distributed services, but their value depends on dependable healthcare interoperability solutions and clear access rules. Behavioral health organizations therefore examine hosting resilience and integration depth before they compare advanced analytical features.
- By deployment mode, cloud-based deployment is estimated to hold 41.4% share in 2026, supported by distributed care networks that need consistent software and measure definitions. Central hosting can standardize updates across hospitals and mobile teams without requiring each site to maintain separate infrastructure. Security terms and interface performance still determine whether the model reduces administrative work across contracted services.
- Community mental health networks are increasingly purchasing Cloud-Based platforms, attributable to the need for centralized dashboards across many service locations. Subscription deployment can shorten local implementation work, yet care organizations still require contract terms for data location, backups, incident response and system exit. Contract terms and technical controls determine whether cloud adoption reduces operational workload or transfers unresolved risk to another organization.
How do care teams evaluate mental health outcome tracking?
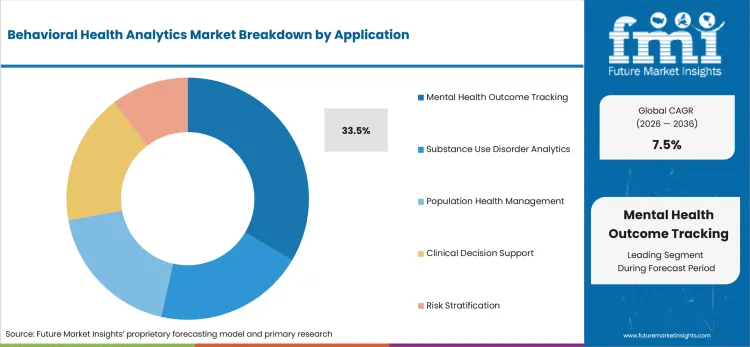
NHS England reported in January 2026 that access to transformed adult community mental health services reached 597,374 people in quarter four of 2024/25. Activity at that scale makes outcome measurement more than a reporting exercise because service leaders need to connect treatment completion with symptom change and follow-up. Mental Health Outcome Tracking becomes more useful when electronic health records capture measures at consistent points and route exceptions to responsible care teams.
- Mental Health Outcome Tracking is forecast to represent 33.5% share in 2026, attributable to reporting requirements that connect clinical progress with service performance. Hospitals and payers need a common basis for testing whether increased access produces meaningful improvement across treatment episodes. The application becomes more valuable when repeated measures trigger follow-up inside existing clinical work queues.
- Clinical quality directors are increasingly purchasing Mental Health Outcome Tracking, owing to the need for comparable results across long treatment episodes. Repeated measures can reveal meaningful improvement and early disengagement patterns that simple visit counts often miss across treatment episodes. Adoption rises when the platform places missing assessments and worsening scores into existing work queues rather than a separate analytical portal.
What makes hospitals central to the end user category?
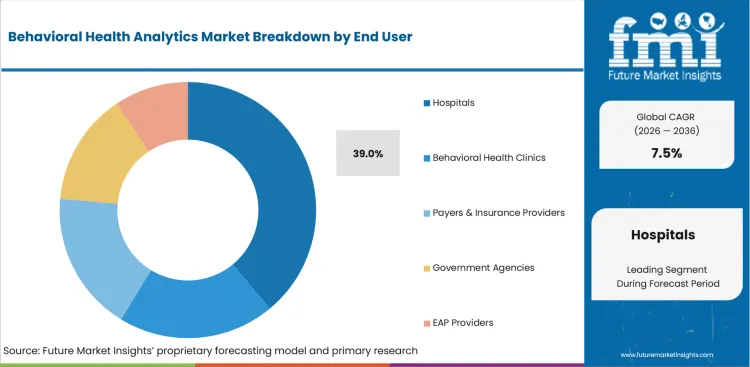
Hospitals hold emergency visits and inpatient episodes alongside diagnostic coding and discharge information inside connected clinical records. Destatis reported in April 2026 that 116,300 German hospital cases among people aged 10 to 19 involved mental or behavioral disorders in 2024 and represented 18.9% of treatment for that age group. Analytics becomes commercially useful when it identifies repeat utilization and supports follow-up beyond the hospital boundary.
- Hospitals are projected to hold 39.0% share in 2026, owing to broad access to emergency and inpatient data alongside outpatient and financial records. Combined information helps hospital teams study repeat utilization and discharge follow-up that remain invisible within a single clinic. The commercial case depends on connecting each risk signal with an assigned task and recorded response.
- Hospital behavioral health departments are increasingly purchasing analytical platforms, reinforced by the need to coordinate crisis care and discharge follow-up across departments. Their investment case improves when the platform connects a risk signal with a named work queue and records the action taken. Broad data access produces limited value unless a hospital assigns reliable operational ownership for each risk signal and follow-up task.
What are the drivers, restraints and opportunities in the Behavioral Health Analytics Market?
The market is driven by outcome measurement and integrated care; privacy and data-quality requirements can slow adoption; value-based behavioral health programs create a commercial opening for connected analytics.
- Driver: Behavioral health organizations need analytics that reduce documentation work and connect measures to action inside clinical workflows.
- Restraint: Sensitive records and uneven data definitions raise implementation cost and can weaken confidence in risk models.
- Opportunity: Value-based care programs create a commercial opening for platforms that connect outcomes, utilization and payment.
Workflow automation is a factor supporting growth because clinicians often collect data without receiving usable guidance during the encounter. Oracle reported in March 2025 that its Clinical AI Agent covered behavioral health among more than 30 specialties and reduced physician documentation time by nearly 30% on average. The development shows how artificial intelligence in healthcare can make analytical output useful inside daily work. Products that save time and preserve clinician review have a clearer renewal case than separate dashboards.
Data protection is a factor limiting demand due to the reason that behavioral records can expose diagnoses, substance-use history and crisis information. The Federal Register published proposed HIPAA Security Rule changes in January 2025 that included technology inventories, network maps and written risk analysis. The proposed requirements place more work on hospitals and software partners before a behavioral analytics deployment can scale safely. Weak access design or incomplete data lineage can delay approval even when the analytical model performs well.
An emerging opportunity lies in payment models that fund coordinated behavioral and physical health care. CMS reported in March 2026 that approved practices in its Innovation in Behavioral Health Model could receive up to USD 200,000 for infrastructure. The infrastructure funding can support interoperability and telehealth capacity that practices need for coordinated behavioral and physical health services. Companies aligned with value-based healthcare services can support practice reporting, risk stratification and referral management. Commercial success will depend on proving that analytics improves action rather than increasing reporting burden.
Which country CAGRs are profiled in the Behavioral Health Analytics Market?
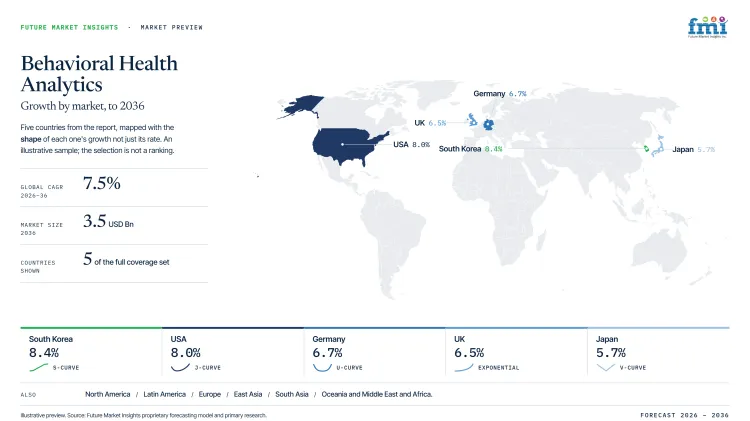
| Country | CAGR |
|---|---|
| USA | 8.0% |
| UK | 6.5% |
| Germany | 6.7% |
| Japan | 5.7% |
| South Korea | 8.4% |
How do country-level CAGRs compare in the Behavioral Health Analytics Market?
The comparison spans 2.7 percentage points and displays two compact pairs above Japan’s separate position. South Korea and the USA form the upper cluster through case management and payer-led analytics. Germany and the UK remain closely aligned around regulated data use and national reporting structures. Japan’s measured separation reflects narrower population-monitoring needs and particularly sensitive governance requirements across institutions.
- South Korea connects emergency departments with follow-up programs that measure engagement and repeated crisis risk.
- The USA uses claims and encounter data to support care-gap detection across payer-managed populations.
- Germany emphasizes compliant record integration and cost monitoring within tightly regulated healthcare environments and services.
- UK demand follows national outcome measures and shared reporting across publicly funded behavioral health services.
- Japan requires careful analysis of suicide-prevention and youth indicators across schools and community programs.
Comparable CAGRs produce different implementation burdens because measure libraries and accountability rules remain nationally specific. Providers must fit local reporting systems before advanced models can influence clinical or administrative decisions. The full report provides country-level CAGR analysis across North America, Latin America, Europe, East Asia, South Asia, Oceania and the Middle East and Africa.
- USA demand is shaped by insurer reporting, federal payment tests and a care system that produces large volumes of claims and encounter data. Behavioral health analytics demand in the USA is forecast to rise at 8.0% CAGR over the forecast period, driven by payer interest in utilization control and care-gap detection. SAMHSA reported in July 2025 that 33.4 million adults received mental health treatment through telehealth during 2024. The figure shows that remote treatment is now a material data source rather than a small channel. CMS, state Medicaid agencies and health plans need platforms that connect virtual visits with outcomes and later service use over extended periods. Procurement will favor products that document model performance across populations and integrate with existing claims and clinical systems.
- England's national reporting model gives software companies clear measures but little room for inconsistent local definitions. The UK is estimated to post 6.5% CAGR through 2036, supported by service-access tracking and integrated care board oversight. NHS England reported in January 2026 that 63,784 women accessed specialist community perinatal mental health services in the twelve months to March 2025 against a target of 66,000. The measured shortfall creates a direct analytics use case around referral flow and regional variation across integrated care boards. NHS mental health trusts and integrated care boards need tools that reconcile activity across contracted providers. Investment decisions will depend on whether platforms support national measures without forcing local teams to rebuild reporting logic.
- Germany's opportunity rests on connecting strict health-data governance with a measurable burden from mental and behavioral disorders. The German behavioral health analytics sector is projected to record 6.7% CAGR during the forecast period, attributable to cost monitoring and digital record integration. Destatis reported in August 2025 that mental and behavioral disorders generated EUR 63.3 billion in direct disease costs during 2023 and represented 12.9% of national disease costs. The measured burden gives statutory insurers a financial reason to improve service analysis and compare care patterns across regions. Statutory health insurers and hospital groups require transparent data lineage and validation evidence before using risk models. Technology selection will place security and coding consistency alongside auditability ahead of broad feature counts in Germany.
- Japan requires analytics that distinguish national progress from unresolved risk among younger people across schools and community services. Adoption of behavioral health analytics in Japan is estimated to expand at 5.7% CAGR by 2036, owing to demand for suicide-prevention monitoring and regional service planning. The Ministry of Health, Labour and Welfare reported in October 2025 that 529 elementary, junior high and high school students died by suicide in 2024. The figure creates a specific need for age-based monitoring that does not hide youth risk inside broad population averages. Local governments and health ministries need trend analysis that connects crisis contacts with follow-up capacity. Adoption risk will remain high for products that cannot explain how sensitive youth indicators are used.
- South Korea is linking emergency response with longer follow-up, which creates a narrower but practical analytics need. South Korea is projected to grow at 8.4% CAGR from 2026 to 2036, reinforced by investment in suicide-attempt case management and hospital coordination. The Ministry of Health and Welfare reported in July 2026 that 14,414 people received case management during the previous year and the program expanded to 100 hospitals. The broader hospital network gives health authorities a stronger base for measuring engagement and repeat crisis risk. The Korea Foundation for Suicide Prevention and participating hospitals need consistent tracking across sites that use different emergency workflows. Investment should prioritize case-management workflow and outcome measurement rather than standalone visualization that cannot guide follow-up decisions.
Who are the notable companies in the Behavioral Health Analytics Market?
Notable companies include Oracle Health, Epic Systems Corporation, Optum, SAS Institute Inc., NextGen Healthcare, Netsmart Technologies, Qualifacts, Eleos Health, NeuroFlow and Holmusk.
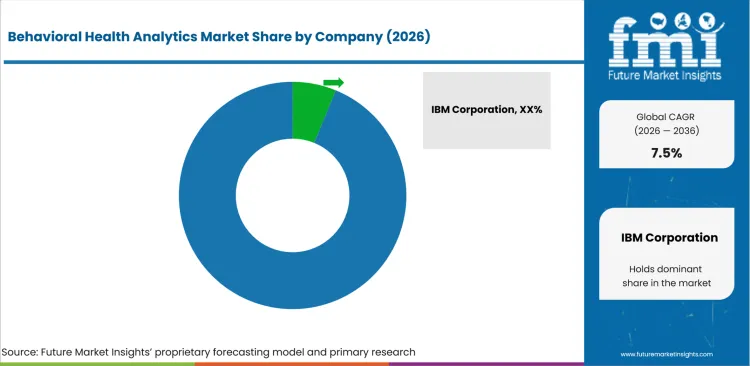
Competition divides between broad health platforms and specialists that build around behavioral health workflows and measures. Oracle Health and Epic connect analytics with enterprise records that span physical and behavioral care. Optum and SAS emphasize population measurement and payer decision support across large healthcare data environments and public programs. NextGen, Netsmart and Qualifacts place behavioral workflows closer to the center of each product architecture. Eleos Health, NeuroFlow and Holmusk focus on specialized AI and risk intelligence alongside behavioral health real-world evidence. Broad platforms benefit from digital transformation in healthcare because they can connect behavioral information with enterprise records. The commercial contest depends on integration depth and measure quality alongside the ability to trigger action inside care workflows.
- Oracle Health and Epic Systems Corporation compete through enterprise record integration and embedded behavioral health workflows across care settings. Oracle tracks suicide risk and depression remission measures through connected inpatient and outpatient care records. Epic supports screening and risk scores inside shared clinical information used by multidisciplinary care teams.
- Optum and SAS address payer and population analysis through risk models and performance measures across large healthcare data environments. Optum applies state performance analytics to behavioral health measures and Medicaid risk signals across public programs. SAS has supported predictive mental health work at the Centre for Addiction and Mental Health.
- NextGen Healthcare, Netsmart Technologies and Qualifacts focus on operations inside behavioral health organizations and community service networks. NextGen links financial analytics with population health tools, while Netsmart connects clinical records with crisis dispatch and mobile teams. Qualifacts supports operational dashboards and outcome measures across multi-site provider networks within behavioral health care.
- Eleos Health, NeuroFlow and Holmusk address narrower analytical problems that broad enterprise platforms may not prioritize. Eleos structures session documentation, while NeuroFlow combines claims and clinical encounters for population risk intelligence across covered populations. Holmusk provides behavioral health real-world data through NeuroBlu, but each specialist must prove enterprise integration and governance.
Competitive Benchmarking: Behavioral Health Analytics Market
| Company | Behavioral Workflow Integration | Population Risk Analytics | Outcomes and Reporting | Interoperability | Geographic Reach |
|---|---|---|---|---|---|
| Oracle Health | High | Medium | High | High | International health systems |
| Epic Systems Corporation | High | Medium | High | High | United States and selected international systems |
| Optum | Medium | High | High | High | Primarily North America |
| SAS Institute Inc. | Low | High | High | Medium | International enterprise deployments |
| NextGen Healthcare | High | Medium | High | High | United States |
| Netsmart Technologies | High | High | High | High | North America |
| Qualifacts | High | Medium | High | Medium | United States |
| Eleos Health | High | Low | Medium | Medium | Primarily United States |
| NeuroFlow | Medium | High | High | Medium | United States |
| Holmusk | Low | High | High | Medium | International research markets |
Key Developments in the Behavioral Health Analytics Market
- In February 2025, Netsmart Technologies: Riverside University Health System Behavioral Health implemented CareRouter for mobile crisis dispatch across a 7,300-square-mile county. Netsmart stated in February 2025 that the cloud system can coordinate as many as 35 teams and aims to reduce response times from more than one hour to less than 30 minutes.
- In April 2025, NextGen Healthcare: McCall Behavioral Health Network adopted NextGen Enterprise EHR and practice management technology across 23 facilities and community programs in Connecticut. The deployment includes Financial Analytics and Population Health Solutions that connect operational reporting with care-management information across the network.
- In May 2025, Eleos Health: Eleos expanded its behavioral health documentation product with support for more than 150 languages and offline mobile use. Notes recorded in field settings can synchronize with the electronic health record after connectivity returns. The release addresses two practical barriers for behavioral health analytics: incomplete documentation in community settings and limited language coverage across diverse service populations.
- In June 2025, NeuroFlow released BHIQ to combine claims, electronic medical record encounters, pharmacy information and consumer-generated data for behavioral health risk management. The product identifies population needs and performance opportunities that may remain hidden in physical health analysis.
Key Players in the Behavioral Health Analytics Market
Enterprise Clinical Platforms
- Oracle Health
- Epic Systems Corporation
Payer and Population Analytics
- Optum
- SAS Institute Inc.
- NeuroFlow
- Holmusk
Behavioral Health Workflow Platforms
- NextGen Healthcare
- Netsmart Technologies
- Qualifacts
- Eleos Health
Behavioral Health Analytics Market - Report Scope
| Coverage field | Report scope |
|---|---|
| Market breakdown | Solution type, deployment mode, application and end user. |
| Market Definition | Behavioral health analytics covers software and analytical services that convert mental health and substance use data into clinical, operational, financial, population, or risk insights. The category includes reporting, prediction, recommendations, real-time monitoring, outcome tracking and decision support. |
| Regions Covered | North America, Latin America, Europe, East Asia, South Asia, Oceania and Middle East and Africa. |
| Countries Covered | USA, UK, Germany, Japan, South Korea and 30+ countries |
| Key Companies Profiled | Oracle Health, Epic Systems Corporation, Optum, SAS Institute Inc., NextGen Healthcare, Netsmart Technologies, Qualifacts, Eleos Health, NeuroFlow, Holmusk. |
| Forecast Period | 2026 to 2036. |
| Approach | Hybrid bottom-up and top-down market sizing supported by primary interviews and official desk research. |
Behavioral Health Analytics Market - Research Methodology
| Method | Approach |
|---|---|
| Primary Research | FMI analysts gathered input from manufacturers, service providers, technology developers, distributors, end users, procurement teams and subject-matter experts. Interviews examined purchasing decisions, product or service evaluation, adoption barriers, approval requirements, pricing considerations and expectations for technical or commercial support. Respondents were also asked what evidence is required before a trial, pilot, or initial order develops into regular purchasing. |
| Desk Research | Desk research covered government statistics, regulatory publications, trade data, industry associations, technical literature, standards, company filings, product information and official corporate announcements. Sources were reviewed for relevance, publication date, geographic coverage and consistency with the defined market scope. Claims relating to performance, applications, approvals, capacity, investment and commercial activity were retained only when supported by credible public evidence. |
| Market Sizing and Forecasting | The market model combined the baseline value with historical performance, segment structure, pricing and volume indicators, adoption levels, company participation and country-level demand conditions. Forecast assumptions considered economic activity, investment trends, regulatory developments, technology adoption, purchasing cycles, supply availability and barriers to wider market use. Segment and regional estimates were reconciled before the final market total was calculated. |
| Data Validation | Estimates were checked against multiple independent indicators, including public data, company activity, trade patterns, industry developments and findings from primary interviews. Validation also tested whether products, services, applications and company revenues fell within the defined market boundaries. Adjacent categories, unsupported claims, overlapping revenues and activities without direct market relevance were excluded to reduce double counting and maintain consistency across segments and countries. |
Behavioral Health Analytics Market by Segments
Solution Type
- Descriptive Analytics
- Predictive Analytics
- Prescriptive Analytics
- Real-Time Monitoring Analytics
Deployment Mode
- Cloud-Based
- On-Premise
- Hybrid
Application
- Mental Health Outcome Tracking
- Substance Use Disorder Analytics
- Population Health Management
- Clinical Decision Support
- Risk Stratification
End User
- Hospitals
- Behavioral Health Clinics
- Payers and Insurance Providers
- Government Agencies
- EAP Providers
Behavioral Health Analytics Market by Region:
- North America
- United States
- Canada
- Europe
- Germany
- United Kingdom
- France
- Italy
- Spain
- Asia Pacific
- India
- China
- Japan
- South Korea
- Australia
- Latin America
- Brazil
- Argentina
- Mexico
- Chile
- Middle East & Africa
- UAE
- Saudi Arabia
- South Africa
Research Sources and Bibliography
- Substance Abuse and Mental Health Services Administration. (2025, July). Key Substance Use and Mental Health Indicators in the United States: Results from the 2024 National Survey on Drug Use and Health.
- Centers for Medicare & Medicaid Services. (2024, June 17). Innovation in Behavioral Health (IBH).
- Centers for Medicare & Medicaid Services. (2026, March 24). Innovation in Behavioral Health (IBH) Model Frequently Asked Questions.
- NHS England. (2025, February 7). Principles for Using Digital Technologies in Mental Health Inpatient Treatment and Care.
- NHS England. (2026, January 15). Performance Report 2024/25.
- Statistisches Bundesamt. (2025, August 8). Kreislauferkrankungen sowie psychische und Verhaltensstörungen verursachen zusammen 26,0 % der Krankheitskosten im Jahr 2023.
- Statistisches Bundesamt. (2026, April 1). Psychische Erkrankungen 2024 die Ursache für 18,9 % der Krankenhausbehandlungen von 10- bis 19-Jährigen.
- Ministry of Health, Labour and Welfare, Japan. (2025, October 24). The 2025 White Paper on Suicide Countermeasures [Summary].
- Ministry of Health and Welfare, Republic of Korea. (2026, July 15). Emergency Room-Based Follow-up Care for Suicide Attempt Survivors Expands to 100 Hospitals.
- Office for Civil Rights, USA Department of Health and Human Services. (2025, January 6). HIPAA Security Rule To Strengthen the Cybersecurity of Electronic Protected Health Information.
- Oracle. (2025, March 4). Oracle Health Clinical AI Agent Reduces Physician Documentation Time by 30%.
- Netsmart Technologies. (2025, February 12). Riverside University Health System – Behavioral Health and Netsmart Collaborate to Leverage Technology Designed to Optimize Mobile Crisis Response Teams.
- NextGen Healthcare. (2025, April 24). NextGen Healthcare Helping McCall Behavioral Health Network Increase Efficiency and Integration Across Connecticut.
- Eleos Health. (2025, May 1). Eleos Advances Comprehensive Behavioral Health Product Capabilities.
- NeuroFlow. (2025, June 10). NeuroFlow Releases Behavioral Health Intelligence Solution to Improve Payer and Provider Risk Management Strategies.
- Qualifacts. (2025, December 1). CHE Behavioral Health Services Drives Growth and Clinical Excellence with Qualifacts Business Intelligence.
- Oracle Health. (n.d.). Behavioral Health.
- Epic Systems Corporation. (n.d.). Primary Care.
- Optum. (n.d.). Healthcare Performance Analytics.
- SAS Institute Inc. (n.d.). Advancing Mental Health Care with Predictive Analytics.
- Holmusk. (n.d.). Neuropsychiatry Analytics Solutions.
The bibliography reflects sources available through July 2026.
This Report Answers
- How does the market move from 2025 to its 2036 forecast value?
- Which analytical functions hold the dominant segment positions during 2026?
- Why does Cloud-Based deployment appeal to distributed behavioral health networks?
- How do outcome tracking and risk stratification support clinical and payment decisions?
- Which data-quality and security issues can delay a behavioral analytics deployment?
- How do country CAGRs differ across the USA, UK, Germany, Japan and South Korea?
- Which companies compete through enterprise platforms and which focus on behavioral health workflows?
- What evidence should executives require before expanding a pilot into regular purchasing?
- How do workflow integration and interoperability affect long-term commercial value?
Frequently Asked Questions
How big is the Behavioral Health Analytics Market in 2026?
The behavioral health analytics market is valued at USD 1.7 billion in 2026 and is forecast to reach USD 3.5 billion by 2036, as health systems connect behavioral screening and outcomes data across separate care settings to support clinical decision-making and payer reporting workflows.
What is the CAGR of the Behavioral Health Analytics Market from 2026 to 2036?
The behavioral health analytics market grows at a 7.5% CAGR between 2026 and 2036, supported by outcome measurement requirements and value-based care programs connecting behavioral and physical health data across clinical, payer, and population management workflows.
Which solution type leads the Behavioral Health Analytics Market?
Descriptive analytics holds 30.5% of the behavioral health analytics market by solution type in 2026, driven by demand for trusted trend views that hospitals and behavioral health clinics can deploy before building the validation processes required for predictive or prescriptive analytical tools.
How much will the Behavioral Health Analytics Market add between 2026 and 2036?
The behavioral health analytics market will add USD 1.8 billion between 2026 and 2036, rising from USD 1.7 billion to USD 3.5 billion as outcome measurement requirements and payer-led risk programs expand analytical adoption across hospitals, government agencies, and behavioral health networks.
Who are the leading companies in the Behavioral Health Analytics Market?
Ten companies lead the behavioral health analytics market, including Oracle Health, Epic Systems Corporation, Optum, SAS Institute Inc., NextGen Healthcare, Netsmart Technologies, Qualifacts, Eleos Health, NeuroFlow, and Holmusk, competing through enterprise record integration, population risk analytics, and specialized behavioral health workflow platforms across clinical and payer settings.
Preview the report firsthand - request a free sample
Get SampleGet the brochure for pricing and purchase details.
Get PDFTable of Content
- Key Takeaways
- Market Size and CAGR
- Top Growth Driver
- Fastest Growing Segment
- Leading Region
- Key Companies
- Emerging Opportunities
- Executive Summary
- Global Market Outlook
- Demand-side Trends
- Supply-side Trends
- Technology Roadmap Analysis
- Analysis and Recommendations
- Analyst Perspective (What is happening? Why now? What should investors know?)
- Key Questions Answered
- How large is the market?
- What is the CAGR?
- What are key trends?
- Which region dominates?
- Who are the leaders?
- Market Overview
- Market Coverage / Taxonomy
- Market Definition / Scope / Limitations
- Research Methodology
- Chapter Orientation
- Analytical Lens and Working Hypotheses
- Market Structure, Signals, and Trend Drivers
- Benchmarking and Cross-market Comparability
- Market Sizing, Forecasting, and Opportunity Mapping
- Research Design and Evidence Framework
- Desk Research Programme (Secondary Evidence)
- Expert Input and Fieldwork (Primary Evidence)
- Tooling, Models, and Reference Databases
- Data Engineering and Model Build
- Quality Assurance and Audit Trail
- Market Background
- Market Dynamics (Drivers, Restraints, Opportunity, Trends)
- Scenario Forecast (Optimistic, Likely, Conservative)
- Impact Analysis
- AI Impact
- Sustainability Impact
- Regulatory Impact
- Technology Impact
- Consumer / Buyer Analysis
- Purchase Drivers
- Adoption Barriers
- Buyer Journey
- Opportunity Map Analysis
- Product Life Cycle Analysis
- Supply Chain Analysis
- Investment Feasibility Matrix
- Value Chain Analysis
- PESTLE and Porter's Analysis
- Regulatory Landscape
- Regional Parent Market Outlook
- Production and Consumption Statistics
- Import and Export Statistics
- Global Market Analysis and Forecast, 2021 to 2036
- Historical Market Size Value (USD Billion) Analysis, 2021 to 2025
- Current and Future Market Size Value (USD Billion) Projections, 2026 to 2036
- Y-o-Y Growth Trend Analysis
- Absolute $ Opportunity Analysis
- Global Market Pricing Analysis, 2021 to 2036
- Global Market Analysis and Forecast, By Solution Type, 2021 to 2036
- Introduction / Key Findings
- Historical Market Size Value (USD Billion) Analysis By Solution Type, 2021 to 2025
- Current and Future Market Size Value (USD Billion) Analysis and Forecast By Solution Type, 2026 to 2036
- Descriptive Analytics
- Predictive Analytics
- Prescriptive Analytics
- Real-Time Monitoring Analytics
- Descriptive Analytics
- Y-o-Y Growth Trend Analysis By Solution Type, 2021 to 2025
- Absolute $ Opportunity Analysis By Solution Type, 2026 to 2036
- Global Market Analysis and Forecast, By Deployment Mode, 2021 to 2036
- Introduction / Key Findings
- Historical Market Size Value (USD Billion) Analysis By Deployment Mode, 2021 to 2025
- Current and Future Market Size Value (USD Billion) Analysis and Forecast By Deployment Mode, 2026 to 2036
- Cloud-Based
- On-Premise
- Hybrid
- Cloud-Based
- Y-o-Y Growth Trend Analysis By Deployment Mode, 2021 to 2025
- Absolute $ Opportunity Analysis By Deployment Mode, 2026 to 2036
- Global Market Analysis and Forecast, By Application, 2021 to 2036
- Introduction / Key Findings
- Historical Market Size Value (USD Billion) Analysis By Application, 2021 to 2025
- Current and Future Market Size Value (USD Billion) Analysis and Forecast By Application, 2026 to 2036
- Mental Health Outcome Tracking
- Substance Use Disorder Analytics
- Population Health Management
- Clinical Decision Support
- Risk Stratification
- Mental Health Outcome Tracking
- Y-o-Y Growth Trend Analysis By Application, 2021 to 2025
- Absolute $ Opportunity Analysis By Application, 2026 to 2036
- Global Market Analysis and Forecast, By End User, 2021 to 2036
- Introduction / Key Findings
- Historical Market Size Value (USD Billion) Analysis By End User, 2021 to 2025
- Current and Future Market Size Value (USD Billion) Analysis and Forecast By End User, 2026 to 2036
- Hospitals
- Behavioral Health Clinics
- Payers & Insurance Providers
- Government Agencies
- EAP Providers
- Hospitals
- Y-o-Y Growth Trend Analysis By End User, 2021 to 2025
- Absolute $ Opportunity Analysis By End User, 2026 to 2036
- Global Market Analysis and Forecast, By Region, 2021 to 2036
- Introduction
- Historical Market Size Value (USD Billion) Analysis By Region, 2021 to 2025
- Current Market Size Value (USD Billion) Analysis and Forecast By Region, 2026 to 2036
- North America
- Latin America
- Western Europe
- Eastern Europe
- East Asia
- South Asia and Pacific
- Middle East & Africa
- Market Attractiveness Analysis By Region
- North America Market Analysis and Forecast, By Country, 2021 to 2036
- Historical Market Size Value (USD Billion) Trend Analysis By Market Taxonomy, 2021 to 2025
- Market Size Value (USD Billion) Forecast By Market Taxonomy, 2026 to 2036
- By Country
- USA
- Canada
- By Solution Type
- By Deployment Mode
- By Application
- By End User
- By Country
- Market Attractiveness Analysis
- By Country
- By Solution Type
- By Deployment Mode
- By Application
- By End User
- Key Takeaways
- Latin America Market Analysis and Forecast, By Country
- Historical Market Size Value (USD Billion) Trend Analysis By Market Taxonomy, 2021 to 2025
- Market Size Value (USD Billion) Forecast By Market Taxonomy, 2026 to 2036
- By Country
- Brazil
- Mexico
- Chile
- Rest of Latin America
- By Solution Type
- By Deployment Mode
- By Application
- By End User
- By Country
- Market Attractiveness Analysis
- By Country
- By Solution Type
- By Deployment Mode
- By Application
- By End User
- Key Takeaways
- Western Europe Market Analysis and Forecast, By Country
- Historical Market Size Value (USD Billion) Trend Analysis By Market Taxonomy, 2021 to 2025
- Market Size Value (USD Billion) Forecast By Market Taxonomy, 2026 to 2036
- By Country
- Germany
- UK
- Italy
- Spain
- France
- Nordic
- BENELUX
- Rest of Western Europe
- By Solution Type
- By Deployment Mode
- By Application
- By End User
- By Country
- Market Attractiveness Analysis
- By Country
- By Solution Type
- By Deployment Mode
- By Application
- By End User
- Key Takeaways
- Eastern Europe Market Analysis and Forecast, By Country
- Historical Market Size Value (USD Billion) Trend Analysis By Market Taxonomy, 2021 to 2025
- Market Size Value (USD Billion) Forecast By Market Taxonomy, 2026 to 2036
- By Country
- Russia
- Poland
- Hungary
- Balkan & Baltic
- Rest of Eastern Europe
- By Solution Type
- By Deployment Mode
- By Application
- By End User
- By Country
- Market Attractiveness Analysis
- By Country
- By Solution Type
- By Deployment Mode
- By Application
- By End User
- Key Takeaways
- East Asia Market Analysis and Forecast, By Country
- Historical Market Size Value (USD Billion) Trend Analysis By Market Taxonomy, 2021 to 2025
- Market Size Value (USD Billion) Forecast By Market Taxonomy, 2026 to 2036
- By Country
- China
- Japan
- South Korea
- By Solution Type
- By Deployment Mode
- By Application
- By End User
- By Country
- Market Attractiveness Analysis
- By Country
- By Solution Type
- By Deployment Mode
- By Application
- By End User
- Key Takeaways
- South Asia and Pacific Market Analysis and Forecast, By Country
- Historical Market Size Value (USD Billion) Trend Analysis By Market Taxonomy, 2021 to 2025
- Market Size Value (USD Billion) Forecast By Market Taxonomy, 2026 to 2036
- By Country
- India
- ASEAN
- Australia & New Zealand
- Rest of South Asia and Pacific
- By Solution Type
- By Deployment Mode
- By Application
- By End User
- By Country
- Market Attractiveness Analysis
- By Country
- By Solution Type
- By Deployment Mode
- By Application
- By End User
- Key Takeaways
- Middle East & Africa Market Analysis and Forecast, By Country
- Historical Market Size Value (USD Billion) Trend Analysis By Market Taxonomy, 2021 to 2025
- Market Size Value (USD Billion) Forecast By Market Taxonomy, 2026 to 2036
- By Country
- Kingdom of Saudi Arabia
- Other GCC Countries
- Türkiye
- South Africa
- Other African Union
- Rest of Middle East & Africa
- By Solution Type
- By Deployment Mode
- By Application
- By End User
- By Country
- Market Attractiveness Analysis
- By Country
- By Solution Type
- By Deployment Mode
- By Application
- By End User
- Key Takeaways
- Key Countries Market Analysis
- USA
- Pricing Analysis
- Market Share Analysis, 2025
- By Solution Type
- By Deployment Mode
- By Application
- By End User
- Canada
- Pricing Analysis
- Market Share Analysis, 2025
- By Solution Type
- By Deployment Mode
- By Application
- By End User
- Mexico
- Pricing Analysis
- Market Share Analysis, 2025
- By Solution Type
- By Deployment Mode
- By Application
- By End User
- Brazil
- Pricing Analysis
- Market Share Analysis, 2025
- By Solution Type
- By Deployment Mode
- By Application
- By End User
- Chile
- Pricing Analysis
- Market Share Analysis, 2025
- By Solution Type
- By Deployment Mode
- By Application
- By End User
- Germany
- Pricing Analysis
- Market Share Analysis, 2025
- By Solution Type
- By Deployment Mode
- By Application
- By End User
- UK
- Pricing Analysis
- Market Share Analysis, 2025
- By Solution Type
- By Deployment Mode
- By Application
- By End User
- Italy
- Pricing Analysis
- Market Share Analysis, 2025
- By Solution Type
- By Deployment Mode
- By Application
- By End User
- Spain
- Pricing Analysis
- Market Share Analysis, 2025
- By Solution Type
- By Deployment Mode
- By Application
- By End User
- France
- Pricing Analysis
- Market Share Analysis, 2025
- By Solution Type
- By Deployment Mode
- By Application
- By End User
- India
- Pricing Analysis
- Market Share Analysis, 2025
- By Solution Type
- By Deployment Mode
- By Application
- By End User
- ASEAN
- Pricing Analysis
- Market Share Analysis, 2025
- By Solution Type
- By Deployment Mode
- By Application
- By End User
- Australia & New Zealand
- Pricing Analysis
- Market Share Analysis, 2025
- By Solution Type
- By Deployment Mode
- By Application
- By End User
- China
- Pricing Analysis
- Market Share Analysis, 2025
- By Solution Type
- By Deployment Mode
- By Application
- By End User
- Japan
- Pricing Analysis
- Market Share Analysis, 2025
- By Solution Type
- By Deployment Mode
- By Application
- By End User
- South Korea
- Pricing Analysis
- Market Share Analysis, 2025
- By Solution Type
- By Deployment Mode
- By Application
- By End User
- Russia
- Pricing Analysis
- Market Share Analysis, 2025
- By Solution Type
- By Deployment Mode
- By Application
- By End User
- Poland
- Pricing Analysis
- Market Share Analysis, 2025
- By Solution Type
- By Deployment Mode
- By Application
- By End User
- Hungary
- Pricing Analysis
- Market Share Analysis, 2025
- By Solution Type
- By Deployment Mode
- By Application
- By End User
- Kingdom of Saudi Arabia
- Pricing Analysis
- Market Share Analysis, 2025
- By Solution Type
- By Deployment Mode
- By Application
- By End User
- Türkiye
- Pricing Analysis
- Market Share Analysis, 2025
- By Solution Type
- By Deployment Mode
- By Application
- By End User
- South Africa
- Pricing Analysis
- Market Share Analysis, 2025
- By Solution Type
- By Deployment Mode
- By Application
- By End User
- USA
- Market Structure Analysis
- Competition Dashboard
- Competition Benchmarking
- Market Share Analysis of Top Players
- By Regional
- By Solution Type
- By Deployment Mode
- By Application
- By End User
- Emerging Startups
- Innovation Benchmarking
- Competition Analysis
- Competition Deep Dive
- IBM Corporation
- Overview
- Product Portfolio
- Profitability by Market Segments
- Sales Footprint
- Strategy Overview
- Marketing Strategy
- Product Strategy
- Channel Strategy
- Oracle Health
- SAS Institute Inc.
- Optum (UnitedHealth Group)
- Cerner Corporation
- Epic Systems Corporation
- NextGen Healthcare
- Netsmart Technologies
- MedeAnalytics, Inc.
- Veradigm Inc.
- IBM Corporation
- Case Studies
- Success Stories
- Recent Developments
- Competition Deep Dive
- Assumptions & Acronyms Used


