Adoption of Benelux Power Tools Market Outlook (2023 to 2033)

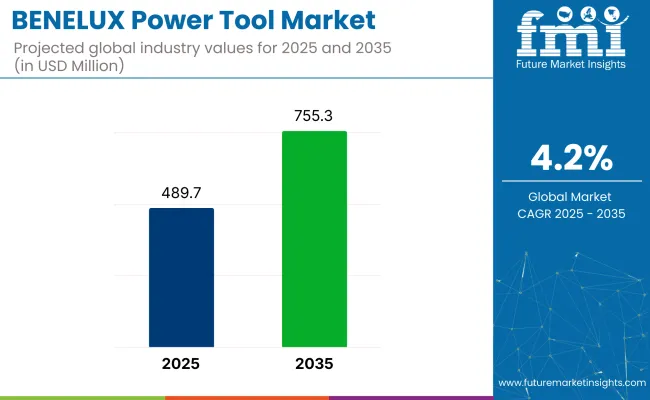
The adoption of Benelux power tools market is likely to touch a valuation of US$ 1,091.40 million in 2023. With the growing adoption of power tools across industrial and residential sectors, the overall demand is slated to grow at 4.6% CAGR between 2023 and 2033, totaling a valuation of US$ 1.711 billion by 2033.

Power tools have a wide range of applications in automobile manufacturing and assembly. Automobile production in the Benelux region has increased significantly in recent years. This is due to increasing urbanization and improving economic conditions in the area.

Home improvement and small maintenance activities are considered the favorite pastime in the Benelux region. To capitalize on changing consumer preferences for do-it-yourself ethics, power tool manufacturers are focused on providing home users with compact, portable, and economical tool solutions.

This rapidly growing trend in the well-urbanized market, such as Benelux, is expected to create a significant opportunity in the household power tools segment over the forecast period. The household power tools segment is estimated to witness a CAGR of 3.5% through the forecast period (2023 to 2033).

Sales of power tools in Benelux are expected to rise as the electric instruments are considered the most optimum handheld devices and proved to be very effective when the operations need to be carried out manually and have great manual adjustments to meet the desired aesthetics of the end product. In addition to this, demand for the adoption of Benelux power tools is rising on account of significant growth in the industrial sectors all over the globe.

The adoption of the Benelux power tools market forms around 3-6% of its parent market, the global power tools market.

Benelux Power Tools Industry (From 2018 to 2022)

CAGR 4.3%
Market Size - 2018 US$ 922.2 million
Market Size - 2022 US$ 1043.40 million

Benelux Power Tools Industry (From 2023 to 2033)

CAGR 4.6%
Market Size - 2023 US$ 1,091.40 million
Market Size - 2033 US$ 1,711.30 million

Don't pay for what you don't need

Customize your report by selecting specific countries or regions and save 30%!

A Decade of Transformation: Assessing the Market Transformation from 2018 to 2022 and from 2023 to 2033

From 2018 to 2022, the adoption of Benelux power tools witnessed a moderate growth rate of 4.3% CAGR and is estimated to foresee a Y-O-Y growth of 5.3% in 2022. However, with the growing trend of do-it-yourself and increasing adoption of cordless power tools by end users, the adoption of the Benelux power tools market is set to grow at a CAGR of 4.6% between 2023 and 2033.

Power tools are actuated by an additional power source and mechanism other than the solely manual labor used with hands. These tools have greater accuracy, speed, and efficiency and help end users significantly improve overall productivity.

Factors such as increased consumer confidence, online sales of power tools, and easy availability of various products, especially portable power tools for home use, are expected to boost the adoption of the Benelux power tools market.

Similarly, rising automotive sales, increasing housing sector, emergency of cost-effective and durable products, and growing e-commerce retail sales are likely to contribute towards the expansion of adoption of the Benelux power tools market during the forecast period.

Power tool manufacturers seek a greater advantage by developing stronger pricing strategies. This new strategy is all about value, as seen with Makita and Milwaukee tools. Manufacturers know that customers turn to competitors when they can't provide the right tools or saws at the right price. Keeping low-demand tools on hand may increase inventory costs but may help retain that customer over the long term. The adoption of the Benelux power tools market is projected to grow by 1.3X by 2033 compared to 2023.

What are the Key Trends Spurring the Benelux Power Tools Market?

Various Benefits Offered by Power Tools Encouraging Their Adoption

Power tools can work 24/7 without any interruptions. These tools can provide service all day throughout the year with a very minimum occurrence of shut down for maintenance. Power tools excel in manufacturing, as they can give a greater production speed than hand tools to meet the requirements of the products and keep pace with the increment in the demand for products in the market.

Many end users looking to gain a prominent enhancement in terms of production rate could provide a substantial customer base for the power tools market during the projected course of time. The ability of the power tools to complete a long and meticulous cycle of operations is an ability that can improve customer inclination from hand tools to power tools.

Growing Popularity of Cordless Power Tools To Facilitate Growth in the Adoption of Benelux Power Tools Market

As per FMI, there has been a significant rise in demand for cordless power tools across Benelux nations during the last few years, and the trend is likely to continue during the forecast period.

People are keen to use these portable power tools for a wide range of applications as they reduce the need for extra wiring or external power sources.

Cordless power tools include a wide range of battery-powered devices. Demand for more portable, flexible, and compact tools drives the cordless tool market. Various advancements in battery technology have led to the spread of cordless power tools equipped with high-density batteries that have a longer life after charging.

According to the European Power Tool Association (EPTA), in 2018, the cordless power tools segment accounted for ~50% of the power tools market and is the fastest-growing business segment in Europe.

Lithium-ion batteries provide power tools with high energy density and long service life. These batteries are lightweight and do not self-discharge. As such, lithium-ion batteries are the most popular option for powering cordless power tools.

Consumer interest in cordless tools has led manufacturers to turn to cordless power tools and introduce innovative products to the power tool market. Therefore, key players' increasing demand for cordless power tools and product innovations is expected to create significant opportunities for power tools in the Benelux market.

Nikhil Kaitwade
Nikhil Kaitwade

Principal Consultant

Talk to Analyst

Find your sweet spots for generating winning opportunities in this market.

Category- Wise Outlook

Category Mode of Operation
Leading Segment Electric
Market Share 74.00%
Category End Use
Leading Segment Industrial
Market Share 80.00%

Why is Demand for Electric Power Tools Rising in The Adoption of The Benelux Power Tools Market?

Better Energy-Efficiency and Sustainable Nature of Electric Power Tools Encouraging their Adoption

By mode of operation, the electric segment may continue to dominate the adoption of the Benelux tools market during the forecast period, accounting 74% of the share on a value basis by 2033. This can be attributed to the growing adoption of electric power tools by end users on account of their various benefits.

Electric power tools are gaining wider popularity across industrial and household sectors due to their higher efficiency, simplicity, and sustainability. These power tools are more efficient and require less energy input.

Electric power tools allow users to carry out more specialized tasks and work with various materials. They perform the same functions as hand tools with considerably more efficiency and less effort. They are an excellent addition to workplaces like garages and offer quicker, cleaner, and less troublesome alternatives to hand tools.

Similarly, the growing popularity of cordless power tools to boost the growth of this segment during the forecast period.

Cordless power tools consist of rechargeable batteries as they are ideally used for things like welding and cutting. This shift to power tools reflects the desire for portable devices and may play a crucial role in accelerating growth in the adoption of the Benelux power tools market.

Which End-Use Segment will Contribute Most to the Adoption of Benelux Power Tools Market?

Sales of Benelux Power Tools to Remain High in the Industrial Sector

As per FMI, demand for Benelux power tools in the industrial segment is set to grow at a CAGR of 4.9% during the forecast period, creating a higher absolute dollar opportunity than the household power tools segment.

Industrial applications include using tools in the automotive, construction, aerospace, and logistics industries. Increasing innovation and introducing advanced technology in these industries are determinants of the dominance of industrial applications over the household segment. In the automotive and construction industries, power tools have the highest acceptance and are driving the growth of the industry segment.

The rapid expansion of industrial sectors across countries like the Netherlands and Belgium, along with the growing adoption of advanced tools, continues to support the growth of the adoption of the Benelux power tools market.

Regional Outlook

How will the Demand for Power Tools Grow in Luxembourg?

Rapid Expansion of Industrial Sector Triggering Market Growth in Luxembourg

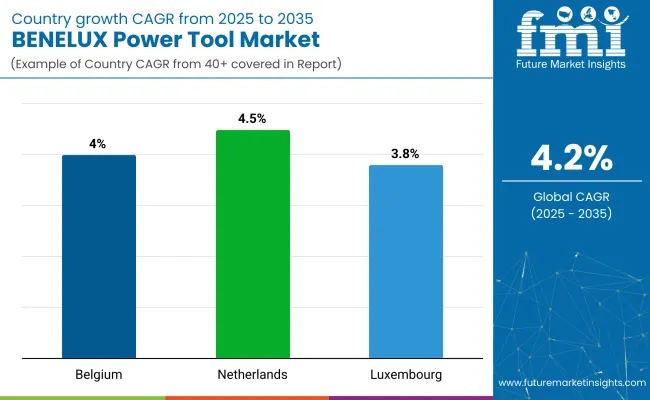
Luxembourg is expected to emerge as one of the key markets for power tools across Benelux during the forecast period, owing to the rapid expansion of industries such as steel manufacturing and automotive. FMI predicts power tools demand in Luxembourg to grow at a CAGR of 6.4% during the forecast period (2023 to 2033).

Luxembourg is centrally located in Europe and is a major gateway to European markets such as France, Germany, and Belgium. This unique geographical focus and favorable tax and regulatory framework are expected to provide significant business opportunities for market participants soon.

The rapid growth of the economy is expected to spur private investment in many sectors, such as infrastructure and construction, providing lucrative growth opportunities for market participants.

Where Does the Netherlands Stand in the Adoption of the Benelux Power Tools Market?

Growing Trend of Do-it-Yourself to Propel Power Tool Sales in the Netherlands

The Netherlands accounted for 59% of the Benelux power tools market adoption in 2023 and is likely to retain its dominance during the forecast period.

According to estimates, in 2020, the industrial sector contributed around 17% to the GDP of the Netherlands, which resulted in a substantial increase in demand for power tools in the Netherlands' industrial sector.

Similarly, the growing trend of do-it-yourself and the rising popularity of cordless power tools are expected to further boost market growth across the Netherlands during the forecast period. People in the country increasingly use cordless electric power tools such as electric chainsaws, nut runners, drills, etc. for various applications.

Get the data you need at a Fraction of the cost

Personalize your report by choosing insights you need
and save 40%!

What Marketing Tactics Can Manufacturers Utilize To Promote Adoption of the Benelux Power Tools Market?

  • Strategic influencer collaborations to promote power tools in the Benelux market.
  • Power tool capabilities and functions are demonstrated online.
  • Advertising on industry-specific platforms and websites.
  • Trade show presence to directly engage potential customers.
  • Promotional offers and discounts that are only available for a limited period to encourage buying.
  • Customer testimonials and success stories are used to establish trust and trustworthiness.
  • Loyalty programs that are tailored to attract repeat business.
  • Work with retailers to create in-store promotions and displays.
  • Content marketing based on instructive articles and films about power tool applications.
  • Social media initiatives to generate interest and engage the audience.

Competitive Landscape

The Benelux power tools market is experiencing significant growth due to increased demand for cordless power tools. Leading power tool manufacturers are working on advancing power tools that require minimal maintenance and can offer versatile operations at lower prices. The power tools market participants are focusing on providing products tailored to customer requirements with improved reliability and durability to gain a competitive advantage in the adoption of the Benelux power tools market.

  • In 2021, Stanley Black & Decker partnered with Eastman to create power tools with a sustainable focus. The company aims to launch a revival power tools line featuring Tritan Renew with 50% certified recycled content.
  • In 2020, Atlas Copco launched the SRB HA smart battery nut runner designed to deliver safer, faster, more cost-efficient, and traceable high torque bolt tightening for critical applications in the energy sector.

Stanley Black & Decker, Hilti Corporation, and Makita Corporation: Delivering the Master Piece Right Tool in Hand

Since 1843, Stanley Black & Decker has transformed and evolved to support and serve the world's creators, doers, and defenders. An American Fortune 500 company, Stanley Black & Decker, Inc., produces industrial tools, household hardware, and security devices. It concentrates on engineered fasteners and mechanical and electronic security, and its brands include Stanley, Black & Decker, FatMax, DeWalt, Bostitch, Porter-Cable, Facom, Emhart Technologies, Proto, Kwikset, and Mac.

Stanley Black & Decker constantly upgrades its product portfolio by launching new advanced products.

  • In October 2021, Stanley Black & Decker, Inc. collaborated with Eastman to achieve sustainability in the power tool sector. A new product line called Revival may be made available by BLACK+DECKER, a Stanley Black & Decker brand. It is the feature of the company's first power tools focused on sustainability and used Eastman's Tritan Renew copolyester.

Another leading manufacturer and provider of power tools are Hilti Corporation. A worldwide corporation based in Liechtenstein, Hilti Corporation (Hilti Aktiengesellschaft or Hilti AG, often known as Hilti Group) develops, produces, and markets goods primarily for professional end users for the manufacturing, construction, building maintenance, and energy sectors.

The major areas of focus include anchoring systems, fire prevention systems, installation systems, measurement and detecting instruments (like laser levels, range meters, and line lasers), power tools (like hammer drills, demolition hammers, diamond drills, cordless electric drills, heavy angle drills, and power saws), and associated software and services.

  • In December 2020, Hilti Corporation expanded its rotary and combination hammer tool portfolio with the next-generation TE 70-ATC/AVR, the most powerful SDS-Max combination hammer in its class. The new and improved tool to help commercial contractors and craftsmen drill up to 40% faster in reinforced concrete and demolish more concrete.

Makita Corporation is a leading Japanese power tool company continuously innovating to provide advanced power tools to its customers. Its headquarters are in Anj, Japan, and it has plants in Brazil, China, Japan, Mexico, Romania, the United Kingdom, Germany, United Arab Emirates, Thailand, and the United States. Makita's power tools are shipped in stacking boxes compatible with Systainer.

  • In December 2020, Makita Corporation introduced tiny commercial angle grinders with non-removable guards ranging from 4 to 1/2" / 5" in size (models GA4553R and GA5053R). The newly released angle grinders are suited for manufacturing, construction, and metal and concrete applications.

Key Players

  • Stanley Black & Decker Inc.
  • Atlas Copco AB
  • Snap-on Incorporated
  • Robert Bosch GmbH
  • Techtronic Industries Co. Ltd
  • Danaher Corporation
  • Makita Corporation
  • Actuant Corporation
  • Hitachi Koki Co. Ltd
  • SKF AB
  • Metabowerke GmbH
  • FERM B.V.
  • Einhell Germany AG
  • VIKING GmbH

Key Segments

By Mode of Operation:

  • Electric
  • Pneumatic
  • Others

By End Use:

  • Industrial
  • Household

By Country:

  • Belgium
  • Netherlands
  • Luxembourg

Frequently Asked Questions

What is the Growth Outlook of the Benelux Power Tools Market?

The Benelux power tools industry is likely to secure a CAGR of 4.6% through 2033.

What is the Current Valuation of the Benelux Power Tools Market?

The Benelux power tools industry to record a valuation of US$ 1,091.40 million in 2023.

How Much Can the Benelux Power Tools Market Develop by 2033?

The market size of power tools in Benelux to hit US$ 1.711 billion by 2033.

Table of Content
1. Executive Summary

    1.1. Global Market Outlook

    1.2. Demand-side Trends

    1.3. Supply-side Trends

    1.4. Technology Roadmap Analysis

    1.5. Analysis and Recommendations

2. Market Overview

    2.1. Market Coverage / Taxonomy

    2.2. Market Definition / Scope / Limitations

3. Market Background

    3.1. Market Dynamics

        3.1.1. Drivers

        3.1.2. Restraints

        3.1.3. Opportunity

        3.1.4. Trends

    3.2. Scenario Forecast

        3.2.1. Demand in Optimistic Scenario

        3.2.2. Demand in Likely Scenario

        3.2.3. Demand in Conservative Scenario

    3.3. Opportunity Map Analysis

    3.4. Product Life Cycle Analysis

    3.5. Supply Chain Analysis

        3.5.1. Supply Side Participants and their Roles

            3.5.1.1. Producers

            3.5.1.2. Mid-Level Participants (Traders/ Agents/ Brokers)

            3.5.1.3. Wholesalers and Distributors

        3.5.2. Value Added and Value Created at Node in the Supply Chain

        3.5.3. List of Raw Material Suppliers

        3.5.4. List of Existing and Potential Buyer’s

    3.6. Investment Feasibility Matrix

    3.7. Value Chain Analysis

        3.7.1. Profit Margin Analysis

        3.7.2. Wholesalers and Distributors

        3.7.3. Retailers

    3.8. PESTLE and Porter’s Analysis

    3.9. Regulatory Landscape

        3.9.1. By Key Regions

        3.9.2. By Key Countries

    3.10. Regional Parent Market Outlook

    3.11. Production and Consumption Statistics

    3.12. Import and Export Statistics

4. Global Market Analysis 2018 to 2022 and Forecast, 2023 to 2033

    4.1. Historical Market Size Value (US$ Million) & Volume (Units) Analysis, 2018 to 2022

    4.2. Current and Future Market Size Value (US$ Million) & Volume (Units) Projections, 2023 to 2033

        4.2.1. Y-o-Y Growth Trend Analysis

        4.2.2. Absolute $ Opportunity Analysis

5. Global Market Analysis 2018 to 2022 and Forecast 2023 to 2033, By Mode of Operation

    5.1. Introduction / Key Findings

    5.2. Historical Market Size Value (US$ Million) & Volume (Units) Analysis By Mode of Operation, 2018 to 2022

    5.3. Current and Future Market Size Value (US$ Million) & Volume (Units) Analysis and Forecast By Mode of Operation, 2023 to 2033

        5.3.1. Electric

        5.3.2. Pneumatic

        5.3.3. Others

    5.4. Y-o-Y Growth Trend Analysis By Mode of Operation, 2018 to 2022

    5.5. Absolute $ Opportunity Analysis By Mode of Operation, 2023 to 2033

6. Global Market Analysis 2018 to 2022 and Forecast 2023 to 2033, By End Use

    6.1. Introduction / Key Findings

    6.2. Historical Market Size Value (US$ Million) & Volume (Units) Analysis By End Use, 2018 to 2022

    6.3. Current and Future Market Size Value (US$ Million) & Volume (Units) Analysis and Forecast By End Use, 2023 to 2033

        6.3.1. Industrial

        6.3.2. Household

    6.4. Y-o-Y Growth Trend Analysis By End Use, 2018 to 2022

    6.5. Absolute $ Opportunity Analysis By End Use, 2023 to 2033

7. Global Market Analysis 2018 to 2022 and Forecast 2023 to 2033, By Region

    7.1. Introduction

    7.2. Historical Market Size Value (US$ Million) & Volume (Units) Analysis By Region, 2018 to 2022

    7.3. Current Market Size Value (US$ Million) & Volume (Units) Analysis and Forecast By Region, 2023 to 2033

        7.3.1. North America

        7.3.2. Latin America

        7.3.3. Western Europe

        7.3.4. Eastern Europe

        7.3.5. South Asia and Pacific

        7.3.6. East Asia

        7.3.7. Middle East and Africa

    7.4. Market Attractiveness Analysis By Region

8. North America Market Analysis 2018 to 2022 and Forecast 2023 to 2033, By Country

    8.1. Historical Market Size Value (US$ Million) & Volume (Units) Trend Analysis By Market Taxonomy, 2018 to 2022

    8.2. Market Size Value (US$ Million) & Volume (Units) Forecast By Market Taxonomy, 2023 to 2033

        8.2.1. By Country

            8.2.1.1. USA

            8.2.1.2. Canada

        8.2.2. By Mode of Operation

        8.2.3. By End Use

    8.3. Market Attractiveness Analysis

        8.3.1. By Country

        8.3.2. By Mode of Operation

        8.3.3. By End Use

    8.4. Key Takeaways

9. Latin America Market Analysis 2018 to 2022 and Forecast 2023 to 2033, By Country

    9.1. Historical Market Size Value (US$ Million) & Volume (Units) Trend Analysis By Market Taxonomy, 2018 to 2022

    9.2. Market Size Value (US$ Million) & Volume (Units) Forecast By Market Taxonomy, 2023 to 2033

        9.2.1. By Country

            9.2.1.1. Brazil

            9.2.1.2. Mexico

            9.2.1.3. Rest of Latin America

        9.2.2. By Mode of Operation

        9.2.3. By End Use

    9.3. Market Attractiveness Analysis

        9.3.1. By Country

        9.3.2. By Mode of Operation

        9.3.3. By End Use

    9.4. Key Takeaways

10. Western Europe Market Analysis 2018 to 2022 and Forecast 2023 to 2033, By Country

    10.1. Historical Market Size Value (US$ Million) & Volume (Units) Trend Analysis By Market Taxonomy, 2018 to 2022

    10.2. Market Size Value (US$ Million) & Volume (Units) Forecast By Market Taxonomy, 2023 to 2033

        10.2.1. By Country

            10.2.1.1. Germany

            10.2.1.2. UK

            10.2.1.3. France

            10.2.1.4. Spain

            10.2.1.5. Italy

            10.2.1.6. Rest of Western Europe

        10.2.2. By Mode of Operation

        10.2.3. By End Use

    10.3. Market Attractiveness Analysis

        10.3.1. By Country

        10.3.2. By Mode of Operation

        10.3.3. By End Use

    10.4. Key Takeaways

11. Eastern Europe Market Analysis 2018 to 2022 and Forecast 2023 to 2033, By Country

    11.1. Historical Market Size Value (US$ Million) & Volume (Units) Trend Analysis By Market Taxonomy, 2018 to 2022

    11.2. Market Size Value (US$ Million) & Volume (Units) Forecast By Market Taxonomy, 2023 to 2033

        11.2.1. By Country

            11.2.1.1. Poland

            11.2.1.2. Russia

            11.2.1.3. Czech Republic

            11.2.1.4. Romania

            11.2.1.5. Rest of Eastern Europe

        11.2.2. By Mode of Operation

        11.2.3. By End Use

    11.3. Market Attractiveness Analysis

        11.3.1. By Country

        11.3.2. By Mode of Operation

        11.3.3. By End Use

    11.4. Key Takeaways

12. South Asia and Pacific Market Analysis 2018 to 2022 and Forecast 2023 to 2033, By Country

    12.1. Historical Market Size Value (US$ Million) & Volume (Units) Trend Analysis By Market Taxonomy, 2018 to 2022

    12.2. Market Size Value (US$ Million) & Volume (Units) Forecast By Market Taxonomy, 2023 to 2033

        12.2.1. By Country

            12.2.1.1. India

            12.2.1.2. Bangladesh

            12.2.1.3. Australia

            12.2.1.4. New Zealand

            12.2.1.5. Rest of South Asia and Pacific

        12.2.2. By Mode of Operation

        12.2.3. By End Use

    12.3. Market Attractiveness Analysis

        12.3.1. By Country

        12.3.2. By Mode of Operation

        12.3.3. By End Use

    12.4. Key Takeaways

13. East Asia Market Analysis 2018 to 2022 and Forecast 2023 to 2033, By Country

    13.1. Historical Market Size Value (US$ Million) & Volume (Units) Trend Analysis By Market Taxonomy, 2018 to 2022

    13.2. Market Size Value (US$ Million) & Volume (Units) Forecast By Market Taxonomy, 2023 to 2033

        13.2.1. By Country

            13.2.1.1. China

            13.2.1.2. Japan

            13.2.1.3. South Korea

        13.2.2. By Mode of Operation

        13.2.3. By End Use

    13.3. Market Attractiveness Analysis

        13.3.1. By Country

        13.3.2. By Mode of Operation

        13.3.3. By End Use

    13.4. Key Takeaways

14. Middle East and Africa Market Analysis 2018 to 2022 and Forecast 2023 to 2033, By Country

    14.1. Historical Market Size Value (US$ Million) & Volume (Units) Trend Analysis By Market Taxonomy, 2018 to 2022

    14.2. Market Size Value (US$ Million) & Volume (Units) Forecast By Market Taxonomy, 2023 to 2033

        14.2.1. By Country

            14.2.1.1. GCC Countries

            14.2.1.2. South Africa

            14.2.1.3. Israel

            14.2.1.4. Rest of MEA

        14.2.2. By Mode of Operation

        14.2.3. By End Use

    14.3. Market Attractiveness Analysis

        14.3.1. By Country

        14.3.2. By Mode of Operation

        14.3.3. By End Use

    14.4. Key Takeaways

15. Key Countries Market Analysis

    15.1. USA

        15.1.1. Pricing Analysis

        15.1.2. Market Share Analysis, 2022

            15.1.2.1. By Mode of Operation

            15.1.2.2. By End Use

    15.2. Canada

        15.2.1. Pricing Analysis

        15.2.2. Market Share Analysis, 2022

            15.2.2.1. By Mode of Operation

            15.2.2.2. By End Use

    15.3. Brazil

        15.3.1. Pricing Analysis

        15.3.2. Market Share Analysis, 2022

            15.3.2.1. By Mode of Operation

            15.3.2.2. By End Use

    15.4. Mexico

        15.4.1. Pricing Analysis

        15.4.2. Market Share Analysis, 2022

            15.4.2.1. By Mode of Operation

            15.4.2.2. By End Use

    15.5. Germany

        15.5.1. Pricing Analysis

        15.5.2. Market Share Analysis, 2022

            15.5.2.1. By Mode of Operation

            15.5.2.2. By End Use

    15.6. UK

        15.6.1. Pricing Analysis

        15.6.2. Market Share Analysis, 2022

            15.6.2.1. By Mode of Operation

            15.6.2.2. By End Use

    15.7. France

        15.7.1. Pricing Analysis

        15.7.2. Market Share Analysis, 2022

            15.7.2.1. By Mode of Operation

            15.7.2.2. By End Use

    15.8. Spain

        15.8.1. Pricing Analysis

        15.8.2. Market Share Analysis, 2022

            15.8.2.1. By Mode of Operation

            15.8.2.2. By End Use

    15.9. Italy

        15.9.1. Pricing Analysis

        15.9.2. Market Share Analysis, 2022

            15.9.2.1. By Mode of Operation

            15.9.2.2. By End Use

    15.10. Poland

        15.10.1. Pricing Analysis

        15.10.2. Market Share Analysis, 2022

            15.10.2.1. By Mode of Operation

            15.10.2.2. By End Use

    15.11. Russia

        15.11.1. Pricing Analysis

        15.11.2. Market Share Analysis, 2022

            15.11.2.1. By Mode of Operation

            15.11.2.2. By End Use

    15.12. Czech Republic

        15.12.1. Pricing Analysis

        15.12.2. Market Share Analysis, 2022

            15.12.2.1. By Mode of Operation

            15.12.2.2. By End Use

    15.13. Romania

        15.13.1. Pricing Analysis

        15.13.2. Market Share Analysis, 2022

            15.13.2.1. By Mode of Operation

            15.13.2.2. By End Use

    15.14. India

        15.14.1. Pricing Analysis

        15.14.2. Market Share Analysis, 2022

            15.14.2.1. By Mode of Operation

            15.14.2.2. By End Use

    15.15. Bangladesh

        15.15.1. Pricing Analysis

        15.15.2. Market Share Analysis, 2022

            15.15.2.1. By Mode of Operation

            15.15.2.2. By End Use

    15.16. Australia

        15.16.1. Pricing Analysis

        15.16.2. Market Share Analysis, 2022

            15.16.2.1. By Mode of Operation

            15.16.2.2. By End Use

    15.17. New Zealand

        15.17.1. Pricing Analysis

        15.17.2. Market Share Analysis, 2022

            15.17.2.1. By Mode of Operation

            15.17.2.2. By End Use

    15.18. China

        15.18.1. Pricing Analysis

        15.18.2. Market Share Analysis, 2022

            15.18.2.1. By Mode of Operation

            15.18.2.2. By End Use

    15.19. Japan

        15.19.1. Pricing Analysis

        15.19.2. Market Share Analysis, 2022

            15.19.2.1. By Mode of Operation

            15.19.2.2. By End Use

    15.20. South Korea

        15.20.1. Pricing Analysis

        15.20.2. Market Share Analysis, 2022

            15.20.2.1. By Mode of Operation

            15.20.2.2. By End Use

    15.21. GCC Countries

        15.21.1. Pricing Analysis

        15.21.2. Market Share Analysis, 2022

            15.21.2.1. By Mode of Operation

            15.21.2.2. By End Use

    15.22. South Africa

        15.22.1. Pricing Analysis

        15.22.2. Market Share Analysis, 2022

            15.22.2.1. By Mode of Operation

            15.22.2.2. By End Use

    15.23. Israel

        15.23.1. Pricing Analysis

        15.23.2. Market Share Analysis, 2022

            15.23.2.1. By Mode of Operation

            15.23.2.2. By End Use

16. Market Structure Analysis

    16.1. Competition Dashboard

    16.2. Competition Benchmarking

    16.3. Market Share Analysis of Top Players

        16.3.1. By Regional

        16.3.2. By Mode of Operation

        16.3.3. By End Use

17. Competition Analysis

    17.1. Competition Deep Dive

        17.1.1. Stanley Black & Decker Inc.

            17.1.1.1. Overview

            17.1.1.2. Product Portfolio

            17.1.1.3. Profitability by Market Segments

            17.1.1.4. Sales Footprint

            17.1.1.5. Strategy Overview

                17.1.1.5.1. Marketing Strategy

                17.1.1.5.2. Product Strategy

                17.1.1.5.3. Channel Strategy

        17.1.2. Atlas Copco AB

            17.1.2.1. Overview

            17.1.2.2. Product Portfolio

            17.1.2.3. Profitability by Market Segments

            17.1.2.4. Sales Footprint

            17.1.2.5. Strategy Overview

                17.1.2.5.1. Marketing Strategy

                17.1.2.5.2. Product Strategy

                17.1.2.5.3. Channel Strategy

        17.1.3. Snap-on Incorporated

            17.1.3.1. Overview

            17.1.3.2. Product Portfolio

            17.1.3.3. Profitability by Market Segments

            17.1.3.4. Sales Footprint

            17.1.3.5. Strategy Overview

                17.1.3.5.1. Marketing Strategy

                17.1.3.5.2. Product Strategy

                17.1.3.5.3. Channel Strategy

        17.1.4. Robert Bosch GmbH

            17.1.4.1. Overview

            17.1.4.2. Product Portfolio

            17.1.4.3. Profitability by Market Segments

            17.1.4.4. Sales Footprint

            17.1.4.5. Strategy Overview

                17.1.4.5.1. Marketing Strategy

                17.1.4.5.2. Product Strategy

                17.1.4.5.3. Channel Strategy

        17.1.5. Techtronic Industries Co. Ltd

            17.1.5.1. Overview

            17.1.5.2. Product Portfolio

            17.1.5.3. Profitability by Market Segments

            17.1.5.4. Sales Footprint

            17.1.5.5. Strategy Overview

                17.1.5.5.1. Marketing Strategy

                17.1.5.5.2. Product Strategy

                17.1.5.5.3. Channel Strategy

        17.1.6. Danaher Corporation

            17.1.6.1. Overview

            17.1.6.2. Product Portfolio

            17.1.6.3. Profitability by Market Segments

            17.1.6.4. Sales Footprint

            17.1.6.5. Strategy Overview

                17.1.6.5.1. Marketing Strategy

                17.1.6.5.2. Product Strategy

                17.1.6.5.3. Channel Strategy

        17.1.7. Makita Corporation

            17.1.7.1. Overview

            17.1.7.2. Product Portfolio

            17.1.7.3. Profitability by Market Segments

            17.1.7.4. Sales Footprint

            17.1.7.5. Strategy Overview

                17.1.7.5.1. Marketing Strategy

                17.1.7.5.2. Product Strategy

                17.1.7.5.3. Channel Strategy

        17.1.8. Actuant Corporation

            17.1.8.1. Overview

            17.1.8.2. Product Portfolio

            17.1.8.3. Profitability by Market Segments

            17.1.8.4. Sales Footprint

            17.1.8.5. Strategy Overview

                17.1.8.5.1. Marketing Strategy

                17.1.8.5.2. Product Strategy

                17.1.8.5.3. Channel Strategy

        17.1.9. Hitachi Koki Co. Ltd

            17.1.9.1. Overview

            17.1.9.2. Product Portfolio

            17.1.9.3. Profitability by Market Segments

            17.1.9.4. Sales Footprint

            17.1.9.5. Strategy Overview

                17.1.9.5.1. Marketing Strategy

                17.1.9.5.2. Product Strategy

                17.1.9.5.3. Channel Strategy

        17.1.10. SKF AB

            17.1.10.1. Overview

            17.1.10.2. Product Portfolio

            17.1.10.3. Profitability by Market Segments

            17.1.10.4. Sales Footprint

            17.1.10.5. Strategy Overview

                17.1.10.5.1. Marketing Strategy

                17.1.10.5.2. Product Strategy

                17.1.10.5.3. Channel Strategy

        17.1.11. Metabowerke GmbH

            17.1.11.1. Overview

            17.1.11.2. Product Portfolio

            17.1.11.3. Profitability by Market Segments

            17.1.11.4. Sales Footprint

            17.1.11.5. Strategy Overview

                17.1.11.5.1. Marketing Strategy

                17.1.11.5.2. Product Strategy

                17.1.11.5.3. Channel Strategy

        17.1.12. FERM B.V.

            17.1.12.1. Overview

            17.1.12.2. Product Portfolio

            17.1.12.3. Profitability by Market Segments

            17.1.12.4. Sales Footprint

            17.1.12.5. Strategy Overview

                17.1.12.5.1. Marketing Strategy

                17.1.12.5.2. Product Strategy

                17.1.12.5.3. Channel Strategy

        17.1.13. Einhell Germany AG

            17.1.13.1. Overview

            17.1.13.2. Product Portfolio

            17.1.13.3. Profitability by Market Segments

            17.1.13.4. Sales Footprint

            17.1.13.5. Strategy Overview

                17.1.13.5.1. Marketing Strategy

                17.1.13.5.2. Product Strategy

                17.1.13.5.3. Channel Strategy

        17.1.14. VIKING GmbH

            17.1.14.1. Overview

            17.1.14.2. Product Portfolio

            17.1.14.3. Profitability by Market Segments

            17.1.14.4. Sales Footprint

            17.1.14.5. Strategy Overview

                17.1.14.5.1. Marketing Strategy

                17.1.14.5.2. Product Strategy

                17.1.14.5.3. Channel Strategy

18. Assumptions & Acronyms Used

19. Research Methodology
Recommendations

Industrial Automation

Power Tool Market

January 2021

REP-GB-760

October 2023

250 pages

Industrial Automation

Hand Tools Market

March 2022

REP-GB-1114

May 2023

315 pages

Explore Industrial Automation Insights

View Reports
Future Market Insights

Adoption of Benelux Power Tools Market