The bidirectional charging units market is expected to reach USD 490.5 million in 2025 and expand to USD 983.2 million by 2035, reflecting a CAGR of 7.2%. The profit pool shift over this decade highlights the changing nature of revenue concentration across stakeholders. In the early years, profitability is concentrated with hardware manufacturers and suppliers of charging equipment, as demand is largely driven by initial installations in residential, fleet, and public charging segments.
This phase reflects a product-focused profit pool, where margins are supported by premium pricing on advanced charging units capable of both vehicle-to-grid and vehicle-to-home functionalities. The global bidirectional charging units market is projected to grow from USD 490.5 million in 2025 to approximately USD 983.2 million by 2035, recording an absolute increase of USD 492.7 million over the forecast period. This translates into a total growth of 100.4%, with the market forecast to expand at a compound annual growth rate (CAGR) of 7.2% between 2025 and 2035.
The overall market size is expected to grow by nearly 2.0X during the same period, supported by revolutionary advances in electric vehicle infrastructure, explosive growth in renewable energy integration, and rising consumer focus on energy independence through intelligent bidirectional charging solutions.
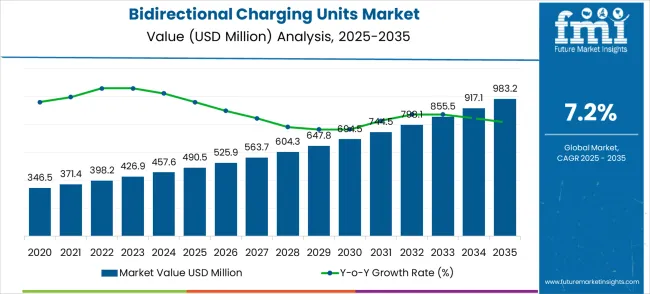
Between 2025 and 2030, the bidirectional charging units market is projected to expand from USD 490.5 million to USD 689.3 million, resulting in a value increase of USD 198.8 million, which represents 40.4% of the total forecast growth for the decade. This phase of growth will be shaped by the explosive adoption of vehicle-to-grid technologies, revolutionary advances in energy storage integration, and unprecedented development of smart grid infrastructure applications. Electric vehicle manufacturers and energy companies are investing massively in bidirectional charging capabilities to deliver energy independence solutions and grid stabilization services.
From 2030 to 2035, the market is forecast to grow from USD 689.3 million to USD 983.2 million, adding another USD 293.9 million, which constitutes 59.6% of the overall ten-year expansion. This period is expected to be characterized by mainstream adoption of vehicle-to-home systems, breakthrough developments in renewable energy integration, and revolutionary implementation of comprehensive energy management ecosystems. The growing focus on energy resilience and sustainable power solutions will drive unprecedented demand for intelligent bidirectional charging systems across multiple commercial and residential segments.
Between 2020 and 2025, the bidirectional charging units market experienced significant growth, driven by breakthrough advances in electric vehicle technology, the development of smart grid infrastructure, and increasing consumer awareness of the importance of energy independence and grid stability optimization.
| Metric | Value |
|---|---|
| Market Value (2025) | USD 490.5 million |
| Market Forecast Value (2035) | USD 983.2 million |
| Forecast CAGR (2025-2035) | 7.2% |
Between 2025 and 2030, the profit pool begins to expand toward service providers and energy companies, as revenue grows from USD 490.5 million to USD 694.5 million. This shift is driven by the monetization of energy flows, where bidirectional charging units are increasingly used for grid balancing, peak shaving, and demand response programs. Utilities and energy aggregators capture a larger share of profits by integrating charging units into broader energy management solutions. At the same time, software platforms and digital service providers begin to see rising margins, as data management and smart charging applications become critical to efficiency and performance.
From 2030 to 2035, when the market value grows from USD 694.5 million to USD 983.2 million, the profit pool shifts further toward recurring revenue models. Service-based platforms, subscription energy models, and software-enabled optimization become central profit generators. While hardware remains important, commoditization pressures reduce its share of profits, shifting more value toward digital services and grid-interactive functions. Energy retailers, fleet operators, and smart home integrators benefit from capturing ongoing revenue streams through charging-as-a-service offerings. This phase signifies the transition of the market from a hardware-led profit pool to a service-driven ecosystem, ensuring long-term profitability through recurring income and integrated energy management solutions.
Market expansion is being supported by revolutionary advances in electric vehicle infrastructure and energy management technologies, creating unprecedented opportunities for grid stabilization and energy independence optimization. Modern consumers and businesses increasingly demand intelligent charging solutions that enable bidirectional energy flow, support renewable energy integration, and provide backup power capabilities during grid outages. The integration of advanced power electronics with sophisticated energy management systems enables previously impossible levels of grid interaction and energy storage utilization.
The growing focus on renewable energy integration and grid modernization is driving massive demand for bidirectional charging units from leading technology companies with proven track records of innovation and grid infrastructure expertise. Utilities and energy companies are investing significantly in vehicle-to-grid technologies that offer superior grid stability while providing valuable services for electric vehicle owners and energy system operators. Energy management standards are establishing performance benchmarks that favor bidirectional charging systems with advanced grid integration capabilities and superior energy efficiency features.
The electric vehicle industry's transformation toward grid-interactive technologies is creating substantial demand for intelligent charging products that can deliver professional-grade energy management and grid stabilization through bidirectional power flow platforms. The energy sector continues to drive innovation in distributed energy resource applications while maintaining grid reliability and security, leading to the development of breakthrough bidirectional charging products with enhanced efficiency and comprehensive energy management capabilities.
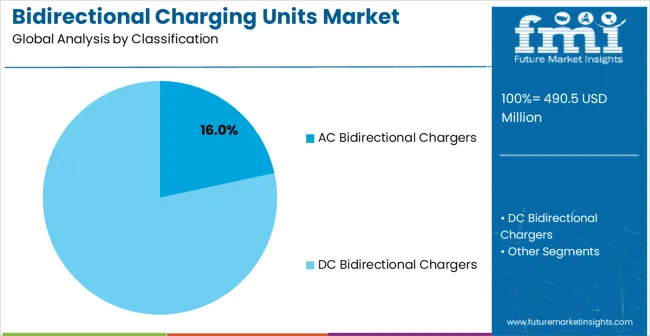
The market is segmented by charger type, application, and region. By charger type, the market is divided into AC bidirectional chargers, DC bidirectional chargers, and other configurations. Based on application, the market is categorized into vehicle-to-home (V2H), vehicle-to-grid (V2G), vehicle-to-building (V2B), and vehicle-to-load (V2L) applications. Regionally, the market is divided into North America, Europe, East Asia, South Asia & Pacific, Latin America, and the Middle East & Africa.
DC bidirectional charger configurations are projected to account for 58% of the bidirectional charging units market in 2025. This leading share is supported by the explosive adoption of fast charging capabilities and the growing demand for high-power energy transfer through advanced power electronics technology. DC bidirectional charging systems provide unprecedented energy management flexibility and grid integration capabilities, making them the preferred choice for commercial applications seeking comprehensive energy solutions and grid stabilization services. The segment benefits from revolutionary advances in power conversion technology, energy storage integration, and grid interface systems that have created entirely new categories of intelligent energy management devices.
Modern DC bidirectional chargers incorporate sophisticated power electronics and advanced energy management algorithms that enable real-time grid interaction, dynamic energy optimization, and seamless integration with renewable energy systems while ensuring high efficiency and reliable operation. These innovations have transformed commercial energy management while providing actionable capabilities for grid stability and energy cost optimization through continuous power flow control and intelligent grid interaction. The commercial energy market particularly drives demand for DC bidirectional solutions, as these applications require high-power energy transfer and reliable grid integration to deliver superior energy management and operational cost reduction.
Additionally, the utility and industrial sectors increasingly adopt advanced DC bidirectional charging technologies to optimize grid stability and support renewable energy integration through precise power flow control and energy storage management. The growing emphasis on grid modernization creates opportunities for specialized DC bidirectional chargers designed for utility-scale energy management and comprehensive grid stabilization applications.
Vehicle-to-grid (V2G) applications are expected to represent 42% of bidirectional charging units demand in 2025. This significant share reflects the massive utility market for grid stabilization services and growing investment in distributed energy resource technologies. V2G bidirectional charging systems enable electric vehicles to provide valuable grid services through intelligent energy discharge, grid frequency regulation, and peak demand management. The segment benefits from breakthrough advances in grid integration technology that make sophisticated energy services accessible and profitable for electric vehicle owners.
The global grid modernization revolution drives significant demand for V2G bidirectional charging systems that provide exceptional grid stability capabilities and intelligent energy management for utility operations and renewable energy integration. These applications require bidirectional charging systems with superior grid communication abilities and comprehensive energy management integration to ensure reliable grid services and effective demand response capabilities. The segment benefits from growing utility investment in distributed energy resources and increasing adoption of smart grid technologies and grid flexibility solutions.
Commercial fleet and utility sectors contribute substantially to market growth as organizations implement V2G bidirectional charging solutions in fleet operations and comprehensive energy management strategies. The growing adoption of renewable energy creates opportunities for specialized V2G bidirectional charging systems designed for grid balancing services and renewable energy storage management. Additionally, the trend toward energy independence drives demand for intelligent V2G systems that enable comprehensive grid interaction through integrated energy storage, renewable generation, and demand management capabilities.
The bidirectional charging units market is advancing steadily due to revolutionary electric vehicle infrastructure development and unprecedented adoption of smart grid technologies across all utility and commercial segments. However, the market faces challenges including high initial investment costs, need for robust grid integration standards, and varying regulatory requirements across different energy applications. Grid interconnection standards and utility regulations continue to influence product development and market adoption patterns.
The revolutionary advances in power conversion systems, energy management algorithms, and grid communication protocols are enabling unprecedented bidirectional energy flow while maintaining grid stability and energy efficiency standards. Advanced power electronics architectures and grid-specific control systems provide superior energy conversion and grid interaction capabilities, enabling dynamic energy management and optimized grid stability services. These technologies are particularly valuable for utility applications that require sophisticated grid integration, accurate power control, and reliable energy management services.
Modern bidirectional charging unit manufacturers are implementing breakthrough ecosystem integration and comprehensive energy management platform development that enables seamless grid interaction while supporting holistic energy optimization and renewable energy integration. Advanced platform architectures enable unified energy management, grid services provision, and renewable energy storage while ensuring grid stability and utility operational requirements.
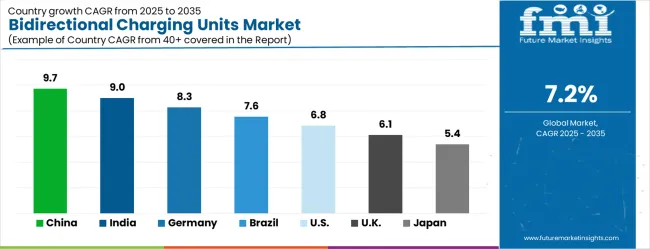
| Country | CAGR (2025-2035) |
|---|---|
| China | 9.7% |
| India | 9.0% |
| Germany | 8.3% |
| Brazil | 7.6% |
| United States | 6.8% |
| United Kingdom | 6.1% |
| Japan | 5.4% |
The bidirectional charging units market is experiencing strong growth, with China leading at an impressive 9.7% CAGR through 2035, driven by massive electric vehicle adoption and rapidly expanding smart grid infrastructure development. India follows at 9.0%, supported by enormous renewable energy potential and increasing grid modernization investment. Germany records exceptional growth at 8.3%, emphasizing energy transition excellence and advanced charging infrastructure development. Brazil grows significantly at 7.6%, benefiting from expanding electric mobility and renewable energy integration. The United States shows strong growth at 6.8%, focusing on grid modernization leadership and utility-scale energy applications. The United Kingdom maintains substantial expansion at 6.1%, supported by energy transition advancement. Japan demonstrates steady growth at 5.4%, emphasizing precision energy technology and grid stability innovation.
The report covers an in-depth analysis of 40+ countries; seven top-performing countries are highlighted below.
Revenue from bidirectional charging units in China is projected to exhibit the highest growth rate with a CAGR of 9.7% through 2035, driven by the country's position as a global electric vehicle powerhouse and massive domestic investment in smart grid infrastructure development. The extensive electric vehicle manufacturing capabilities and unprecedented investment in charging infrastructure are creating extraordinary opportunities for bidirectional charging technology adoption. Major automotive and energy companies are developing world-leading bidirectional charging capabilities to serve both the enormous domestic electric vehicle market and global energy infrastructure expansion while establishing leadership in vehicle-grid integration applications.
Revenue from bidirectional charging units in India is expanding at a CAGR of 9.0%, supported by the country's massive renewable energy potential and rapidly accelerating grid modernization across all regions and economic segments. The enormous solar and wind energy capacity addition and increasing electric vehicle adoption are driving extraordinary bidirectional charging system demand potential. Energy technology companies are leveraging India's vast renewable energy market while developing cost-effective bidirectional charging solutions to capture emerging opportunities in grid stabilization and energy storage applications.
Demand for bidirectional charging units in Germany is projected to grow at a CAGR of 8.3%, supported by the country's leadership in energy transition and advanced charging infrastructure development across automotive, utility, and renewable energy sectors. German energy technology companies are implementing sophisticated bidirectional charging development that meets stringent grid standards and efficiency requirements while delivering superior performance and system reliability. The market is characterized by focus on energy innovation, advanced technology integration, and compliance with comprehensive grid integration and energy efficiency regulations.
Revenue from bidirectional charging units in Brazil is growing at a CAGR of 7.6%, driven by expanding electric mobility adoption and increasing renewable energy integration across urban and emerging energy market segments. The growing electric vehicle awareness and increasing clean energy infrastructure development are creating substantial opportunities for bidirectional charging market development. Energy technology companies are adapting bidirectional charging products to support growing electric mobility demand and renewable energy integration while maintaining cost accessibility and local market relevance.
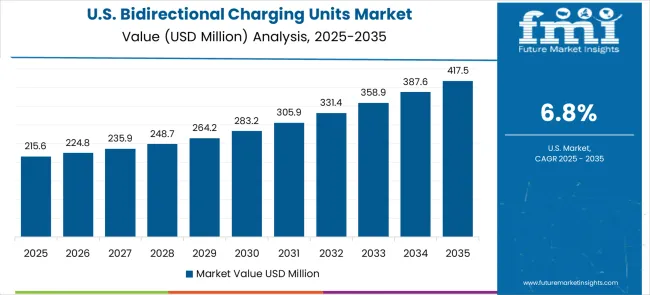
Demand for bidirectional charging units in the United States is expanding at a CAGR of 6.8%, driven by the country's grid modernization leadership and utility market demand for advanced energy management products and cutting-edge grid stability technologies. The sophisticated utility infrastructure and utility willingness to invest in advanced bidirectional charging systems create enormous demand for high-performance grid integration solutions. The market benefits from breakthrough grid technology research and utility-scale energy market segments across power, transportation, and industrial applications.
Demand for bidirectional charging units in the United Kingdom is projected to grow at a CAGR of 6.1%, supported by ongoing energy transition advancement and increasing utility demand for intelligent charging products in grid and commercial energy applications. Energy technology companies are investing in bidirectional charging development that provides advanced functionality while meeting grid reliability requirements and regulatory compliance for utility applications. The market is characterized by focus on energy innovation, grid stability protection, and advanced technology integration across diverse utility segments.
Demand for bidirectional charging units in Japan is expanding at a CAGR of 5.4%, driven by the country's emphasis on energy technology excellence and precision grid management across automotive, electronics, and energy sectors. Japanese energy technology companies are developing sophisticated bidirectional charging applications that incorporate precision engineering and grid optimization principles. The market benefits from focus on energy precision, technology reliability, and continuous innovation in grid stability and energy management integration.
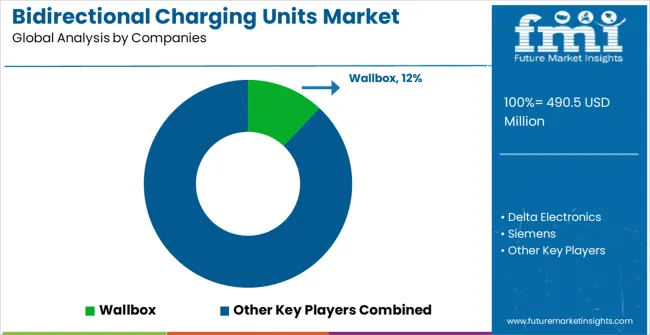
The bidirectional charging units market is defined by intense competition among automotive manufacturers, energy technology companies, and established power electronics specialists. Companies are investing significantly in power electronics research and development, advanced product design, grid integration validation, and energy management ecosystem development to deliver revolutionary, reliable, and grid-compatible bidirectional charging products. Strategic partnerships, technological breakthrough, and rapid market expansion are central to achieving market leadership and commercial adoption.
Wallbox, operating globally, offers comprehensive bidirectional charging solutions with focus on residential and commercial applications, grid integration capabilities, and seamless energy management across charging hardware, software platforms, and energy services. Delta Electronics, technology leader, provides advanced power electronics systems with emphasis on efficiency optimization, grid reliability, and intelligent energy management capabilities. Siemens delivers innovative bidirectional charging infrastructure with focus on comprehensive grid integration and industrial energy applications. Nissan offers pioneering vehicle-to-grid technology with advanced integration and electric vehicle ecosystem leadership.
EVTEC provides specialized bidirectional charging systems with emphasis on commercial and utility applications. Nuvve delivers advanced vehicle-to-grid platform services with sophisticated energy management and grid optimization capabilities. OVO Energy offers comprehensive energy management solutions with bidirectional charging integration and consumer energy services. Hitachi Energy provides utility-scale bidirectional charging infrastructure with advanced grid integration and energy management systems.
Enel Group, Mobility House, ABB, Rheinmetall, Heliox, Ideal Power, Rhombus Energy, Kempower, and JetChargeJET Charge offer specialized bidirectional charging expertise, innovative product development, and technical advancement across power electronics and energy management networks.
| Item | Value |
|---|---|
| Quantitative Units | USD 490.5 mMillion |
| Charger Type | AC Bidirectional Chargers, DC Bidirectional Chargers, Others |
| Application | Vehicle-to-Home (V2H), Vehicle-to-Grid (V2G), Vehicle-to-Building (V2B), Vehicle-to-Load (V2L) |
| Regions Covered | North America, Europe, East Asia, South Asia & Pacific, Latin America, Middle East & Africa |
| Country Covered | United States, Germany, India, China, United Kingdom, Japan, Brazil, and other 40+ countries |
| Key Companies Profiled | Wallbox, Delta Electronics, Siemens, Nissan, EVTEC, Nuvve, OVO Energy, Hitachi Energy, Enel Group, Mobility House, ABB, Rheinmetall, Heliox, Ideal Power, Rhombus Energy, Kempower, JetChargeJET Charge |
The global bidirectional charging units market is estimated to be valued at USD 490.5 million in 2025.
The market size for the bidirectional charging units market is projected to reach USD 983.2 million by 2035.
The bidirectional charging units market is expected to grow at a 7.2% CAGR between 2025 and 2035.
The key product types in bidirectional charging units market are ac bidirectional chargers and dc bidirectional chargers.
In terms of application, vehicle-to-home (v2h) segment to command 0.0% share in the bidirectional charging units market in 2025.


Our Research Products

The "Full Research Suite" delivers actionable market intel, deep dives on markets or technologies, so clients act faster, cut risk, and unlock growth.

The Leaderboard benchmarks and ranks top vendors, classifying them as Established Leaders, Leading Challengers, or Disruptors & Challengers.

Locates where complements amplify value and substitutes erode it, forecasting net impact by horizon

We deliver granular, decision-grade intel: market sizing, 5-year forecasts, pricing, adoption, usage, revenue, and operational KPIs—plus competitor tracking, regulation, and value chains—across 60 countries broadly.

Spot the shifts before they hit your P&L. We track inflection points, adoption curves, pricing moves, and ecosystem plays to show where demand is heading, why it is changing, and what to do next across high-growth markets and disruptive tech

Real-time reads of user behavior. We track shifting priorities, perceptions of today’s and next-gen services, and provider experience, then pace how fast tech moves from trial to adoption, blending buyer, consumer, and channel inputs with social signals (#WhySwitch, #UX).

Partner with our analyst team to build a custom report designed around your business priorities. From analysing market trends to assessing competitors or crafting bespoke datasets, we tailor insights to your needs.
Supplier Intelligence
Discovery & Profiling
Capacity & Footprint
Performance & Risk
Compliance & Governance
Commercial Readiness
Who Supplies Whom
Scorecards & Shortlists
Playbooks & Docs
Category Intelligence
Definition & Scope
Demand & Use Cases
Cost Drivers
Market Structure
Supply Chain Map
Trade & Policy
Operating Norms
Deliverables
Buyer Intelligence
Account Basics
Spend & Scope
Procurement Model
Vendor Requirements
Terms & Policies
Entry Strategy
Pain Points & Triggers
Outputs
Pricing Analysis
Benchmarks
Trends
Should-Cost
Indexation
Landed Cost
Commercial Terms
Deliverables
Brand Analysis
Positioning & Value Prop
Share & Presence
Customer Evidence
Go-to-Market
Digital & Reputation
Compliance & Trust
KPIs & Gaps
Outputs
Full Research Suite comprises of:
Market outlook & trends analysis
Interviews & case studies
Strategic recommendations
Vendor profiles & capabilities analysis
5-year forecasts
8 regions and 60+ country-level data splits
Market segment data splits
12 months of continuous data updates
DELIVERED AS:
PDF EXCEL ONLINE
Charging Nitrogen Gas Systems Market Size and Share Forecast Outlook 2025 to 2035
EV Charging Panelboard Market Forecast Outlook 2025 to 2035
EV Charging Tester Market Size and Share Forecast Outlook 2025 to 2035
EV Charging Cable Market Size and Share Forecast Outlook 2025 to 2035
EV Charging Management Software Platform Market Size and Share Forecast Outlook 2025 to 2035
EV Charging Station Market Analysis - Size, Share, and Forecast Outlook 2025 to 2035
eVTOL Charging Facilities Market Size and Share Forecast Outlook 2025 to 2035
Combined Charging System Market Size and Share Forecast Outlook 2025 to 2035
CV Depot Charging Market Size and Share Forecast Outlook 2025 to 2035
Wireless Charging ICs Market Size and Share Forecast Outlook 2025 to 2035
Wireless Charging Market Analysis 2025 to 2035 by Technology, Industry Vertical & Region
Magnetic Charging Cable Market Trends - Growth & Forecast 2025 to 2035
Portable Charging Units Market Size and Share Forecast Outlook 2025 to 2035
Wireless Ev Charging Market Size and Share Forecast Outlook 2025 to 2035
Automotive EV Charging Adapters Market
Micro-mobility Charging Infrastructure Market – Trends & Forecast 2025 to 2035
Electric Vehicle Charging Cable and Plug Market Size and Share Forecast Outlook 2025 to 2035
Electric Vehicle Charging Station Market Size and Share Forecast Outlook 2025 to 2035
Battery Swapping Charging Infrastructure Market Trends and Forecast 2025 to 2035
AC Electric Vehicle Charging Station Market Size and Share Forecast Outlook 2025 to 2035

Thank you!
You will receive an email from our Business Development Manager. Please be sure to check your SPAM/JUNK folder too.
Chat With
MaRIA