The eVTOL charging facilities market is expected to reach from USD 293.3 million in 2025 to USD 4,433.1 million by 2035, reflecting a CAGR of 31.2%. Breaking the decade into 5-year blocks highlights periods of rapid adoption and market expansion. In the first block, 2025 to 2030, the market grows from USD 293.3 million to approximately USD 1,080 million, driven by early deployment in urban air mobility projects and pilot programs in smart cities. Demand during this phase is fueled by the need for infrastructure to support emerging eVTOL fleets, with initial adoption concentrated in regions with regulatory support, established air taxi initiatives, and significant private investment.
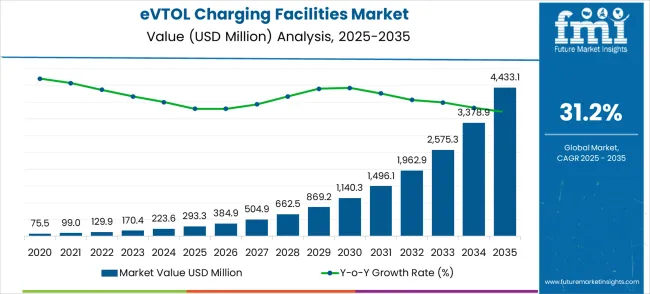
The second block, 2030 to 2035, sees accelerated growth as the market expands from USD 1,080 million to USD 4,433.1 million. During this phase, commercialization of eVTOL operations intensifies, requiring widespread charging infrastructure at vertiports, airports, and dedicated hubs.
Technological improvements, including high-capacity chargers, standardized connectors, and rapid charging systems, further support adoption. Expansion into emerging regions with growing urban air mobility projects adds additional revenue potential. The 5-year growth block analysis reveals an initial adoption phase, followed by exponential expansion, highlighting the importance of strategic infrastructure development, technological innovation, and regional rollout planning to capitalize on long-term market opportunities.
| Metric | Value |
|---|---|
| Estimated Value in (2025E) | USD 293.3 million |
| Forecast Value in (2035F) | USD 4,433.1 million |
| Forecast CAGR (2025 to 2035) | 31.2% |
The eVTOL charging facilities market is divided into urban air mobility hubs at 38%, regional airports at 27%, corporate and private vertiports at 18%, logistics and delivery hubs at 10%, and specialty applications such as emergency response and medical air transport at 7%. Urban air mobility hubs drive adoption, supporting rising demand for short-distance passenger flights and urban air taxi services. Regional airports are deploying charging infrastructure for next-generation electric aircraft operations. Corporate and private vertiports rely on facilities for fleet management, while logistics and delivery hubs use them to support cargo and drone operations. Specialty applications include emergency response, medical air transport, and disaster relief operations requiring fast eVTOL turnaround. Emerging trends include fast-charging solutions, wireless power integration, smart energy management, and renewable grid-connected systems. Developers are introducing modular, scalable, and weather-resistant units for diverse settings. Expansion in urban air mobility networks, regional transport hubs, and commercial eVTOL fleets is accelerating adoption. Partnerships among OEMs, energy providers, and city planners are enabling tailored, efficient, and reliable charging solutions. Focus on operational efficiency, safety, and energy optimization continues to drive global growth in eVTOL infrastructure.
The eVTOL charging facilities market represents one of the most explosive infrastructure opportunities of the next decade, with the market projected to grow from USD 293.3 million in 2025 to USD 4,433.1 million by 2035 at an extraordinary 31.2% CAGR a 15.1X expansion. This unprecedented growth trajectory is underpinned by the convergence of urban air mobility commercialization, massive government investments in smart city infrastructure, and the critical need for specialized aviation-grade charging solutions that can support rapid charging cycles while meeting stringent safety standards.
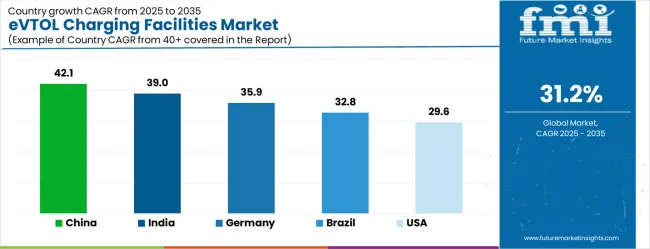
The market is transitioning from foundational development to commercial deployment, with portable charging systems leading adoption due to their operational flexibility during the nascent stages of eVTOL operations. Geographic opportunities are particularly compelling in China (42.1% CAGR) and India (39.0% CAGR), where urban mobility challenges and government support create ideal conditions for revolutionary transportation infrastructure. As eVTOL aircraft certification accelerates and urban air mobility pilot programs expand globally, charging infrastructure providers face unprecedented opportunities to establish market leadership in this transformative sector.
Pathway A - Portable Charging Infrastructure Leadership. Early-stage eVTOL operations require flexible, mobile charging solutions that can be deployed without permanent installations. Providers developing aviation-grade portable systems with rapid deployment capabilities, modular configurations, and multi-aircraft compatibility will capture the foundational market. Expected revenue pool: USD 1,200-1,800 million.
Pathway B - High-Power Rapid Charging Technology. Commercial eVTOL operations demand charging speeds that minimize turnaround time while ensuring battery safety and longevity. Advanced charging algorithms, thermal management, and power delivery systems enabling 15-20-minute charging cycles will command premium pricing and operational partnerships. Opportunity: USD 800-1,200 million.
Pathway C - Smart Grid Integration and Energy Management. Next-generation charging facilities require intelligent grid connectivity to optimize energy costs, provide grid stabilization services, and enable renewable energy integration. Systems offering demand response capabilities, energy storage integration, and peak shaving functionality create multiple revenue streams. Revenue uplift: USD 600-900 million.
Pathway D - Geographic Expansion in High-Growth Markets. Massive infrastructure investments in China, India, and other emerging markets create substantial first-mover advantages. Local partnerships, government relationships, and culturally adapted deployment models enable market penetration in regions planning comprehensive urban air mobility networks. Pool: USD 1,500-2,200 million.
Pathway E - Autonomous Charging and Operations Technology. Future eVTOL operations will require minimal human intervention, driving demand for fully automated charging systems with robotic connections, autonomous positioning, and integrated flight management connectivity. This technology differentiation enables premium service levels and operational cost reductions. Expected upside: USD 700-1,000 million.
Pathway F - Aviation Safety Certification and Compliance Leadership. Meeting stringent aviation safety standards, obtaining necessary certifications, and ensuring operational reliability creates significant barriers to entry while commanding premium pricing. Providers with comprehensive certification portfolios and proven safety records will dominate commercial deployments. USD 500-750 million.
Pathway G - Integrated Urban Air Mobility Ecosystems. Comprehensive solutions combining charging infrastructure with vertiport development, air traffic management integration, and multi-modal transportation connectivity create systemic competitive advantages. Infrastructure providers offering turnkey urban air mobility hubs will capture the highest-value opportunities. Pool: USD 800-1,200 million.
Pathway H - Military and Defense Applications. Specialized charging systems for military eVTOL operations, tactical deployment scenarios, and defense applications require ruggedized solutions with enhanced security features and rapid deployment capabilities. This segment offers stable, high-margin revenue with long-term contract potential. Expected revenue: USD 400-600 million.
Market expansion is being supported by the exponential growth of electric vertical takeoff and landing aircraft development and the corresponding demand for specialized charging infrastructure that can support rapid charging cycles, aviation safety standards, and operational efficiency requirements of urban air mobility systems. Modern aviation operators are increasingly focused on charging solutions that provide high-power delivery capabilities while meeting stringent aviation safety and reliability standards. eVTOL charging facilities' proven ability to deliver rapid charging, operational safety, and grid integration makes them essential infrastructure components for urban air mobility deployment and commercial aviation electrification initiatives.
The growing focus on eco-friendly urban transportation and the reduction of traffic congestion is driving demand for charging infrastructure that can support revolutionary aviation technologies and enable new forms of urban mobility. Operator preference for charging solutions that combine rapid charging capabilities with aviation-grade safety features and operational reliability is creating opportunities for innovative eVTOL charging implementations. The rising influence of government support for urban air mobility development and smart city initiatives is also contributing to increased adoption of eVTOL charging facilities that can provide comprehensive infrastructure support for next-generation aviation applications.
The eVTOL charging facilities market is expanding with the rapid adoption of electric vertical take-off and landing aircraft in urban air mobility. Stationary charging facilities dominate the segment with approximately 78% of the market share, offering high-capacity charging systems with power ratings typically ranging from 250–500 kW and charging times of 20–40 minutes per aircraft. In terms of application, commercial operations lead with around 83% of the market, reflecting the increasing use of eVTOLs for passenger transport, cargo delivery, and air taxi services. Growth is driven by the need for fast, reliable charging solutions to support operational efficiency and continuous fleet utilization.
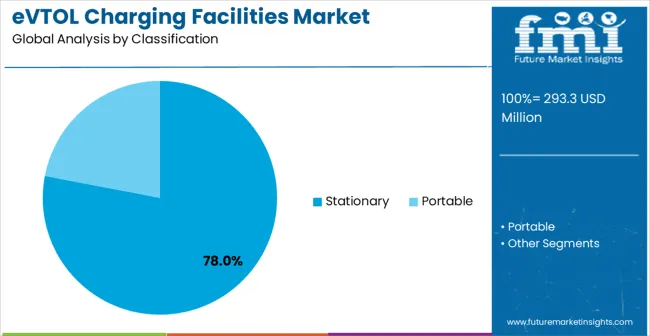
Stationary charging facilities hold roughly 78% of the charging facility type segment, making them the preferred solution for eVTOL operations. These high-power units typically deliver 250–500 kW and can charge an eVTOL aircraft within 20–40 minutes. Leading providers include Siemens, ABB, ChargePoint, and Heliogen. Stationary chargers are installed at vertiports and commercial hubs, offering robust thermal management, safety protocols, and compatibility with multiple eVTOL models. Their high capacity and reliability make them critical for sustaining continuous operations in commercial air mobility networks.
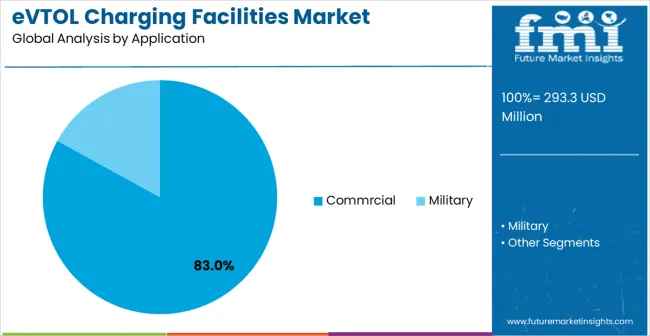
Commercial applications account for approximately 83% of the market, making them the largest segment for eVTOL charging facilities. Facilities are deployed at urban air mobility hubs, cargo terminals, and passenger vertiports to support high utilization rates and rapid turnaround. Providers such as Siemens, ABB, ChargePoint, and Heliogen design systems for continuous operation, multi-aircraft charging, and grid integration. Segment growth is fueled by rising demand for urban air taxis, express cargo services, and scheduled aerial commuting, requiring high-capacity, fast, and reliable charging infrastructure.
The eVTOL charging facilities market is advancing rapidly due to accelerating electric aviation development and increasing demand for specialized charging infrastructure that supports urban air mobility operations and next-generation aviation applications. The market faces challenges, including high infrastructure development costs, regulatory uncertainties regarding eVTOL operations, and technical complexities associated with aviation-grade charging systems and safety requirements. Innovation in charging technology and regulatory framework development continues to influence market development and deployment patterns.
The expanding urban air mobility sector and advancing eVTOL aircraft certification processes are enabling charging facilities to support revolutionary transportation applications where traditional aviation infrastructure cannot accommodate electric vertical aircraft requirements. Urban air mobility development provides enhanced market opportunities while allowing specialized charging solutions across various metropolitan transportation and logistics applications.
Modern eVTOL charging facility providers are incorporating high-power charging capabilities and smart grid integration to enhance infrastructure appeal and address operator concerns about charging speed, energy management, and operational efficiency. These technological enhancements improve charging value while enabling new market segments, including autonomous charging operations and energy-optimized aviation facilities requiring advanced power management and grid stabilization capabilities.
| Country | CAGR (2025-2035) |
|---|---|
| China | 42.1% |
| India | 39.0% |
| Germany | 35.9% |
| Brazil | 32.8% |
| USA | 29.6% |
| UK | 26.5% |
| Japan | 23.4% |
The eVTOL charging facilities market is experiencing extraordinary growth globally, with China leading at a 42.1% CAGR through 2035, driven by massive government investments in urban air mobility infrastructure, rapid development of smart city initiatives, and comprehensive support for electric aviation technology advancement. India follows closely at 39.0%, supported by expanding urban transportation challenges, increasing government focus on green mobility solutions, and growing investments in next-generation aviation infrastructure. Germany shows exceptional growth at 35.9%, prioritizing advanced engineering capabilities and comprehensive eVTOL development programs. Brazil records 32.8%, focusing on urban mobility innovation and infrastructure modernization initiatives. The United States shows 29.6% growth, prioritizing aviation technology leadership and comprehensive urban air mobility development. The United Kingdom demonstrates 26.5% growth, supported by advanced aviation regulation and infrastructure development programs. Japan shows 23.4% growth, prioritizing on precision technology integration and renewable transportation solutions.
The report covers detailed analysis of 40+ countries, with the top countries shared as a reference.
The eVTOL charging facilities market in China is projected to exhibit exceptional growth with a CAGR of 42.1% through 2035, driven by massive government investments in smart city development and advancing urban air mobility infrastructure programs requiring comprehensive charging solutions. The country's leadership in electric vehicle infrastructure and strong government support for next-generation transportation technologies are creating unprecedented demand for sophisticated eVTOL charging systems. Major domestic and international infrastructure developers are establishing comprehensive eVTOL charging capabilities to serve both domestic urban air mobility programs and global technology export opportunities.
The eVTOL charging facilities market in India is expanding at a CAGR of 39.0%, supported by the rapidly developing urban transportation infrastructure, expanding metropolitan challenges requiring innovative mobility solutions, and increasing government focus on sustainable transportation technologies. The country's growing urban population and strong focus on infrastructure modernization are driving requirements for revolutionary transportation solutions. International technology companies and domestic infrastructure developers are establishing comprehensive development and deployment capabilities to address the growing demand for urban air mobility infrastructure.
The eVTOL charging facilities market in Germany is projected to grow at a CAGR of 35.9% through 2035, prioritizing advanced engineering capabilities and comprehensive eVTOL development programs within Europe's leading aviation technology hub. The country's established aerospace industry and commitment to sustainable transportation solutions are driving sophisticated charging infrastructure requirements. German aviation companies and infrastructure developers consistently demand high-precision charging systems that meet stringent safety standards and provide superior integration capabilities with emerging urban air mobility networks.
The eVTOL charging facilities industry in Brazil is expanding at a CAGR of 32.8% through 2035, focusing on urban mobility innovation and infrastructure modernization initiatives across Latin America's largest aviation market. Brazilian organizations value innovative transportation solutions, operational flexibility, and proven infrastructure technologies, positioning eVTOL charging facilities as essential components for future urban transportation systems. The country's expanding metropolitan areas and increasing focus on sustainable mobility are creating sustained demand for advanced charging infrastructure.
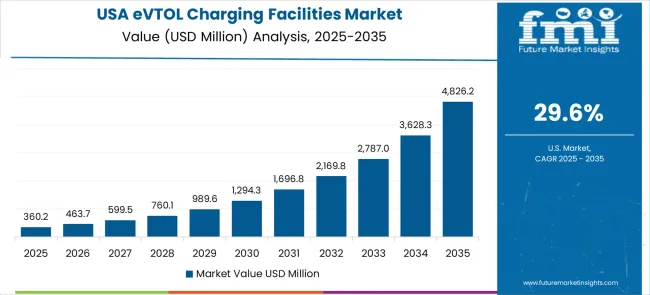
The eVTOL charging facilities market in the United States is projected to grow at a CAGR of 29.6% through 2035, driven by aviation technology leadership, comprehensive urban air mobility development programs, and advanced regulatory frameworks supporting emerging aviation infrastructure. American companies prioritize operational safety, technological innovation, and regulatory compliance, making eVTOL charging facilities a strategic choice for urban air mobility applications. The market benefits from established aviation infrastructure and sophisticated technology requirements.
The demand of eVTOL charging facilities in the United Kingdom is expanding at a CAGR of 26.5% through 2035, supported by advanced aviation regulation development, established aerospace industry expertise, and growing commitment to sustainable urban transportation solutions. British organizations value regulatory compliance, technological sophistication, and operational reliability, positioning eVTOL charging infrastructure as essential technology for future aviation applications.
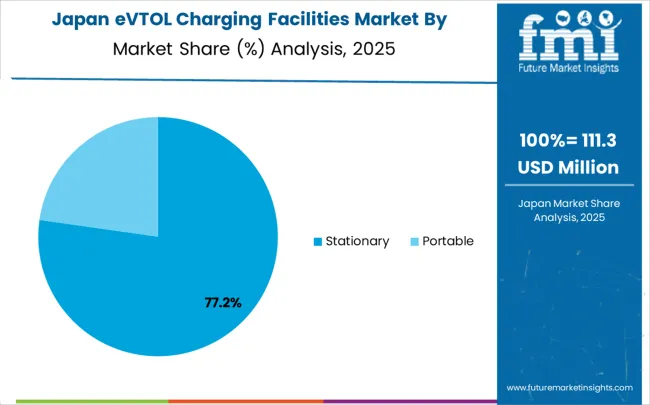
The eVTOL charging facilities industry in Japan is projected to grow at a CAGR of 23.4% through 2035, prioritizing on precision technology integration, advanced safety standards, and comprehensive quality control aligned with Japanese aviation excellence. Japanese organizations prioritize technological precision, safety reliability, and long-term operational performance, making eVTOL charging facilities a strategic choice for advanced transportation applications. The market is supported by sophisticated urban infrastructure and established aerospace technology capabilities.
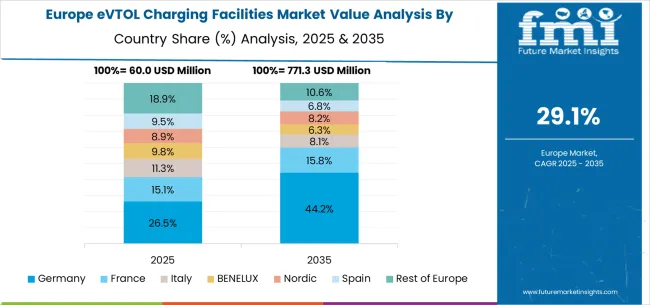
The eVTOL charging facilities market in Europe is projected to grow from USD 78.4 million in 2025 to USD 1,342.7 million by 2035, registering a CAGR of 34.2% over the forecast period. Germany is expected to maintain its leadership position with a 35.2% market share in 2025, projected to reach 36.8% by 2035, supported by its advanced aerospace engineering capabilities and comprehensive eVTOL development programs, including major initiatives in Munich, Hamburg, and Frankfurt metropolitan areas.
The United Kingdom follows with a 22.1% share in 2025, projected to reach 23.4% by 2035, driven by comprehensive urban air mobility regulatory frameworks and advanced aviation infrastructure development programs in London and other major urban centers. France holds an 18.6% share in 2025, expected to reach 19.2% by 2035 due to expanding aerospace technology development and urban transportation innovation initiatives. Italy commands a 12.3% share, while Spain accounts for 7.8% in 2025. The Rest of Europe region is anticipated to gain momentum, expanding its collective share from 4.0% to 4.2% by 2035, attributed to increasing eVTOL charging adoption in Nordic countries and emerging Eastern European markets implementing advanced transportation infrastructure development programs.
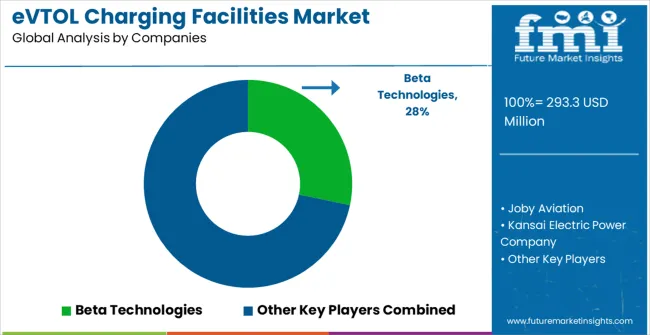
The eVTOL charging facilities market is characterized by competition among established aerospace technology companies, specialized charging infrastructure providers, and emerging urban air mobility technology developers. Companies are investing in high-power charging system development, aviation safety certification, smart grid integration capabilities, and comprehensive eVTOL-specific solutions to deliver rapid, safe, and operationally efficient charging experiences. Innovation in charging algorithms, autonomous charging systems, and integration with aviation management systems is central to strengthening market position and technology leadership.
Beta Technologies leads the market with comprehensive eVTOL charging solutions, offering integrated aircraft and charging infrastructure systems with a focus on operational safety and aviation certification standards. Joby Aviation provides specialized eVTOL charging technology with focus on commercial aviation applications and urban air mobility integration. Kansai Electric Power Company delivers advanced power management solutions with a focus on grid integration and energy optimization for aviation applications. Electro. Aero Pty Ltd focuses on portable charging solutions and flexible deployment capabilities for various eVTOL applications.
AeroVolt specializes in aviation-grade charging systems with focus on safety standards and operational reliability for commercial and military eVTOL applications. These companies are establishing comprehensive charging infrastructure networks and developing next-generation charging technologies to support the emerging eVTOL industry and urban air mobility commercialization efforts.
| Items | Values |
|---|---|
| Quantitative Units (2025) | USD 293.3 million |
| Charging Facility Type | Portable, Stationary |
| Application | Commercial, military |
| Regions Covered | North America, Latin America, Western Europe, Eastern Europe, East Asia, South Asia & Pacific, Middle East & Africa |
| Countries Covered | United States, Canada, United Kingdom, Germany, France, China, Japan, South Korea, Brazil, Australia and 40+ countries |
| Key Companies Profiled | Beta Technologies, Joby Aviation, Kansai Electric Power Company, Electro.Aero Pty Ltd, AeroVolt |
| Additional Attributes | Dollar sales by charging facility type and application, regional demand trends, competitive landscape, operator preferences for portable versus stationary charging solutions, integration with aviation safety systems and grid infrastructure, innovations in high-power charging technology and autonomous charging capabilities for diverse eVTOL applications |
The global eVTOL charging facilities market is estimated to be valued at USD 293.3 million in 2025.
The market size for the eVTOL charging facilities market is projected to reach USD 4,433.1 million by 2035.
The eVTOL charging facilities market is expected to grow at a 31.2% CAGR between 2025 and 2035.
The key product types in eVTOL charging facilities market are stationary and portable.
In terms of application, commrcial segment to command 83.0% share in the eVTOL charging facilities market in 2025.


Our Research Products

The "Full Research Suite" delivers actionable market intel, deep dives on markets or technologies, so clients act faster, cut risk, and unlock growth.

The Leaderboard benchmarks and ranks top vendors, classifying them as Established Leaders, Leading Challengers, or Disruptors & Challengers.

Locates where complements amplify value and substitutes erode it, forecasting net impact by horizon

We deliver granular, decision-grade intel: market sizing, 5-year forecasts, pricing, adoption, usage, revenue, and operational KPIs—plus competitor tracking, regulation, and value chains—across 60 countries broadly.

Spot the shifts before they hit your P&L. We track inflection points, adoption curves, pricing moves, and ecosystem plays to show where demand is heading, why it is changing, and what to do next across high-growth markets and disruptive tech

Real-time reads of user behavior. We track shifting priorities, perceptions of today’s and next-gen services, and provider experience, then pace how fast tech moves from trial to adoption, blending buyer, consumer, and channel inputs with social signals (#WhySwitch, #UX).

Partner with our analyst team to build a custom report designed around your business priorities. From analysing market trends to assessing competitors or crafting bespoke datasets, we tailor insights to your needs.
Supplier Intelligence
Discovery & Profiling
Capacity & Footprint
Performance & Risk
Compliance & Governance
Commercial Readiness
Who Supplies Whom
Scorecards & Shortlists
Playbooks & Docs
Category Intelligence
Definition & Scope
Demand & Use Cases
Cost Drivers
Market Structure
Supply Chain Map
Trade & Policy
Operating Norms
Deliverables
Buyer Intelligence
Account Basics
Spend & Scope
Procurement Model
Vendor Requirements
Terms & Policies
Entry Strategy
Pain Points & Triggers
Outputs
Pricing Analysis
Benchmarks
Trends
Should-Cost
Indexation
Landed Cost
Commercial Terms
Deliverables
Brand Analysis
Positioning & Value Prop
Share & Presence
Customer Evidence
Go-to-Market
Digital & Reputation
Compliance & Trust
KPIs & Gaps
Outputs
Full Research Suite comprises of:
Market outlook & trends analysis
Interviews & case studies
Strategic recommendations
Vendor profiles & capabilities analysis
5-year forecasts
8 regions and 60+ country-level data splits
Market segment data splits
12 months of continuous data updates
DELIVERED AS:
PDF EXCEL ONLINE
Charging Nitrogen Gas Systems Market Size and Share Forecast Outlook 2025 to 2035
EV Charging Panelboard Market Forecast Outlook 2025 to 2035
EV Charging Tester Market Size and Share Forecast Outlook 2025 to 2035
EV Charging Cable Market Size and Share Forecast Outlook 2025 to 2035
EV Charging Management Software Platform Market Size and Share Forecast Outlook 2025 to 2035
EV Charging Station Market Analysis - Size, Share, and Forecast Outlook 2025 to 2035
Laundry Facilities and Dry Cleaning Services Market analysis in United States Growth - Trends & Forecast 2025 to 2035
A Detailed Industry Analysis of Laundry Facilities and Dry Cleaning Services in the United States
Combined Charging System Market Size and Share Forecast Outlook 2025 to 2035
Portable Charging Units Market Size and Share Forecast Outlook 2025 to 2035
CV Depot Charging Market Size and Share Forecast Outlook 2025 to 2035
Wireless Charging ICs Market Size and Share Forecast Outlook 2025 to 2035
Wireless Charging Market Analysis 2025 to 2035 by Technology, Industry Vertical & Region
Magnetic Charging Cable Market Trends - Growth & Forecast 2025 to 2035
Wireless Ev Charging Market Size and Share Forecast Outlook 2025 to 2035
Bidirectional Charging Units Market Size and Share Forecast Outlook 2025 to 2035
Automotive EV Charging Adapters Market
Micro-mobility Charging Infrastructure Market – Trends & Forecast 2025 to 2035
Electric Vehicle Charging Cable and Plug Market Size and Share Forecast Outlook 2025 to 2035
Electric Vehicle Charging Station Market Size and Share Forecast Outlook 2025 to 2035

Thank you!
You will receive an email from our Business Development Manager. Please be sure to check your SPAM/JUNK folder too.
Chat With
MaRIA