Electric Vehicle Charging Station Market Size and Share Forecast Outlook 2025 to 2035

The electric vehicle charging station market is valued at USD 45.9 billion in 2025 and is anticipated to reach USD 284.2 billion by 2035, reflecting a CAGR of 20%. The multiplying factor is about 6.2x, showing that the market in 2035 will be over six times its 2025 base.

A compound absolute growth analysis demonstrates how rapid adoption, technology expansion, and regulatory support drive long-term market expansion. From 2025 to 2028, the market experiences strong initial growth due to increasing electric vehicle penetration, rising government incentives for charging infrastructure, and the expansion of fast-charging networks in urban and intercity corridors. During the mid-decade phase, from 2029 to 2032, growth continues at a slightly moderated pace as early infrastructure reaches maturity, while innovations in smart charging systems, wireless charging, and integrated energy management systems sustain demand.

From 2033 to 2035, the market accelerates again with widespread deployment of high-capacity stations, interoperability improvements, and increasing adoption of electric mobility in emerging regions. The compound absolute growth, combined with a multiplying factor of 6.2x, highlights a robust long-term upward trajectory, providing consistent opportunities for equipment manufacturers, service providers, and technology innovators in the EV ecosystem.
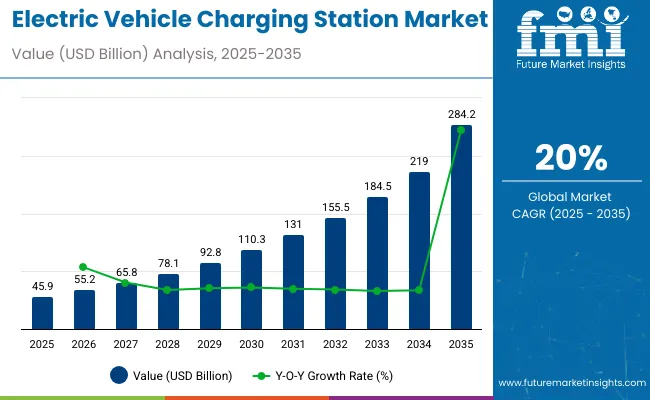
Quick Stats of Electric Vehicle Charging Station Market

  • Electric Vehicle Charging Station Market Size (2025): USD 45.9 billion
  • Projected Electric Vehicle Charging Station Market Size (2035): USD 284.2 billion
  • Forecast CAGR of Electric Vehicle Charging Station Market (2025 to 2035): 20%
  • Leading Segment of Electric Vehicle Charging Station Market (2025): Level 2 Charging
  • Key Growth Regions of Electric Vehicle Charging Station Market: North America, Europe, Asia Pacific
  • Top Key Players of Electric Vehicle Charging Station Market: ChargePoint, Inc., Blink Charging Co., Tesla, ABB, Siemens

Electric Vehicle Charging Station Market

Metric Value
Industry Size (2025E) USD 45.9 billion
Industry Value (2035F) USD 284.2 billion
CAGR (2025 to 2035) 20%

The market is influenced by several key sectors with varied contributions. The global automotive market accounts for around 34%, driven by rising electric vehicle production and consumer adoption. Energy and utilities make up approximately 26%, supplying electricity, grid integration, and renewable energy support. Industrial manufacturing contributes close to 21%, providing charging hardware, connectors, and installation components.

Information and communication technology (ICT) represents about 11%, enabling smart charging systems, remote monitoring, and data analytics. Transportation infrastructure, including road networks and urban planning, adds roughly 8%, facilitating station placement and accessibility. These sectors collectively support network expansion and EV adoption worldwide.

The EV charging station sector is seeing rapid innovation in fast-charging solutions, digital integration, and collaborative development. Companies like Tesla, ABB, ChargePoint, and Siemens are rolling out high-power chargers, interoperable platforms, and user-friendly interfaces. Integration with solar and energy storage enhances efficiency and reduces grid strain.

Public-private partnerships and policy incentives are driving growth of urban, highway, and commercial charging networks. IoT-enabled monitoring, AI-based energy management, and predictive maintenance are improving reliability and operational efficiency. Expansion of home, workplace, and fleet charging infrastructure continues to accelerate adoption and support the shift toward electric mobility.

Analyzing Electric Vehicle Charging Station Market by Top Investment Segments

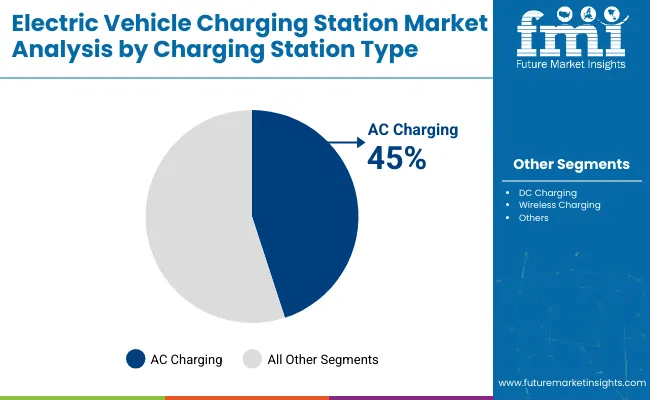
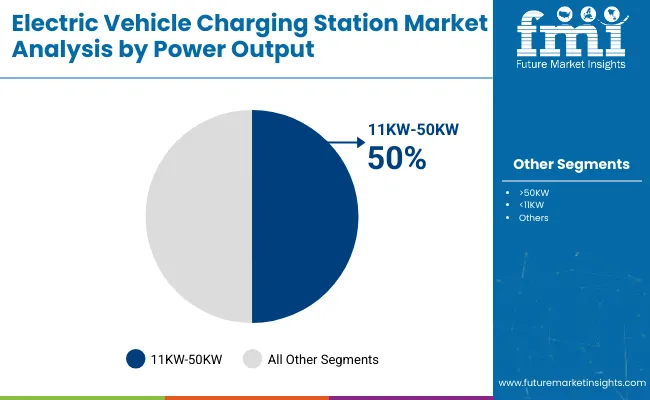
The electric vehicle charging station market is defined by level of charging, station type, power output, supplier, and vehicle type. Level 2 charging dominates with 50% share due to fast charging compatibility with most EVs, while AC charging accounts for 45% and DC 40% for high-speed requirements. Power output between 11KW-50KW leads at 50%. OE charging stations control 60% of supply, serving battery electric and plug-in hybrid vehicles that together represent 65% of demand. Growth is driven by rising EV adoption, infrastructure expansion, and demand for efficient, reliable charging solutions.
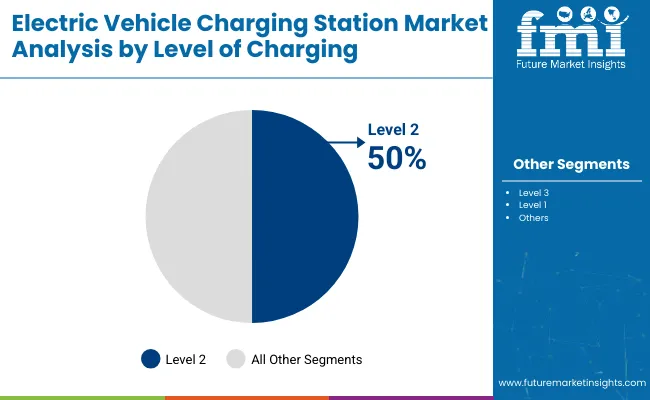
Level 2 Charging Leads Demand by Charging Level in 2025

Electric Vehicle Charging Station Market By Level

Level 2 charging stations account for 50% of market share, preferred for urban and residential EV usage due to moderate speed and compatibility with home and workplace installations. Level 3 fast chargers capture 30%, suited for highway corridors and fleet operations, while Level 1 represents 20% for slow, overnight charging. Manufacturers invest in smart charging technology and integrated payment systems to enhance user convenience. Level 2 stations offer optimal energy consumption per session and maintain cost efficiency for operators while supporting a majority of passenger electric vehicles in daily use.
  • Level 2 stations reduce charging time by nearly 60% compared to Level 1
  • Fast Level 3 chargers are deployed on high-traffic highways for long-distance travel
  • Smart connectivity allows load balancing to prevent grid overload

AC Charging Stations Likely to Dominate by 45% Market Share

Electric Vehicle Charging Station Market By Charging

AC charging stations lead with 45% share due to compatibility with most battery electric vehicles and cost-effective installation. DC charging holds 40%, preferred for fleet depots and high-speed corridors, while wireless charging represents 15% for emerging convenience applications. AC stations benefit from reduced installation complexity and operational stability for urban deployments. OEMs and private operators increasingly focus on hybrid networks combining AC and DC points to ensure flexibility and faster turnaround times. Adoption is rising in residential, commercial, and public parking spaces, supporting broader EV infrastructure expansion globally.
  • AC stations integrate seamlessly with standard EV connectors
  • DC fast charging reduces charging time to under an hour for most BEVs
  • Wireless charging trials target premium vehicles and urban zones

11KW-50KW Power Output Leads Demand in 2025

Electric Vehicle Charging Station Market By Power

Charging stations offering 11KW-50KW power output capture 50% of market share, supporting medium-speed charging for daily urban commutes. High-power stations over 50KW account for 30%, mainly installed along highways and express routes, while low-power stations below 11KW hold 20% for home and low-traffic areas. Mid-range chargers balance infrastructure cost, energy consumption, and charging speed. Operators and municipal authorities prioritize this segment to maximize accessibility while minimizing grid strain. These stations cater effectively to battery electric vehicles and plug-in hybrids, optimizing user convenience across urban, suburban, and commercial zones.
  • Medium-speed chargers provide 3-5 hours’ full charge for standard BEVs
  • High-power stations enable express charging for fleet and highway operations
  • Low-power stations serve overnight residential and workplace charging needs

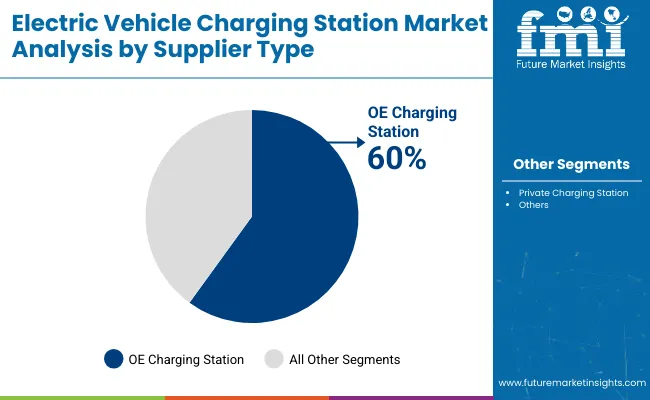
OE Charging Stations Capture 60% Market Share by Supplier Type

Electric Vehicle Charging Station Market By Supplier

Original equipment charging stations dominate with 60% share due to integrated EV manufacturer networks, ensuring reliability and customer trust. Private charging operators hold 40%, targeting commercial zones, residential complexes, and retail parking. OE stations offer standardized connectors, software integration, and maintenance support aligned with vehicle warranties.

Growing collaboration between OEMs and governments facilitates wider network coverage, enhancing charging accessibility and supporting long-term adoption. Investment in OE networks drives brand loyalty and consistent service quality while reducing operational downtime and improving utilization efficiency for both urban commuters and long-distance travelers.
  • OE stations provide warranty-aligned maintenance and software updates
  • Private networks expand access in residential and high-density commercial areas
  • OEM investments support city-to-city corridor development for BEVs

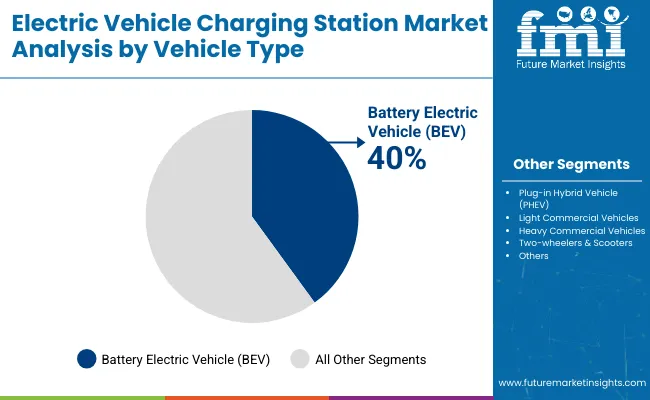
Battery Electric Vehicles Lead Charging Demand by Vehicle Type

Electric Vehicle Charging Station Market By Vehicle

Battery electric vehicles account for 40% of demand for charging infrastructure, driven by rapid adoption and longer range requirements. Plug-in hybrid vehicles contribute 25%, while light and heavy commercial vehicles together capture 25%. Two-wheelers and scooters hold 10% of demand, primarily in urban markets. Charging infrastructure aligns with vehicle type, ensuring optimized power delivery and minimal downtime. OE charging networks prioritize BEVs for fleet and personal use, while public and private operators focus on mixed-use solutions. The segment is poised for expansion alongside increasing EV penetration, regulatory support, and urban mobility initiatives.
  • BEV charging points dominate urban and intercity deployment strategies
  • PHEV stations support hybrid operation with moderate-range coverage
  • Commercial vehicle chargers facilitate logistics and fleet electrification projects

Top Countries Expanding, Deploying, and Leading in Electric Vehicle Charging Station Market

Electric Vehicle Charging Station Market By Country

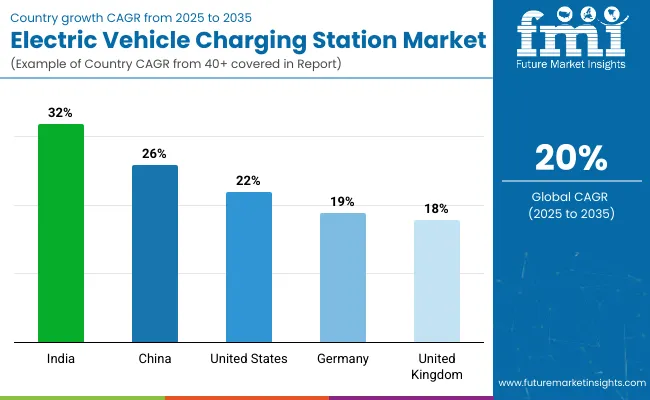
In 2025, the global electric vehicle charging station market is projected to grow at a CAGR of 20% through 2035. India leads at 32%, +60% above the global average, fueled by BRICS and ASEAN-linked initiatives and rapid adoption of electric mobility. China follows at 26%, +30% above the global rate, driven by BRICS-focused infrastructure expansion and government incentives for EV integration.

The United States records 22%, +10% above the global CAGR, reflecting steady OECD-backed deployment across established transport networks. Germany and the United Kingdom stand at 19% and 18%, −5% and −10% relative to the global average, supported by incremental upgrades in OECD charging infrastructure and clean energy programs. The BRICS nations are accelerating faster than OECD peers, with India and China shaping the global trajectory for EV charging networks.

Electric Vehicle Charging Station Market Growth Outlook in China

China is projected to grow at a CAGR of 26%, 6% higher than the global 20%. By 2030, China will host approximately 6 million charging stations, nearly 60% of global capacity. Fast chargers are expected to grow at a CAGR of 28%, and smart grid-enabled stations will cover 65% of the network. Investment in rural and semi-urban regions is expected to increase by 20%, supporting network reliability. High domestic EV production, government mandates, and strong local manufacturing drive growth beyond global averages.

  • High-capacity fast chargers expected to increase 28% by 2026
  • Smart grid-enabled stations projected to reach 65% of new installations
  • Rural network expansion forecast to grow 20%

Electric Vehicle Charging Station Market Demand Forecast in India

India is expanding at a CAGR of 32%, exceeding the global 20% by 12%. The total number of EV charging stations is projected to reach 2.5 million units by 2030. Fast charging infrastructure is expected to grow 35%, solar-powered stations will cover 40% of new installations, and highway corridor deployment will expand 30%. Aggressive FAME scheme rollout, rising electric two-wheeler adoption, and private sector investment explain the higher CAGR compared with global averages. Urban metro cities alone will account for 55% of total station installations by 2030.

  • Fast charging infrastructure projected to grow 35% by 2026
  • Solar-powered charging stations expected to cover 40% of new installations
  • Highway and urban network deployment forecast to rise 30%

Electric Vehicle Charging Station Market Analysis in the United States

The United States is growing at a CAGR of 22%, 2% above the global 20%. The total number of charging stations is projected to reach 1.5 million units by 2030. Fast charging hubs are expected to grow 24%, interoperable stations will cover 60% of new deployments, and grid-integrated smart stations will grow 22%. Higher federal and state funding compared with other Western markets supports growth. California, Texas, and the Northeast will host 50% of new stations, while EV adoption growth of 18% annually sustains higher-than-global CAGR.

  • Fast charging hubs projected to increase 24% by 2026
  • Interoperable charging solutions expected to cover 60% of new stations
  • Grid-integrated smart stations forecast to grow 22%

Electric Vehicle Charging Station Market Demand Analysis in Germany

Germany is growing at a CAGR of 19%, slightly below the global 20%. By 2030, total charging stations will reach 750,000 units. Ultra-fast charging stations will expand 20%, renewable energy-backed stations will cover 50% of new deployments, and urban plus highway networks will grow 18%. The lower CAGR reflects a mature existing network, high urban coverage, and a controlled expansion approach prioritizing efficiency over rapid scaling. Berlin, Munich, and Hamburg will account for 35% of new installations.

  • Ultra-fast charging stations projected to grow 20% by 2026
  • Renewable energy integration expected to cover 50% of new installations
  • Urban and highway station deployment forecast to rise 18%

Electric Vehicle Charging Station Market Forecast in the United Kingdom

The United Kingdom is growing at a CAGR of 18%, 2% below the global 20%. By 2030, total stations are projected to reach 500,000 units. Fast charging hubs will increase 20%, renewable energy-backed stations will cover 45% of new installations, and urban plus motorway network expansion will grow 17%. Slower adoption of EVs, limited highway coverage, and gradual infrastructure rollout explain the below-global CAGR. London, Manchester, and Birmingham will host 40% of new stations.
  • Fast charging hubs projected to increase 20% by 2026
  • Renewable energy-backed stations expected to cover 45% of new installations
  • Urban and motorway network expansion forecast to grow 17%

Leading Electric Vehicle Charging Station Manufacturers, Suppliers, Distributors

Electric Vehicle Charging Station Market By Company

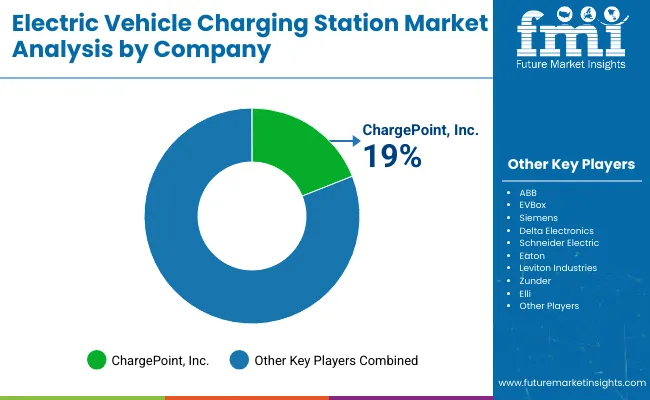
The electric vehicle charging station market is shaped by established manufacturers and emerging players, each employing different strategies to strengthen their position. Blink Charging Co. focuses on expanding its public charging network across North America, frequently launching new fast-charging stations in high-traffic areas. ChargePoint, Inc. emphasizes interoperability and cloud-based management systems, offering solutions for both commercial and residential users.

ABB invests in high-capacity chargers and modular designs, catering to fleet operators and urban mobility projects. EVBox continues to expand globally through partnerships and localized production, while Siemens and Delta Electronics target smart grid integration and high-efficiency chargers. Schneider Electric and Eaton provide energy management solutions that complement their charging stations, improving operational reliability.

Emerging players are also driving innovation and market penetration through targeted strategies. Zunder and Elli focus on user-friendly home and workplace chargers with integrated payment systems. CHAEVI and SIGNET EV emphasize cost-effective charging solutions for smaller fleets and urban centers. Vinfast and EV Top develop proprietary fast-charging infrastructure for their vehicle lines, while Tesla and NIO expand networks to support brand-specific vehicles.

Leviton Industries and Volta Industries Inc. combine hardware development with software management systems to improve user experience. These strategies, including product launches, partnerships, and regional expansion, allow companies to enhance coverage, improve operational efficiency, and maintain competitive positions in the global marketRecent Industry News

  • In July 2025, West Berkshire Council launched a new EV charging station at Newbury Station, aimed at meeting the needs of electric vehicle users in the UK.
  • In July 2025, V-Green inaugurated a fast-charging station in Hanoi, Vietnam, offering high-speed EV charging across the country.
  • In June 2025, Terra Charge partnered with the Airports Authority of India to establish an EV charging station at Agartala Airport.

Leading players

  • Blink Charging Co.
  • Elli
  • Zunder
  • ChargePoint, Inc.
  • ABB
  • EVBox
  • Siemens
  • Delta Electronics
  • CHAEVI
  • SIGNET EV
  • JOONGANG CONTROL
  • Vinfast
  • EV Top
  • Tesla & NIO
  • Schneider Electric
  • Volta Industries Inc.
  • Eaton
  • Leviton Industries

Report Scope

Report Attributes Details
Market Size (2025) USD 45.9 billion
Projected Market Size (2035) USD 284.2 billion
CAGR (2025 to 2035) 20%
Base Year for Estimation 2024
Historical Period 2020 to 2024
Projections Period 2025 to 2035
Quantitative Units USD billion for value
Level of Charging Analyzed (Segment 1) Level 1, Level 2, Level 3
Charging Station Type Analyzed (Segment 2) AC Charging, DC Charging, Wireless Charging
Power Output Analyzed (Segment 3) <11KW, 11KW-50KW, >50KW
Supplier Type Analyzed (Segment 4) OE Charging Station, Private Charging Station
Vehicle Type Analyzed (Segment 5) Battery Electric Vehicle (BEV), Plug-in Hybrid Vehicle (PHEV), Heavy Commercial Vehicles, Two-wheelers & Scooters, Light Commercial Vehicles
Installation Type Analyzed (Segment 6) Fixed, Portable, Residential, Commercial
Connector Type Analyzed (Segment 7) Normal Charging, Type 2, CCS, GB/T, CHAdeMO, Tesla SC
Application Segments Analyzed (Segment 8) Private, Public
Mounting Type Analyzed (Segment 9) Wall Mount, Pedestal Mount, Ceiling Mount
Charging Service Analyzed (Segment 10) EV Charging Service, Battery Swapping Service
End User Segments Analyzed (Segment 11) Commercial EV Charging Stations, Commercial Public EV Charging Stations, On-Road Charging, Parking Spaces, Destination Chargers, Commercial Private EV Charging Stations, Fleet Charging, Captive Charging, Residential EV Charging Stations
Regions Covered North America, Latin America, Western Europe, Eastern Europe, Asia Pacific, Middle East & Africa
Countries Covered United States, Canada, Brazil, Mexico, Germany, United Kingdom, France, Italy, China, Japan, India, UAE, South Africa, others
Key Players Blink Charging Co., Elli, Zunder, ChargePoint, Inc., ABB, EVBox, Siemens, Delta Electronics, CHAEVI, SIGNET EV, JOONGANG CONTROL, Vinfast, EV Top, Tesla, NIO, Schneider Electric, Volta Industries Inc., Eaton, Leviton Industries
Additional Attributes Dollar sales by charger type and location, demand dynamics across residential, commercial, and public charging, regional adoption trends across North America, Europe, and Asia-Pacific, innovation in fast-charging, smart grid integration, environmental impact of renewable energy use, emerging use cases in fleet electrification and highway networks

Electric Vehicle Charging Station Market Analyzed by Key Investment Segments

By Level of Charging:

  • Level 1
  • Level 2
  • Level 3

By Charging Station Type:

  • AC Charging
  • DC Charging
  • Wireless Charging

By Power Output:

  • <11KW
  • 11KW-50KW
  • >50KW

By Supplier Type:

  • OE Charging Station
  • Private Charging Station

By Vehicle Type:

  • Battery Electric Vehicle (BEV)
  • Plug-in Hybrid Vehicle (PHEV)
  • Heavy Commercial Vehicles
  • Two-wheelers & Scooters
  • Light Commercial Vehicles

By Installation Type:

  • Fixed
  • Portable
  • Residential
  • Commercial

By Connector Type:

  • Normal Charging
  • Type 2
  • CCS
  • GB/T
  • CHAdeMO
  • Tesla SC

By Application:

  • Private
  • Public

By Mounting Type:

  • Wall Mount
  • Pedestal Mount
  • Ceiling Mount

By Charging Service:

  • EV Charging Service
  • Battery Swapping Service

By End User:

  • Commercial EV Charging Stations
  • Commercial Public EV Charging Stations
  • On-Road Charging
  • Parking Spaces
  • Destination Chargers
  • Commercial Private EV Charging Stations
  • Fleet Charging
  • Captive Charging
  • Residential EV Charging Stations

By Region:

  • North America
  • Latin America
  • Western Europe
  • Eastern Europe
  • Asia Pacific
  • The Middle East and Africa

Table of Content

  1. Executive Summary
    • Global Market Outlook
    • Demand-side Trends
    • Supply-side Trends
    • Technology Roadmap Analysis
    • Analysis and Recommendations
  2. Market Overview
    • Market Coverage / Taxonomy
    • Market Definition / Scope / Limitations
  3. Market Background
    • Market Dynamics
      • Drivers
      • Restraints
      • Opportunity
      • Trends
    • Scenario Forecast
      • Demand in Optimistic Scenario
      • Demand in Likely Scenario
      • Demand in Conservative Scenario
    • Opportunity Map Analysis
    • Product Life Cycle Analysis
    • Supply Chain Analysis
      • Supply Side Participants and their Roles
        • Producers
        • Mid-Level Participants (Traders/ Agents/ Brokers)
        • Wholesalers and Distributors
      • Value Added and Value Created at Node in the Supply Chain
      • List of Raw Material Suppliers
      • List of Existing and Potential Buyer’s
    • Investment Feasibility Matrix
    • Value Chain Analysis
      • Profit Margin Analysis
      • Wholesalers and Distributors
      • Retailers
    • PESTLE and Porter’s Analysis
    • Regulatory Landscape
      • By Key Regions
      • By Key Countries
    • Regional Parent Market Outlook
    • Production and Consumption Statistics
    • Import and Export Statistics
  4. Global Market Analysis 2020 to 2024 and Forecast, 2025 to 2035
    • Historical Market Size Value (USD Billion) & Volume (Units) Analysis, 2020 to 2024
    • Current and Future Market Size Value (USD Billion) & Volume (Units) Projections, 2025 to 2035
      • Y-o-Y Growth Trend Analysis
      • Absolute $ Opportunity Analysis
  5. Global Market Pricing Analysis 2020 to 2024 and Forecast 2025 to 2035
  6. Global Market Analysis 2020 to 2024 and Forecast 2025 to 2035, By Level of Charging
    • Introduction / Key Findings
    • Historical Market Size Value (USD Billion) & Volume (Units) Analysis By Level of Charging, 2020 to 2024
    • Current and Future Market Size Value (USD Billion) & Volume (Units) Analysis and Forecast By Level of Charging, 2025 to 2035
      • Level 2
      • Level 3
      • Level 1
    • Y-o-Y Growth Trend Analysis By Level of Charging, 2020 to 2024
    • Absolute $ Opportunity Analysis By Level of Charging, 2025 to 2035
  7. Global Market Analysis 2020 to 2024 and Forecast 2025 to 2035, By Charging Station Type
    • Introduction / Key Findings
    • Historical Market Size Value (USD Billion) & Volume (Units) Analysis By Charging Station Type, 2020 to 2024
    • Current and Future Market Size Value (USD Billion) & Volume (Units) Analysis and Forecast By Charging Station Type, 2025 to 2035
      • AC Charging
      • DC Charging
      • Wireless Charging
    • Y-o-Y Growth Trend Analysis By Charging Station Type, 2020 to 2024
    • Absolute $ Opportunity Analysis By Charging Station Type, 2025 to 2035
  8. Global Market Analysis 2020 to 2024 and Forecast 2025 to 2035, By Power Output
    • Introduction / Key Findings
    • Historical Market Size Value (USD Billion) & Volume (Units) Analysis By Power Output, 2020 to 2024
    • Current and Future Market Size Value (USD Billion) & Volume (Units) Analysis and Forecast By Power Output, 2025 to 2035
      • 11KW-50KW
      • >50KW
      • <11KW
    • Y-o-Y Growth Trend Analysis By Power Output, 2020 to 2024
    • Absolute $ Opportunity Analysis By Power Output, 2025 to 2035
  9. Global Market Analysis 2020 to 2024 and Forecast 2025 to 2035, By Supplier Type
    • Introduction / Key Findings
    • Historical Market Size Value (USD Billion) & Volume (Units) Analysis By Supplier Type, 2020 to 2024
    • Current and Future Market Size Value (USD Billion) & Volume (Units) Analysis and Forecast By Supplier Type, 2025 to 2035
      • OE Charging Station
      • Private Charging Station
    • Y-o-Y Growth Trend Analysis By Supplier Type, 2020 to 2024
    • Absolute $ Opportunity Analysis By Supplier Type, 2025 to 2035
  10. Global Market Analysis 2020 to 2024 and Forecast 2025 to 2035, By Vehicle Type
    • Introduction / Key Findings
    • Historical Market Size Value (USD Billion) & Volume (Units) Analysis By Vehicle Type, 2020 to 2024
    • Current and Future Market Size Value (USD Billion) & Volume (Units) Analysis and Forecast By Vehicle Type, 2025 to 2035
      • Battery Electric Vehicle (BEV)
      • Plug-in Hybrid Vehicle (PHEV)
      • Light Commercial Vehicles
      • Heavy Commercial Vehicles
      • Two-wheelers & Scooters
    • Y-o-Y Growth Trend Analysis By Vehicle Type, 2020 to 2024
    • Absolute $ Opportunity Analysis By Vehicle Type, 2025 to 2035
  11. Global Market Analysis 2020 to 2024 and Forecast 2025 to 2035, By Application
    • Introduction / Key Findings
    • Historical Market Size Value (USD Billion) & Volume (Units) Analysis By Application, 2020 to 2024
    • Current and Future Market Size Value (USD Billion) & Volume (Units) Analysis and Forecast By Application, 2025 to 2035
      • Public
      • Private
    • Y-o-Y Growth Trend Analysis By Application, 2020 to 2024
    • Absolute $ Opportunity Analysis By Application, 2025 to 2035
  12. Global Market Analysis 2020 to 2024 and Forecast 2025 to 2035, By Installation Type
    • Introduction / Key Findings
    • Historical Market Size Value (USD Billion) & Volume (Units) Analysis By Installation Type, 2020 to 2024
    • Current and Future Market Size Value (USD Billion) & Volume (Units) Analysis and Forecast By Installation Type, 2025 to 2035
      • Fixed
      • Portable
      • Residential
      • Commercial
    • Y-o-Y Growth Trend Analysis By Installation Type, 2020 to 2024
    • Absolute $ Opportunity Analysis By Installation Type, 2025 to 2035
  13. Global Market Analysis 2020 to 2024 and Forecast 2025 to 2035, By Region
    • Introduction
    • Historical Market Size Value (USD Billion) & Volume (Units) Analysis By Region, 2020 to 2024
    • Current Market Size Value (USD Billion) & Volume (Units) Analysis and Forecast By Region, 2025 to 2035
      • North America
      • Latin America
      • Western Europe
      • Eastern Europe
      • East Asia
      • South Asia & Pacific
      • Middle East and Africa
    • Market Attractiveness Analysis By Region
  14. North America Market Analysis 2020 to 2024 and Forecast 2025 to 2035, By Country
    • Historical Market Size Value (USD Billion) & Volume (Units) Trend Analysis By Market Taxonomy, 2020 to 2024
    • Market Size Value (USD Billion) & Volume (Units) Forecast By Market Taxonomy, 2025 to 2035
      • By Country
        • USA
        • Canada
        • Mexico
      • By Level of Charging
      • By Charging Station Type
      • By Power Output
      • By Supplier Type
      • By Vehicle Type
      • By Application
      • By Installation Type
    • Market Attractiveness Analysis
      • By Country
      • By Level of Charging
      • By Charging Station Type
      • By Power Output
      • By Supplier Type
      • By Vehicle Type
      • By Application
      • By Installation Type
    • Key Takeaways
  15. Latin America Market Analysis 2020 to 2024 and Forecast 2025 to 2035, By Country
    • Historical Market Size Value (USD Billion) & Volume (Units) Trend Analysis By Market Taxonomy, 2020 to 2024
    • Market Size Value (USD Billion) & Volume (Units) Forecast By Market Taxonomy, 2025 to 2035
      • By Country
        • Brazil
        • Argentina
        • Rest of LATAM
      • By Level of Charging
      • By Charging Station Type
      • By Power Output
      • By Supplier Type
      • By Vehicle Type
      • By Application
      • By Installation Type
    • Market Attractiveness Analysis
      • By Country
      • By Level of Charging
      • By Charging Station Type
      • By Power Output
      • By Supplier Type
      • By Vehicle Type
      • By Application
      • By Installation Type
    • Key Takeaways
  16. Western Europe Market Analysis 2020 to 2024 and Forecast 2025 to 2035, By Country
    • Historical Market Size Value (USD Billion) & Volume (Units) Trend Analysis By Market Taxonomy, 2020 to 2024
    • Market Size Value (USD Billion) & Volume (Units) Forecast By Market Taxonomy, 2025 to 2035
      • By Country
        • Germany
        • Italy
        • France
        • UK
        • Spain
        • BENELUX
        • Nordic
        • Rest of W.Europe
      • By Level of Charging
      • By Charging Station Type
      • By Power Output
      • By Supplier Type
      • By Vehicle Type
      • By Application
      • By Installation Type
    • Market Attractiveness Analysis
      • By Country
      • By Level of Charging
      • By Charging Station Type
      • By Power Output
      • By Supplier Type
      • By Vehicle Type
      • By Application
      • By Installation Type
    • Key Takeaways
  17. Eastern Europe Market Analysis 2020 to 2024 and Forecast 2025 to 2035, By Country
    • Historical Market Size Value (USD Billion) & Volume (Units) Trend Analysis By Market Taxonomy, 2020 to 2024
    • Market Size Value (USD Billion) & Volume (Units) Forecast By Market Taxonomy, 2025 to 2035
      • By Country
        • Russia
        • Hungary
        • Poland
        • Balkan & Baltics
        • Rest of E. Europe
      • By Level of Charging
      • By Charging Station Type
      • By Power Output
      • By Supplier Type
      • By Vehicle Type
      • By Application
      • By Installation Type
    • Market Attractiveness Analysis
      • By Country
      • By Level of Charging
      • By Charging Station Type
      • By Power Output
      • By Supplier Type
      • By Vehicle Type
      • By Application
      • By Installation Type
    • Key Takeaways
  18. East Asia Market Analysis 2020 to 2024 and Forecast 2025 to 2035, By Country
    • Historical Market Size Value (USD Billion) & Volume (Units) Trend Analysis By Market Taxonomy, 2020 to 2024
    • Market Size Value (USD Billion) & Volume (Units) Forecast By Market Taxonomy, 2025 to 2035
      • By Country
        • China
        • Japan
        • South Korea
      • By Level of Charging
      • By Charging Station Type
      • By Power Output
      • By Supplier Type
      • By Vehicle Type
      • By Application
      • By Installation Type
    • Market Attractiveness Analysis
      • By Country
      • By Level of Charging
      • By Charging Station Type
      • By Power Output
      • By Supplier Type
      • By Vehicle Type
      • By Application
      • By Installation Type
    • Key Takeaways
  19. South Asia & Pacific Market Analysis 2020 to 2024 and Forecast 2025 to 2035, By Country
    • Historical Market Size Value (USD Billion) & Volume (Units) Trend Analysis By Market Taxonomy, 2020 to 2024
    • Market Size Value (USD Billion) & Volume (Units) Forecast By Market Taxonomy, 2025 to 2035
      • By Country
        • India
        • Australia & New Zealand
        • ASEAN
        • Rest of SAP
      • By Level of Charging
      • By Charging Station Type
      • By Power Output
      • By Supplier Type
      • By Vehicle Type
      • By Application
      • By Installation Type
    • Market Attractiveness Analysis
      • By Country
      • By Level of Charging
      • By Charging Station Type
      • By Power Output
      • By Supplier Type
      • By Vehicle Type
      • By Application
      • By Installation Type
    • Key Takeaways
  20. Middle East and Africa Market Analysis 2020 to 2024 and Forecast 2025 to 2035, By Country
    • Historical Market Size Value (USD Billion) & Volume (Units) Trend Analysis By Market Taxonomy, 2020 to 2024
    • Market Size Value (USD Billion) & Volume (Units) Forecast By Market Taxonomy, 2025 to 2035
      • By Country
        • GCC Countries
        • Northern Africa
        • South Africa
        • Turkiye
        • Rest of MEA
      • By Level of Charging
      • By Charging Station Type
      • By Power Output
      • By Supplier Type
      • By Vehicle Type
      • By Application
      • By Installation Type
    • Market Attractiveness Analysis
      • By Country
      • By Level of Charging
      • By Charging Station Type
      • By Power Output
      • By Supplier Type
      • By Vehicle Type
      • By Application
      • By Installation Type
    • Key Takeaways
  21. Key Countries Market Analysis
    • USA
      • Pricing Analysis
      • Market Share Analysis, 2024
        • By Level of Charging
        • By Charging Station Type
        • By Power Output
        • By Supplier Type
        • By Vehicle Type
        • By Application
        • By Installation Type
    • Canada
      • Pricing Analysis
      • Market Share Analysis, 2024
        • By Level of Charging
        • By Charging Station Type
        • By Power Output
        • By Supplier Type
        • By Vehicle Type
        • By Application
        • By Installation Type
    • Brazil
      • Pricing Analysis
      • Market Share Analysis, 2024
        • By Level of Charging
        • By Charging Station Type
        • By Power Output
        • By Supplier Type
        • By Vehicle Type
        • By Application
        • By Installation Type
    • Mexico
      • Pricing Analysis
      • Market Share Analysis, 2024
        • By Level of Charging
        • By Charging Station Type
        • By Power Output
        • By Supplier Type
        • By Vehicle Type
        • By Application
        • By Installation Type
    • Argentina
      • Pricing Analysis
      • Market Share Analysis, 2024
        • By Level of Charging
        • By Charging Station Type
        • By Power Output
        • By Supplier Type
        • By Vehicle Type
        • By Application
        • By Installation Type
  22. Market Structure Analysis
    • Competition Dashboard
    • Competition Benchmarking
    • Market Share Analysis of Top Players
      • By Regional
      • By Level of Charging
      • By Charging Station Type
      • By Power Output
      • By Supplier Type
      • By Vehicle Type
      • By Application
      • By Installation Type
  23. Competition Analysis
    • Competition Deep Dive
      • ChargePoint, Inc.
        • Overview
        • Product Portfolio
        • Profitability by Market Segments (Product/Age /Sales Channel/Region)
        • Sales Footprint
        • Strategy Overview
          • Marketing Strategy
          • Product Strategy
          • Channel Strategy
      • ABB
        • Overview
        • Product Portfolio
        • Profitability by Market Segments (Product/Age /Sales Channel/Region)
        • Sales Footprint
        • Strategy Overview
          • Marketing Strategy
          • Product Strategy
          • Channel Strategy
      • EVBox
        • Overview
        • Product Portfolio
        • Profitability by Market Segments (Product/Age /Sales Channel/Region)
        • Sales Footprint
        • Strategy Overview
          • Marketing Strategy
          • Product Strategy
          • Channel Strategy
      • Siemens
        • Overview
        • Product Portfolio
        • Profitability by Market Segments (Product/Age /Sales Channel/Region)
        • Sales Footprint
        • Strategy Overview
          • Marketing Strategy
          • Product Strategy
          • Channel Strategy
      • Delta Electronics
        • Overview
        • Product Portfolio
        • Profitability by Market Segments (Product/Age /Sales Channel/Region)
        • Sales Footprint
        • Strategy Overview
          • Marketing Strategy
          • Product Strategy
          • Channel Strategy
      • Schneider Electric
        • Overview
        • Product Portfolio
        • Profitability by Market Segments (Product/Age /Sales Channel/Region)
        • Sales Footprint
        • Strategy Overview
          • Marketing Strategy
          • Product Strategy
          • Channel Strategy
      • Eaton
        • Overview
        • Product Portfolio
        • Profitability by Market Segments (Product/Age /Sales Channel/Region)
        • Sales Footprint
        • Strategy Overview
          • Marketing Strategy
          • Product Strategy
          • Channel Strategy
      • Leviton Industries
        • Overview
        • Product Portfolio
        • Profitability by Market Segments (Product/Age /Sales Channel/Region)
        • Sales Footprint
        • Strategy Overview
          • Marketing Strategy
          • Product Strategy
          • Channel Strategy
      • Zunder
        • Overview
        • Product Portfolio
        • Profitability by Market Segments (Product/Age /Sales Channel/Region)
        • Sales Footprint
        • Strategy Overview
          • Marketing Strategy
          • Product Strategy
          • Channel Strategy
      • Elli
        • Overview
        • Product Portfolio
        • Profitability by Market Segments (Product/Age /Sales Channel/Region)
        • Sales Footprint
        • Strategy Overview
          • Marketing Strategy
          • Product Strategy
          • Channel Strategy
      • CHAEVI
        • Overview
        • Product Portfolio
        • Profitability by Market Segments (Product/Age /Sales Channel/Region)
        • Sales Footprint
        • Strategy Overview
          • Marketing Strategy
          • Product Strategy
          • Channel Strategy
      • SIGNET EV
        • Overview
        • Product Portfolio
        • Profitability by Market Segments (Product/Age /Sales Channel/Region)
        • Sales Footprint
        • Strategy Overview
          • Marketing Strategy
          • Product Strategy
          • Channel Strategy
      • JOONGANG CONTROL
        • Overview
        • Product Portfolio
        • Profitability by Market Segments (Product/Age /Sales Channel/Region)
        • Sales Footprint
        • Strategy Overview
          • Marketing Strategy
          • Product Strategy
          • Channel Strategy
      • Vinfast
        • Overview
        • Product Portfolio
        • Profitability by Market Segments (Product/Age /Sales Channel/Region)
        • Sales Footprint
        • Strategy Overview
          • Marketing Strategy
          • Product Strategy
          • Channel Strategy
      • EV Top
        • Overview
        • Product Portfolio
        • Profitability by Market Segments (Product/Age /Sales Channel/Region)
        • Sales Footprint
        • Strategy Overview
          • Marketing Strategy
          • Product Strategy
          • Channel Strategy
      • Tesla & NIO
        • Overview
        • Product Portfolio
        • Profitability by Market Segments (Product/Age /Sales Channel/Region)
        • Sales Footprint
        • Strategy Overview
          • Marketing Strategy
          • Product Strategy
          • Channel Strategy
      • Volta Industries Inc.
        • Overview
        • Product Portfolio
        • Profitability by Market Segments (Product/Age /Sales Channel/Region)
        • Sales Footprint
        • Strategy Overview
          • Marketing Strategy
          • Product Strategy
          • Channel Strategy
  24. Assumptions & Acronyms Used
  25. Research Methodology

List of Tables

  • Table 1: Global Market Value (USD Billion) Forecast by Region, 2020-2035
  • Table 2: Global Market Volume (Units) Forecast by Region, 2020-2035
  • Table 3: Global Market Value (USD Billion) Forecast by Level of Charging, 2020-2035
  • Table 4: Global Market Volume (Units) Forecast by Level of Charging, 2020-2035
  • Table 5: Global Market Value (USD Billion) Forecast by Charging Station Type, 2020-2035
  • Table 6: Global Market Volume (Units) Forecast by Charging Station Type, 2020-2035
  • Table 7: Global Market Value (USD Billion) Forecast by Power Output, 2020-2035
  • Table 8: Global Market Volume (Units) Forecast by Power Output, 2020-2035
  • Table 9: Global Market Value (USD Billion) Forecast by Supplier Type, 2020-2035
  • Table 10: Global Market Volume (Units) Forecast by Supplier Type, 2020-2035
  • Table 11: Global Market Value (USD Billion) Forecast by Vehicle Type, 2020-2035
  • Table 12: Global Market Volume (Units) Forecast by Vehicle Type, 2020-2035
  • Table 13: Global Market Value (USD Billion) Forecast by Application, 2020-2035
  • Table 14: Global Market Volume (Units) Forecast by Application, 2020-2035
  • Table 15: Global Market Value (USD Billion) Forecast by Installation Type, 2020-2035
  • Table 16: Global Market Volume (Units) Forecast by Installation Type, 2020-2035
  • Table 17: North America Market Value (USD Billion) Forecast by Country, 2020-2035
  • Table 18: North America Market Volume (Units) Forecast by Country, 2020-2035
  • Table 19: North America Market Value (USD Billion) Forecast by Level of Charging, 2020-2035
  • Table 20: North America Market Volume (Units) Forecast by Level of Charging, 2020-2035
  • Table 21: North America Market Value (USD Billion) Forecast by Charging Station Type, 2020-2035
  • Table 22: North America Market Volume (Units) Forecast by Charging Station Type, 2020-2035
  • Table 23: North America Market Value (USD Billion) Forecast by Power Output, 2020-2035
  • Table 24: North America Market Volume (Units) Forecast by Power Output, 2020-2035
  • Table 25: North America Market Value (USD Billion) Forecast by Supplier Type, 2020-2035
  • Table 26: North America Market Volume (Units) Forecast by Supplier Type, 2020-2035
  • Table 27: North America Market Value (USD Billion) Forecast by Vehicle Type, 2020-2035
  • Table 28: North America Market Volume (Units) Forecast by Vehicle Type, 2020-2035
  • Table 29: North America Market Value (USD Billion) Forecast by Application, 2020-2035
  • Table 30: North America Market Volume (Units) Forecast by Application, 2020-2035
  • Table 31: North America Market Value (USD Billion) Forecast by Installation Type, 2020-2035
  • Table 32: North America Market Volume (Units) Forecast by Installation Type, 2020-2035
  • Table 33: Latin America Market Value (USD Billion) Forecast by Country, 2020-2035
  • Table 34: Latin America Market Volume (Units) Forecast by Country, 2020-2035
  • Table 35: Latin America Market Value (USD Billion) Forecast by Level of Charging, 2020-2035
  • Table 36: Latin America Market Volume (Units) Forecast by Level of Charging, 2020-2035
  • Table 37: Latin America Market Value (USD Billion) Forecast by Charging Station Type, 2020-2035
  • Table 38: Latin America Market Volume (Units) Forecast by Charging Station Type, 2020-2035
  • Table 39: Latin America Market Value (USD Billion) Forecast by Power Output, 2020-2035
  • Table 40: Latin America Market Volume (Units) Forecast by Power Output, 2020-2035
  • Table 41: Latin America Market Value (USD Billion) Forecast by Supplier Type, 2020-2035
  • Table 42: Latin America Market Volume (Units) Forecast by Supplier Type, 2020-2035
  • Table 43: Latin America Market Value (USD Billion) Forecast by Vehicle Type, 2020-2035
  • Table 44: Latin America Market Volume (Units) Forecast by Vehicle Type, 2020-2035
  • Table 45: Latin America Market Value (USD Billion) Forecast by Application, 2020-2035
  • Table 46: Latin America Market Volume (Units) Forecast by Application, 2020-2035
  • Table 47: Latin America Market Value (USD Billion) Forecast by Installation Type, 2020-2035
  • Table 48: Latin America Market Volume (Units) Forecast by Installation Type, 2020-2035
  • Table 49: Western Europe Market Value (USD Billion) Forecast by Country, 2020-2035
  • Table 50: Western Europe Market Volume (Units) Forecast by Country, 2020-2035
  • Table 51: Western Europe Market Value (USD Billion) Forecast by Level of Charging, 2020-2035
  • Table 52: Western Europe Market Volume (Units) Forecast by Level of Charging, 2020-2035
  • Table 53: Western Europe Market Value (USD Billion) Forecast by Charging Station Type, 2020-2035
  • Table 54: Western Europe Market Volume (Units) Forecast by Charging Station Type, 2020-2035
  • Table 55: Western Europe Market Value (USD Billion) Forecast by Power Output, 2020-2035
  • Table 56: Western Europe Market Volume (Units) Forecast by Power Output, 2020-2035
  • Table 57: Western Europe Market Value (USD Billion) Forecast by Supplier Type, 2020-2035
  • Table 58: Western Europe Market Volume (Units) Forecast by Supplier Type, 2020-2035
  • Table 59: Western Europe Market Value (USD Billion) Forecast by Vehicle Type, 2020-2035
  • Table 60: Western Europe Market Volume (Units) Forecast by Vehicle Type, 2020-2035
  • Table 61: Western Europe Market Value (USD Billion) Forecast by Application, 2020-2035
  • Table 62: Western Europe Market Volume (Units) Forecast by Application, 2020-2035
  • Table 63: Western Europe Market Value (USD Billion) Forecast by Installation Type, 2020-2035
  • Table 64: Western Europe Market Volume (Units) Forecast by Installation Type, 2020-2035
  • Table 65: Eastern Europe Market Value (USD Billion) Forecast by Country, 2020-2035
  • Table 66: Eastern Europe Market Volume (Units) Forecast by Country, 2020-2035
  • Table 67: Eastern Europe Market Value (USD Billion) Forecast by Level of Charging, 2020-2035
  • Table 68: Eastern Europe Market Volume (Units) Forecast by Level of Charging, 2020-2035
  • Table 69: Eastern Europe Market Value (USD Billion) Forecast by Charging Station Type, 2020-2035
  • Table 70: Eastern Europe Market Volume (Units) Forecast by Charging Station Type, 2020-2035
  • Table 71: Eastern Europe Market Value (USD Billion) Forecast by Power Output, 2020-2035
  • Table 72: Eastern Europe Market Volume (Units) Forecast by Power Output, 2020-2035
  • Table 73: Eastern Europe Market Value (USD Billion) Forecast by Supplier Type, 2020-2035
  • Table 74: Eastern Europe Market Volume (Units) Forecast by Supplier Type, 2020-2035
  • Table 75: Eastern Europe Market Value (USD Billion) Forecast by Vehicle Type, 2020-2035
  • Table 76: Eastern Europe Market Volume (Units) Forecast by Vehicle Type, 2020-2035
  • Table 77: Eastern Europe Market Value (USD Billion) Forecast by Application, 2020-2035
  • Table 78: Eastern Europe Market Volume (Units) Forecast by Application, 2020-2035
  • Table 79: Eastern Europe Market Value (USD Billion) Forecast by Installation Type, 2020-2035
  • Table 80: Eastern Europe Market Volume (Units) Forecast by Installation Type, 2020-2035
  • Table 81: East Asia Market Value (USD Billion) Forecast by Country, 2020-2035
  • Table 82: East Asia Market Volume (Units) Forecast by Country, 2020-2035
  • Table 83: East Asia Market Value (USD Billion) Forecast by Level of Charging, 2020-2035
  • Table 84: East Asia Market Volume (Units) Forecast by Level of Charging, 2020-2035
  • Table 85: East Asia Market Value (USD Billion) Forecast by Charging Station Type, 2020-2035
  • Table 86: East Asia Market Volume (Units) Forecast by Charging Station Type, 2020-2035
  • Table 87: East Asia Market Value (USD Billion) Forecast by Power Output, 2020-2035
  • Table 88: East Asia Market Volume (Units) Forecast by Power Output, 2020-2035
  • Table 89: East Asia Market Value (USD Billion) Forecast by Supplier Type, 2020-2035
  • Table 90: East Asia Market Volume (Units) Forecast by Supplier Type, 2020-2035
  • Table 91: East Asia Market Value (USD Billion) Forecast by Vehicle Type, 2020-2035
  • Table 92: East Asia Market Volume (Units) Forecast by Vehicle Type, 2020-2035
  • Table 93: East Asia Market Value (USD Billion) Forecast by Application, 2020-2035
  • Table 94: East Asia Market Volume (Units) Forecast by Application, 2020-2035
  • Table 95: East Asia Market Value (USD Billion) Forecast by Installation Type, 2020-2035
  • Table 96: East Asia Market Volume (Units) Forecast by Installation Type, 2020-2035
  • Table 97: South Asia & Pacific Market Value (USD Billion) Forecast by Country, 2020-2035
  • Table 98: South Asia & Pacific Market Volume (Units) Forecast by Country, 2020-2035
  • Table 99: South Asia & Pacific Market Value (USD Billion) Forecast by Level of Charging, 2020-2035
  • Table 100: South Asia & Pacific Market Volume (Units) Forecast by Level of Charging, 2020-2035
  • Table 101: South Asia & Pacific Market Value (USD Billion) Forecast by Charging Station Type, 2020-2035
  • Table 102: South Asia & Pacific Market Volume (Units) Forecast by Charging Station Type, 2020-2035
  • Table 103: South Asia & Pacific Market Value (USD Billion) Forecast by Power Output, 2020-2035
  • Table 104: South Asia & Pacific Market Volume (Units) Forecast by Power Output, 2020-2035
  • Table 105: South Asia & Pacific Market Value (USD Billion) Forecast by Supplier Type, 2020-2035
  • Table 106: South Asia & Pacific Market Volume (Units) Forecast by Supplier Type, 2020-2035
  • Table 107: South Asia & Pacific Market Value (USD Billion) Forecast by Vehicle Type, 2020-2035
  • Table 108: South Asia & Pacific Market Volume (Units) Forecast by Vehicle Type, 2020-2035
  • Table 109: South Asia & Pacific Market Value (USD Billion) Forecast by Application, 2020-2035
  • Table 110: South Asia & Pacific Market Volume (Units) Forecast by Application, 2020-2035
  • Table 111: South Asia & Pacific Market Value (USD Billion) Forecast by Installation Type, 2020-2035
  • Table 112: South Asia & Pacific Market Volume (Units) Forecast by Installation Type, 2020-2035
  • Table 113: Middle East and Africa Market Value (USD Billion) Forecast by Country, 2020-2035
  • Table 114: Middle East and Africa Market Volume (Units) Forecast by Country, 2020-2035
  • Table 115: Middle East and Africa Market Value (USD Billion) Forecast by Level of Charging, 2020-2035
  • Table 116: Middle East and Africa Market Volume (Units) Forecast by Level of Charging, 2020-2035
  • Table 117: Middle East and Africa Market Value (USD Billion) Forecast by Charging Station Type, 2020-2035
  • Table 118: Middle East and Africa Market Volume (Units) Forecast by Charging Station Type, 2020-2035
  • Table 119: Middle East and Africa Market Value (USD Billion) Forecast by Power Output, 2020-2035
  • Table 120: Middle East and Africa Market Volume (Units) Forecast by Power Output, 2020-2035
  • Table 121: Middle East and Africa Market Value (USD Billion) Forecast by Supplier Type, 2020-2035
  • Table 122: Middle East and Africa Market Volume (Units) Forecast by Supplier Type, 2020-2035
  • Table 123: Middle East and Africa Market Value (USD Billion) Forecast by Vehicle Type, 2020-2035
  • Table 124: Middle East and Africa Market Volume (Units) Forecast by Vehicle Type, 2020-2035
  • Table 125: Middle East and Africa Market Value (USD Billion) Forecast by Application, 2020-2035
  • Table 126: Middle East and Africa Market Volume (Units) Forecast by Application, 2020-2035
  • Table 127: Middle East and Africa Market Value (USD Billion) Forecast by Installation Type, 2020-2035
  • Table 128: Middle East and Africa Market Volume (Units) Forecast by Installation Type, 2020-2035

List of Figures

  • Figure 1: Global Market Volume (Units) Forecast 2020-2035
  • Figure 2: Global Market Pricing Analysis
  • Figure 3: Global Market Value (USD Billion) Forecast 2020-2035
  • Figure 4: Global Market Value Share and BPS Analysis by Level of Charging, 2025 and 2035
  • Figure 5: Global Market Y-o-Y Growth Comparison by Level of Charging, 2025-2035
  • Figure 6: Global Market Attractiveness Analysis by Level of Charging
  • Figure 7: Global Market Value Share and BPS Analysis by Charging Station Type, 2025 and 2035
  • Figure 8: Global Market Y-o-Y Growth Comparison by Charging Station Type, 2025-2035
  • Figure 9: Global Market Attractiveness Analysis by Charging Station Type
  • Figure 10: Global Market Value Share and BPS Analysis by Power Output, 2025 and 2035
  • Figure 11: Global Market Y-o-Y Growth Comparison by Power Output, 2025-2035
  • Figure 12: Global Market Attractiveness Analysis by Power Output
  • Figure 13: Global Market Value Share and BPS Analysis by Supplier Type, 2025 and 2035
  • Figure 14: Global Market Y-o-Y Growth Comparison by Supplier Type, 2025-2035
  • Figure 15: Global Market Attractiveness Analysis by Supplier Type
  • Figure 16: Global Market Value Share and BPS Analysis by Vehicle Type, 2025 and 2035
  • Figure 17: Global Market Y-o-Y Growth Comparison by Vehicle Type, 2025-2035
  • Figure 18: Global Market Attractiveness Analysis by Vehicle Type
  • Figure 19: Global Market Value Share and BPS Analysis by Application, 2025 and 2035
  • Figure 20: Global Market Y-o-Y Growth Comparison by Application, 2025-2035
  • Figure 21: Global Market Attractiveness Analysis by Application
  • Figure 22: Global Market Value Share and BPS Analysis by Installation Type, 2025 and 2035
  • Figure 23: Global Market Y-o-Y Growth Comparison by Installation Type, 2025-2035
  • Figure 24: Global Market Attractiveness Analysis by Installation Type
  • Figure 25: Global Market Value (USD Billion) Share and BPS Analysis by Region, 2025 and 2035
  • Figure 26: Global Market Y-o-Y Growth Comparison by Region, 2025-2035
  • Figure 27: Global Market Attractiveness Analysis by Region
  • Figure 28: North America Market Incremental $ Opportunity, 2025-2035
  • Figure 29: Latin America Market Incremental $ Opportunity, 2025-2035
  • Figure 30: Western Europe Market Incremental $ Opportunity, 2025-2035
  • Figure 31: Eastern Europe Market Incremental $ Opportunity, 2025-2035
  • Figure 32: East Asia Market Incremental $ Opportunity, 2025-2035
  • Figure 33: South Asia & Pacific Market Incremental $ Opportunity, 2025-2035
  • Figure 34: Middle East and Africa Market Incremental $ Opportunity, 2025-2035
  • Figure 35: North America Market Value Share and BPS Analysis by Country, 2025 and 2035
  • Figure 36: North America Market Value Share and BPS Analysis by Level of Charging, 2025 and 2035
  • Figure 37: North America Market Y-o-Y Growth Comparison by Level of Charging, 2025-2035
  • Figure 38: North America Market Attractiveness Analysis by Level of Charging
  • Figure 39: North America Market Value Share and BPS Analysis by Charging Station Type, 2025 and 2035
  • Figure 40: North America Market Y-o-Y Growth Comparison by Charging Station Type, 2025-2035
  • Figure 41: North America Market Attractiveness Analysis by Charging Station Type
  • Figure 42: North America Market Value Share and BPS Analysis by Power Output, 2025 and 2035
  • Figure 43: North America Market Y-o-Y Growth Comparison by Power Output, 2025-2035
  • Figure 44: North America Market Attractiveness Analysis by Power Output
  • Figure 45: North America Market Value Share and BPS Analysis by Supplier Type, 2025 and 2035
  • Figure 46: North America Market Y-o-Y Growth Comparison by Supplier Type, 2025-2035
  • Figure 47: North America Market Attractiveness Analysis by Supplier Type
  • Figure 48: North America Market Value Share and BPS Analysis by Vehicle Type, 2025 and 2035
  • Figure 49: North America Market Y-o-Y Growth Comparison by Vehicle Type, 2025-2035
  • Figure 50: North America Market Attractiveness Analysis by Vehicle Type
  • Figure 51: North America Market Value Share and BPS Analysis by Application, 2025 and 2035
  • Figure 52: North America Market Y-o-Y Growth Comparison by Application, 2025-2035
  • Figure 53: North America Market Attractiveness Analysis by Application
  • Figure 54: North America Market Value Share and BPS Analysis by Installation Type, 2025 and 2035
  • Figure 55: North America Market Y-o-Y Growth Comparison by Installation Type, 2025-2035
  • Figure 56: North America Market Attractiveness Analysis by Installation Type
  • Figure 57: Latin America Market Value Share and BPS Analysis by Country, 2025 and 2035
  • Figure 58: Latin America Market Value Share and BPS Analysis by Level of Charging, 2025 and 2035
  • Figure 59: Latin America Market Y-o-Y Growth Comparison by Level of Charging, 2025-2035
  • Figure 60: Latin America Market Attractiveness Analysis by Level of Charging
  • Figure 61: Latin America Market Value Share and BPS Analysis by Charging Station Type, 2025 and 2035
  • Figure 62: Latin America Market Y-o-Y Growth Comparison by Charging Station Type, 2025-2035
  • Figure 63: Latin America Market Attractiveness Analysis by Charging Station Type
  • Figure 64: Latin America Market Value Share and BPS Analysis by Power Output, 2025 and 2035
  • Figure 65: Latin America Market Y-o-Y Growth Comparison by Power Output, 2025-2035
  • Figure 66: Latin America Market Attractiveness Analysis by Power Output
  • Figure 67: Latin America Market Value Share and BPS Analysis by Supplier Type, 2025 and 2035
  • Figure 68: Latin America Market Y-o-Y Growth Comparison by Supplier Type, 2025-2035
  • Figure 69: Latin America Market Attractiveness Analysis by Supplier Type
  • Figure 70: Latin America Market Value Share and BPS Analysis by Vehicle Type, 2025 and 2035
  • Figure 71: Latin America Market Y-o-Y Growth Comparison by Vehicle Type, 2025-2035
  • Figure 72: Latin America Market Attractiveness Analysis by Vehicle Type
  • Figure 73: Latin America Market Value Share and BPS Analysis by Application, 2025 and 2035
  • Figure 74: Latin America Market Y-o-Y Growth Comparison by Application, 2025-2035
  • Figure 75: Latin America Market Attractiveness Analysis by Application
  • Figure 76: Latin America Market Value Share and BPS Analysis by Installation Type, 2025 and 2035
  • Figure 77: Latin America Market Y-o-Y Growth Comparison by Installation Type, 2025-2035
  • Figure 78: Latin America Market Attractiveness Analysis by Installation Type
  • Figure 79: Western Europe Market Value Share and BPS Analysis by Country, 2025 and 2035
  • Figure 80: Western Europe Market Value Share and BPS Analysis by Level of Charging, 2025 and 2035
  • Figure 81: Western Europe Market Y-o-Y Growth Comparison by Level of Charging, 2025-2035
  • Figure 82: Western Europe Market Attractiveness Analysis by Level of Charging
  • Figure 83: Western Europe Market Value Share and BPS Analysis by Charging Station Type, 2025 and 2035
  • Figure 84: Western Europe Market Y-o-Y Growth Comparison by Charging Station Type, 2025-2035
  • Figure 85: Western Europe Market Attractiveness Analysis by Charging Station Type
  • Figure 86: Western Europe Market Value Share and BPS Analysis by Power Output, 2025 and 2035
  • Figure 87: Western Europe Market Y-o-Y Growth Comparison by Power Output, 2025-2035
  • Figure 88: Western Europe Market Attractiveness Analysis by Power Output
  • Figure 89: Western Europe Market Value Share and BPS Analysis by Supplier Type, 2025 and 2035
  • Figure 90: Western Europe Market Y-o-Y Growth Comparison by Supplier Type, 2025-2035
  • Figure 91: Western Europe Market Attractiveness Analysis by Supplier Type
  • Figure 92: Western Europe Market Value Share and BPS Analysis by Vehicle Type, 2025 and 2035
  • Figure 93: Western Europe Market Y-o-Y Growth Comparison by Vehicle Type, 2025-2035
  • Figure 94: Western Europe Market Attractiveness Analysis by Vehicle Type
  • Figure 95: Western Europe Market Value Share and BPS Analysis by Application, 2025 and 2035
  • Figure 96: Western Europe Market Y-o-Y Growth Comparison by Application, 2025-2035
  • Figure 97: Western Europe Market Attractiveness Analysis by Application
  • Figure 98: Western Europe Market Value Share and BPS Analysis by Installation Type, 2025 and 2035
  • Figure 99: Western Europe Market Y-o-Y Growth Comparison by Installation Type, 2025-2035
  • Figure 100: Western Europe Market Attractiveness Analysis by Installation Type
  • Figure 101: Eastern Europe Market Value Share and BPS Analysis by Country, 2025 and 2035
  • Figure 102: Eastern Europe Market Value Share and BPS Analysis by Level of Charging, 2025 and 2035
  • Figure 103: Eastern Europe Market Y-o-Y Growth Comparison by Level of Charging, 2025-2035
  • Figure 104: Eastern Europe Market Attractiveness Analysis by Level of Charging
  • Figure 105: Eastern Europe Market Value Share and BPS Analysis by Charging Station Type, 2025 and 2035
  • Figure 106: Eastern Europe Market Y-o-Y Growth Comparison by Charging Station Type, 2025-2035
  • Figure 107: Eastern Europe Market Attractiveness Analysis by Charging Station Type
  • Figure 108: Eastern Europe Market Value Share and BPS Analysis by Power Output, 2025 and 2035
  • Figure 109: Eastern Europe Market Y-o-Y Growth Comparison by Power Output, 2025-2035
  • Figure 110: Eastern Europe Market Attractiveness Analysis by Power Output
  • Figure 111: Eastern Europe Market Value Share and BPS Analysis by Supplier Type, 2025 and 2035
  • Figure 112: Eastern Europe Market Y-o-Y Growth Comparison by Supplier Type, 2025-2035
  • Figure 113: Eastern Europe Market Attractiveness Analysis by Supplier Type
  • Figure 114: Eastern Europe Market Value Share and BPS Analysis by Vehicle Type, 2025 and 2035
  • Figure 115: Eastern Europe Market Y-o-Y Growth Comparison by Vehicle Type, 2025-2035
  • Figure 116: Eastern Europe Market Attractiveness Analysis by Vehicle Type
  • Figure 117: Eastern Europe Market Value Share and BPS Analysis by Application, 2025 and 2035
  • Figure 118: Eastern Europe Market Y-o-Y Growth Comparison by Application, 2025-2035
  • Figure 119: Eastern Europe Market Attractiveness Analysis by Application
  • Figure 120: Eastern Europe Market Value Share and BPS Analysis by Installation Type, 2025 and 2035
  • Figure 121: Eastern Europe Market Y-o-Y Growth Comparison by Installation Type, 2025-2035
  • Figure 122: Eastern Europe Market Attractiveness Analysis by Installation Type
  • Figure 123: East Asia Market Value Share and BPS Analysis by Country, 2025 and 2035
  • Figure 124: East Asia Market Value Share and BPS Analysis by Level of Charging, 2025 and 2035
  • Figure 125: East Asia Market Y-o-Y Growth Comparison by Level of Charging, 2025-2035
  • Figure 126: East Asia Market Attractiveness Analysis by Level of Charging
  • Figure 127: East Asia Market Value Share and BPS Analysis by Charging Station Type, 2025 and 2035
  • Figure 128: East Asia Market Y-o-Y Growth Comparison by Charging Station Type, 2025-2035
  • Figure 129: East Asia Market Attractiveness Analysis by Charging Station Type
  • Figure 130: East Asia Market Value Share and BPS Analysis by Power Output, 2025 and 2035
  • Figure 131: East Asia Market Y-o-Y Growth Comparison by Power Output, 2025-2035
  • Figure 132: East Asia Market Attractiveness Analysis by Power Output
  • Figure 133: East Asia Market Value Share and BPS Analysis by Supplier Type, 2025 and 2035
  • Figure 134: East Asia Market Y-o-Y Growth Comparison by Supplier Type, 2025-2035
  • Figure 135: East Asia Market Attractiveness Analysis by Supplier Type
  • Figure 136: East Asia Market Value Share and BPS Analysis by Vehicle Type, 2025 and 2035
  • Figure 137: East Asia Market Y-o-Y Growth Comparison by Vehicle Type, 2025-2035
  • Figure 138: East Asia Market Attractiveness Analysis by Vehicle Type
  • Figure 139: East Asia Market Value Share and BPS Analysis by Application, 2025 and 2035
  • Figure 140: East Asia Market Y-o-Y Growth Comparison by Application, 2025-2035
  • Figure 141: East Asia Market Attractiveness Analysis by Application
  • Figure 142: East Asia Market Value Share and BPS Analysis by Installation Type, 2025 and 2035
  • Figure 143: East Asia Market Y-o-Y Growth Comparison by Installation Type, 2025-2035
  • Figure 144: East Asia Market Attractiveness Analysis by Installation Type
  • Figure 145: South Asia & Pacific Market Value Share and BPS Analysis by Country, 2025 and 2035
  • Figure 146: South Asia & Pacific Market Value Share and BPS Analysis by Level of Charging, 2025 and 2035
  • Figure 147: South Asia & Pacific Market Y-o-Y Growth Comparison by Level of Charging, 2025-2035
  • Figure 148: South Asia & Pacific Market Attractiveness Analysis by Level of Charging
  • Figure 149: South Asia & Pacific Market Value Share and BPS Analysis by Charging Station Type, 2025 and 2035
  • Figure 150: South Asia & Pacific Market Y-o-Y Growth Comparison by Charging Station Type, 2025-2035
  • Figure 151: South Asia & Pacific Market Attractiveness Analysis by Charging Station Type
  • Figure 152: South Asia & Pacific Market Value Share and BPS Analysis by Power Output, 2025 and 2035
  • Figure 153: South Asia & Pacific Market Y-o-Y Growth Comparison by Power Output, 2025-2035
  • Figure 154: South Asia & Pacific Market Attractiveness Analysis by Power Output
  • Figure 155: South Asia & Pacific Market Value Share and BPS Analysis by Supplier Type, 2025 and 2035
  • Figure 156: South Asia & Pacific Market Y-o-Y Growth Comparison by Supplier Type, 2025-2035
  • Figure 157: South Asia & Pacific Market Attractiveness Analysis by Supplier Type
  • Figure 158: South Asia & Pacific Market Value Share and BPS Analysis by Vehicle Type, 2025 and 2035
  • Figure 159: South Asia & Pacific Market Y-o-Y Growth Comparison by Vehicle Type, 2025-2035
  • Figure 160: South Asia & Pacific Market Attractiveness Analysis by Vehicle Type
  • Figure 161: South Asia & Pacific Market Value Share and BPS Analysis by Application, 2025 and 2035
  • Figure 162: South Asia & Pacific Market Y-o-Y Growth Comparison by Application, 2025-2035
  • Figure 163: South Asia & Pacific Market Attractiveness Analysis by Application
  • Figure 164: South Asia & Pacific Market Value Share and BPS Analysis by Installation Type, 2025 and 2035
  • Figure 165: South Asia & Pacific Market Y-o-Y Growth Comparison by Installation Type, 2025-2035
  • Figure 166: South Asia & Pacific Market Attractiveness Analysis by Installation Type
  • Figure 167: Middle East and Africa Market Value Share and BPS Analysis by Country, 2025 and 2035
  • Figure 168: Middle East and Africa Market Value Share and BPS Analysis by Level of Charging, 2025 and 2035
  • Figure 169: Middle East and Africa Market Y-o-Y Growth Comparison by Level of Charging, 2025-2035
  • Figure 170: Middle East and Africa Market Attractiveness Analysis by Level of Charging
  • Figure 171: Middle East and Africa Market Value Share and BPS Analysis by Charging Station Type, 2025 and 2035
  • Figure 172: Middle East and Africa Market Y-o-Y Growth Comparison by Charging Station Type, 2025-2035
  • Figure 173: Middle East and Africa Market Attractiveness Analysis by Charging Station Type
  • Figure 174: Middle East and Africa Market Value Share and BPS Analysis by Power Output, 2025 and 2035
  • Figure 175: Middle East and Africa Market Y-o-Y Growth Comparison by Power Output, 2025-2035
  • Figure 176: Middle East and Africa Market Attractiveness Analysis by Power Output
  • Figure 177: Middle East and Africa Market Value Share and BPS Analysis by Supplier Type, 2025 and 2035
  • Figure 178: Middle East and Africa Market Y-o-Y Growth Comparison by Supplier Type, 2025-2035
  • Figure 179: Middle East and Africa Market Attractiveness Analysis by Supplier Type
  • Figure 180: Middle East and Africa Market Value Share and BPS Analysis by Vehicle Type, 2025 and 2035
  • Figure 181: Middle East and Africa Market Y-o-Y Growth Comparison by Vehicle Type, 2025-2035
  • Figure 182: Middle East and Africa Market Attractiveness Analysis by Vehicle Type
  • Figure 183: Middle East and Africa Market Value Share and BPS Analysis by Application, 2025 and 2035
  • Figure 184: Middle East and Africa Market Y-o-Y Growth Comparison by Application, 2025-2035
  • Figure 185: Middle East and Africa Market Attractiveness Analysis by Application
  • Figure 186: Middle East and Africa Market Value Share and BPS Analysis by Installation Type, 2025 and 2035
  • Figure 187: Middle East and Africa Market Y-o-Y Growth Comparison by Installation Type, 2025-2035
  • Figure 188: Middle East and Africa Market Attractiveness Analysis by Installation Type
  • Figure 189: Global Market - Tier Structure Analysis
  • Figure 190: Global Market - Company Share Analysis

Frequently Asked Questions

What is the projected electric vehicle charging station market size by 2035?

The market is expected to reach nearly USD 284.2 billion by 2035.

What is the CAGR of the electric vehicle charging station market from 2025 to 2035?

The market is growing at a CAGR of 20% during this period.

Which level of charging holds the largest market share in 2025?

Level 2 charging leads with an estimated 50% market share.

Which end-user segment leads the electric vehicle charging station market in 2025?

Commercial Public EV Charging Stations hold the largest market share at 40%.

Which company holds the largest market share among electric vehicle charging station providers?

ChargePoint, Inc. holds the leading 19% industry share.

Explore Similar Insights

Future Market Insights

Electric Vehicle Charging Station Market