

- Market Size (2026)
- USD 0.66 Bn
- Forecast (2036)
- USD 2.01 Bn
- CAGR (2026 to 2036)
- 11.8%
Bio-Based Polyurethane Foam for Automotive Interiors Market Size, Market Forecast and Outlook By FMI
Bio-based polyurethane foam for automotive interiors market was valued at USD 0.59 billion in 2025 and is projected to reach USD 0.66 billion in 2026. It is forecast to reach USD 2.01 billion by 2036 at 11.8% CAGR. Passenger vehicles are projected to lead vehicle class demand with 63.0% share in 2026. Tier 1 seating suppliers are forecast to hold 55.0% share by supply route.
Summary of the Bio-Based Polyurethane Foam for Automotive Interiors Market
- Demand and Growth Drivers
- Demand is rising because automakers want lower fossil-carbon content in seats without changing foam comfort and safety tests.
- Growth is supported by vehicle interior programs that already use polyurethane foam and can qualify bio-based polyols in the same process route.
- Supplier interest is shifting toward mass-balance and plant-oil polyol systems because these routes reduce reformulation risk for seating foam plants.
- Regulatory pressure around vehicle circularity is making seat foam recovery and lower-carbon input choices part of material discussions.
- Product and Segment View
- Molded seating foam is projected to account for 46.0% share in 2026 because cushions and back pads carry the largest foam volume per vehicle.
- Plant-oil polyols are forecast to hold 51.0% share by renewable input in 2026 due to better supplier familiarity and established flexible foam use.
- Seat cushions are projected to account for 48.0% share by application as they need repeat comfort validation across model platforms.
- Mass-balance certification is becoming a practical route where buyers need lower reported fossil input without retooling foam production.
- Geography and Competitive Outlook
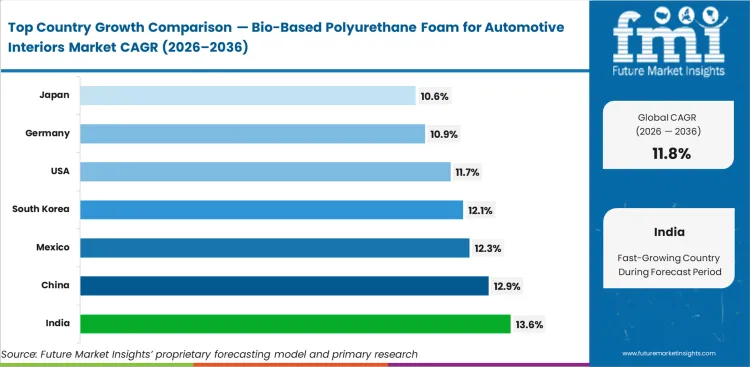
- China is projected at 12.9% CAGR through 2036 because local vehicle output and new energy vehicle volume support higher material trials.
- India is forecast to grow at 13.6% CAGR through 2036 as passenger vehicle production and local seating supply both expand.
- BASF and Huntsman and Dow influence raw material choices. Magna and Adient and Lear and Woodbridge shape seating qualification.
- Suppliers win when they combine bio-based input access with foam validation data and life-cycle documentation for automaker programs.
- Analyst Opinion
- Nikhil Kaitwade, Principal Consultant at FMI says, “This sector is expected to start as a qualification‑focused market. Automakers are not expected to approve interior foam just because it is bio‑based, it must also meet the same standards for comfort and cost. Suppliers that can offer renewable materials without changing existing manufacturing processes are expected to have the strongest advantage.”
- Bio-Based Polyurethane Foam for Automotive Interiors Market Value Analysis
- The market is expanding from early-stage trials to repeat sourcing, with increasing adoption in seats and interior padding applications.
- The wider polyurethane foam base helps benchmark how flexible and semi-rigid foam demand supports automotive interior applications.
- Growth is driven by rising penetration of bio‑based content, supported by existing polyurethane processes that allow easier qualification and integration.
- The market is scaling gradually due to cost considerations and rigorous validation requirements, but long‑term uptake is supported by sustainability regulations and lifecycle documentation practices.
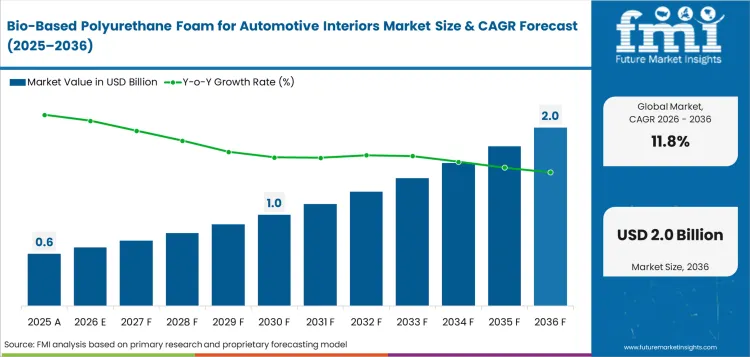
Key Takeaways, Market Size, and Forecast
- The bio-based polyurethane foam for automotive interiors market was valued at USD 0.59 billion in 2025.
- By 2036, the market is projected to reach USD 2.01 billion.
- From 2026 to 2036, the market is forecast to expand at 11.8% CAGR.
- The market is projected to create an incremental opportunity of USD 1.35 billion between 2026 and 2036.
- Passenger vehicles are projected to account for 63.0% share of vehicle class demand in 2026.
- Tier 1 seating suppliers are forecast to account for 55.0% share of supply route demand in 2026.
- India at 13.6% CAGR and China at 12.9% CAGR are among the faster country-level demand pools through 2036.
Automotive seat makers need lower-fossil foam that behaves like proven polyurethane in daily use. In April 2026, Magna said EcoSphere Bio-Based Foam can support up to 20% renewable content and still fit large-scale production. That gives OEM seating teams a clearer route to greener foam without changing comfort targets. Supplier proof is also becoming more important. In October 2024, Woodbridge said TrimVisible BIO replaces some petroleum-based materials with biogenic carbon in polyurethane seating foam.
That helps foam makers show material progress through seating-specific chemistry rather than broad sustainability claims. Regulation adds pressure to document inputs. In December 2025, the European Parliament agreed that new vehicle types should contain 15% recycled plastic within six years and 25% within ten years. Foam suppliers with renewable content records and vehicle-grade fire-test proof are expected to be better placed for interior program approval.
Bio-Based Polyurethane Foam for Automotive Interiors Market Definition
The bio-based polyurethane foam for automotive interiors market covers foam systems used in vehicle seats and headrests and armrests and headliners and door pads and acoustic parts. Scope includes polyurethane foam made with plant-oil polyols with certified mass-balance feedstocks and bio-based prepolymers and hybrid bio-recycled polyol routes. The scope also connects with automotive foams where seat cushions and acoustic parts remain the main cabin uses.
Bio-Based Polyurethane Foam for Automotive Interiors Market Inclusions
Market scope includes molded seat cushions and molded back pads and headrest foam and lamination foam and headliner substrate foam and acoustic foam and energy absorbing interior foam. It includes flexible and semi-rigid polyurethane grades when renewable or mass-balanced feedstock is used. It also includes foam systems linked to renewable polyol analysis where automotive interior use is part of the formulation target. Renewable feedstock selection should be read alongside green and bio-based polyol demand since polyol chemistry decides how much fossil input can be reduced.
Bio-Based Polyurethane Foam for Automotive Interiors Market Exclusions
Scope excludes conventional polyurethane foam with no renewable or certified mass-balance input. It also excludes exterior bumper foam and tire foam inserts and insulation boards and footwear foam and mattress foam and packaging foam unless a formulation is qualified for automotive interior use.
Bio-Based Polyurethane Foam for Automotive Interiors Market Research Methodology
- Primary Research: FMI analysts reviewed seating supplier needs and foam plant qualification concerns and chemical supplier portfolios and OEM material approval routes.
- Desk Research: The study used public data from automobile associations and government agencies and company releases and official policy.
- Market sizing and forecasting: Market size was estimated through vehicle output with foam content per vehicle and bio-based content penetration and supplier revenue cross-checks. The model also compared bio-content uptake against the wider polyurethane foam base.
- Data validation: Forecast checks compared automotive foam demand with bio-polyol capacity signals and supplier launches and vehicle production in major countries.
Why is the Bio-Based Polyurethane Foam for Automotive Interiors Market Growing?
- Seat suppliers are testing renewable-content foam because cushions carry high polymer volume and visible lower-carbon material scrutiny.
- Automakers are using life-cycle documents to compare foam systems before platform approval.
- Chemical suppliers are offering mass-balance and plant-oil routes that work with existing flexible foam processes.
Automotive interiors are a practical entry point for bio-based polyurethane because seat foam uses known molding systems. The European Automobile Manufacturers’ Association reported that global car production reached 78.7 million units in 2025, with Asia accounting for 62.1% of output. Large production platforms give suppliers enough volume to recover qualification cost once the formulation is approved. The wider flexible foam category provides a reference for cushion and seating use. The wider flexible foam category gives seating suppliers a useful reference for comfort and density expectations in vehicle interiors.
Renewable input is expanding because approved polyurethane lines can take renewable feedstock in measured steps. Automakers avoid new foam chemistry unless the same plant process is protected. Huntsman said in January 2024 that novel PU-based automotive seating foams can be made using bio-based polyols and can allow recyclability options. That signal shows why the forecast favors formulations that fit the same seating plant process. The upstream polyols assessment helps explain why feedstock choice remains a formulation gate.
Market Segmentation Analysis
- Molded seating foam is projected to reach 46.0% share in 2026 because seat cushions carry the largest interior foam volume.
- Plant-oil polyols are forecast to account for 51.0% share in 2026 as soybean and castor oil routes have established foam use.
- Seat cushions are projected to represent 48.0% share in 2026 due to comfort and safety qualification needs.
- Passenger vehicles are forecast to hold 63.0% share in 2026 as interior comfort packages are most visible in this class.
- Tier 1 seating suppliers are projected to capture 55.0% share in 2026 because OEM approval often passes through complete seat programs.
- Mass-balance certified systems are estimated to account for 42.0% share in 2026 as buyers seek lower fossil input with lower plant disruption.
The market is divided into six primary segment groups based on foam type, renewable input, interior application, vehicle class, supply route, and certification model.
Insights into the Molded Seating Foam Type Segment
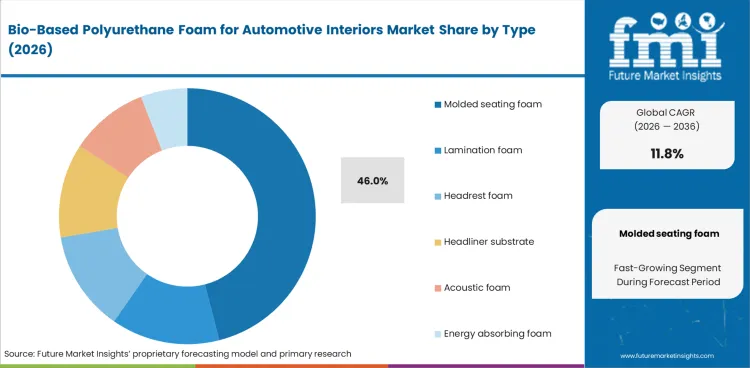
- Molded seating foam is projected to account for 46.0% share of foam type demand in 2026. Seat cushions and back pads use high foam weight and need repeat comfort validation.
- Bio-based content enters molded seating first when suppliers can show compression set with odor and volatile organic compound results and fatigue behavior in existing seat designs.
Insights into the Plant-Oil Polyol Renewable Input Segment
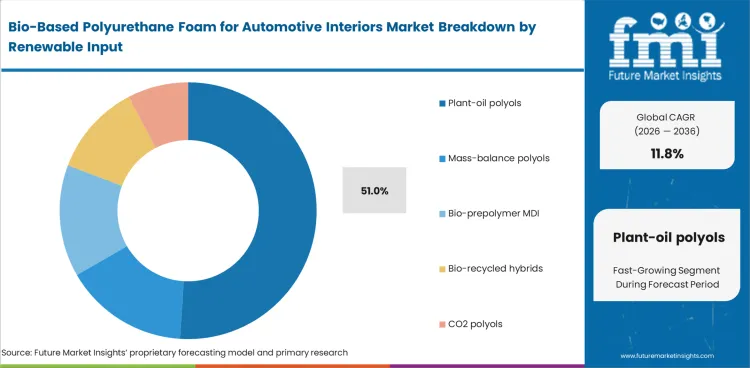
- Plant-oil polyols are forecast to hold 51.0% share of renewable input demand in 2026. Soybean and castor routes are familiar to flexible foam formulators.
- Mass-balance and carbon dioxide-based polyols will gain share where buyers need lower product carbon footprint claims with clear chain-of-custody records. CO2-based polycarbonate polyol provides another low-carbon route for future flexible foam trials.
Insights into the Seat Cushion Interior Application Segment
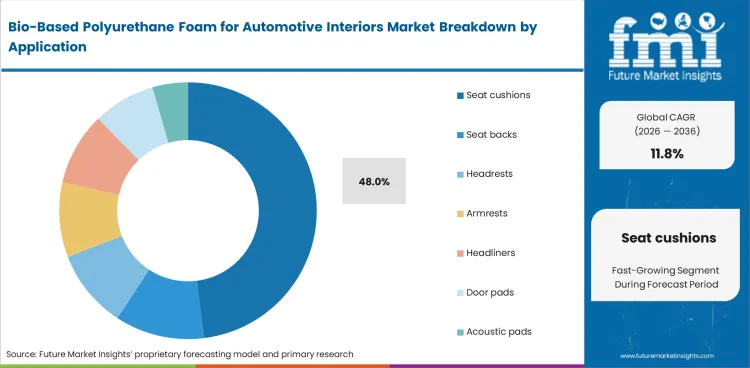
- Seat cushions are projected to account for 48.0% share of application demand in 2026. Upstream material choices remain tied to the polyurethane precursor base because polyols and isocyanates decide foam behavior before seat assembly begins.
- Headrests and armrests are easier early targets because smaller parts allow suppliers to test higher renewable content with lower program risk.
Insights into the Passenger Vehicles Vehicle Class Segment
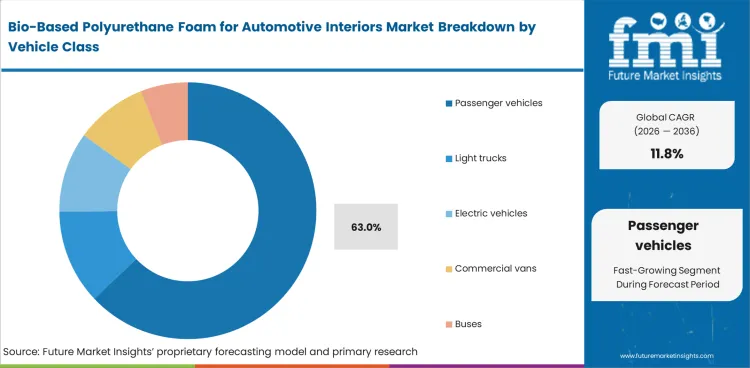
- Passenger vehicles are forecast to account for 63.0% share of vehicle class demand in 2026. High-volume models create the largest route for renewable-content foam scale.
- Electric vehicle programs add interest because material choices are reviewed with cabin weight and interior emissions. Brand claims add a separate review layer.
Insights into the Tier 1 Seating Supplier Supply Route Segment
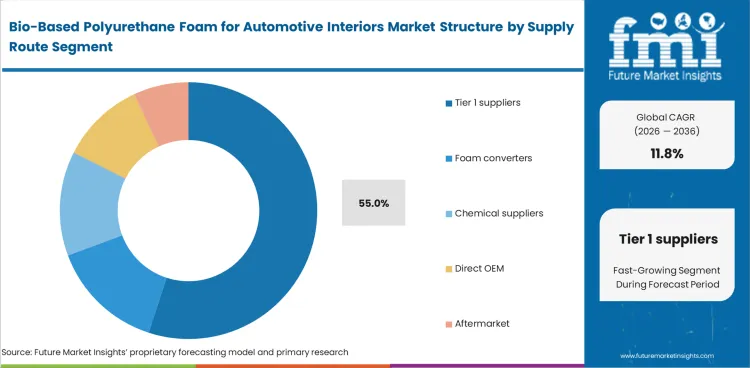
- Tier 1 seating suppliers are projected to hold 55.0% share in 2026 as they control foam qualification inside complete seat programs.
- Chemical suppliers still shape the market because polyol choice with isocyanate compatibility and additive packages decide foam behavior before seat assembly starts.
Insights into the Mass-Balance Certification Model Segment
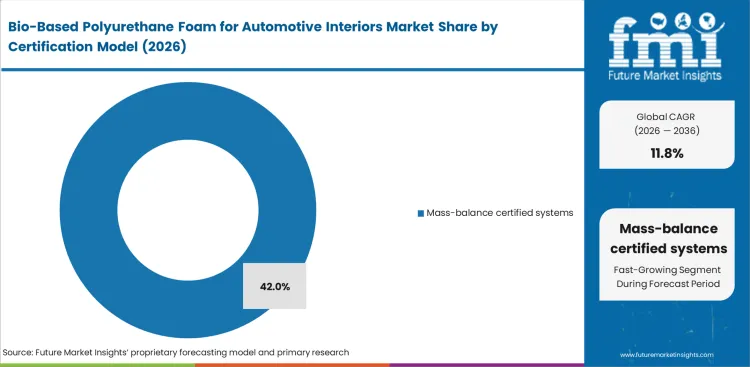
- Mass-balance certified systems are estimated to account for 42.0% share in 2026. They help suppliers reduce reported fossil input while using familiar plants.
- Direct bio-content testing remains important in parts where OEMs require measured renewable carbon in the final foam instead of certificate-backed allocation.
Bio-Based Polyurethane Foam for Automotive Interiors Market Drivers, Restraints, and Opportunities
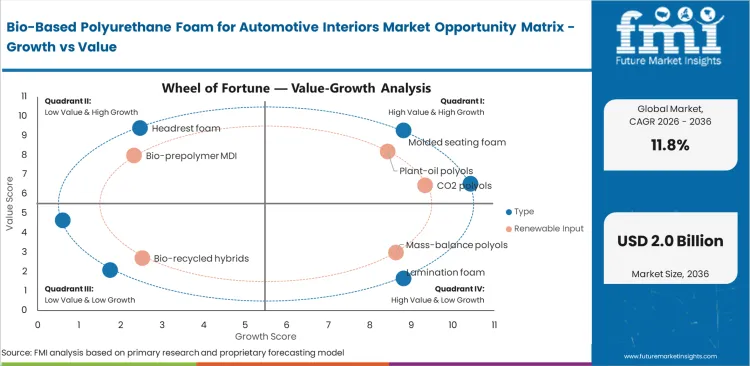
- Seat carbon accounting is raising interest in renewable-content foam for high-volume cushions and back pads.
- Feedstock premiums slow approval because buyers compare bio-based foam against standard petrochemical foam costs.
- Closed-loop foam trials create opportunity as recovered polyols and bio-based inputs can be combined in seating programs.
Seat foam is now part of material carbon discussions because it is a high-volume polymer inside the cabin. The Council of the European Union adopted its position on the end-of-life vehicles regulation in June 2025 and included a mandatory target for recycled plastics. Polyurethane foam is not solved by mechanical recycling alone, so bio-based and circular polyol routes are being evaluated together.
Some of the significant restraints are cost and proof. Buyers need the foam to pass comfort and fogging and odor and emissions and flammability and durability tests before any renewable-content claim matters. BASF’s biomass balance systems show that lower-carbon routes are moving into flexible polyurethane supply, but price acceptance depends on OEM material scorecards.
Untapped opportunity for players is in hybrid foam systems that combine renewable content with recycled polyol. Dow with Jaguar Land Rover and Adient said in November 2024 that closed-loop seat foam content was successfully used in automotive production for the first time. Production scale testing planned in early 2025 made this a practical signal for future seating material decisions. Molded foam demand remains the closest manufacturing link for cushion qualification.
Analysis of Bio-Based Polyurethane Foam for Automotive Interiors Market by Key Countries
.webp "Top Country Growth Comparison Bio Based Polyurethane Foam For Automotive Interiors Market Cagr (2026 2036)")
| Country | CAGR |
|---|---|
| United States | 11.7% CAGR |
| China | 12.9% CAGR |
| India | 13.6% CAGR |
| Germany | 10.9% CAGR |
| Japan | 10.6% CAGR |
| South Korea | 12.1% CAGR |
| Mexico | 12.3% CAGR |
Source: Future Market Insights, 2026.
Bio-Based Polyurethane Foam for Automotive Interiors Market CAGR Analysis by Country
- India is forecast to grow faster than the global average because passenger vehicle output and local seating supply are both expanding.
- China is projected above the global average because vehicle output and new energy vehicle production support fast material trials.
- Mexico is forecast above the global average because light trucks carry larger seat foam volumes and export programs need supplier localization.
- Germany and Japan are forecast below the global average because mature production bases move more slowly from trial validation to high-volume use.
- South Korea is forecast slightly above the global average because domestic seat suppliers serve export-oriented platforms with material documentation needs.
Demand for bio-based polyurethane foam for automotive interiors is forecast to rise at 11.8% CAGR from 2026 to 2036. Country analysis covers vehicle production hubs where seating suppliers and chemical producers can move renewable-content foam from samples into platform awards. Nonpackaging foam applications show how seating and acoustic parts sit outside packaging demand.
Demand Outlook for Bio-Based Polyurethane Foam for Automotive Interiors in the United States
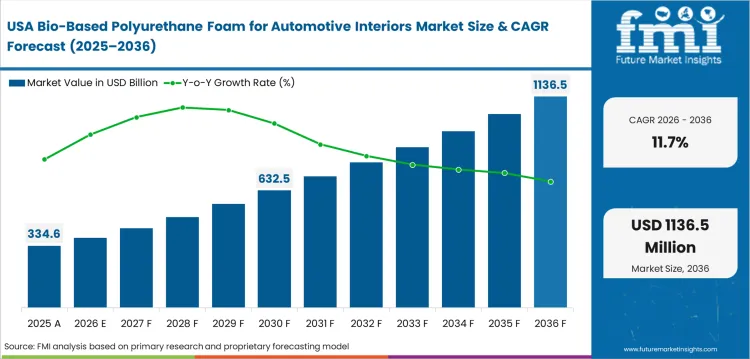
The United States has a large replacement and new vehicle base that keeps seating suppliers close to OEM program decisions. The Federal Reserve Bank of St. Louis reported USA light vehicle sales at 16.328 million units on a seasonally adjusted annual rate basis in March 2026. The United States is projected to record an 11.7% CAGR through 2036 because automakers want lower-carbon interior materials without adding seating plant complexity.
- Michigan and Ohio seating clusters can qualify bio-based foam where complete seat assembly is near OEM plants.
- Southern USA vehicle plants create demand for foam systems that fit high-throughput cushion molding.
- California and other low-emission vehicle states influence material claims through electric vehicle purchasing behavior.
Sales Analysis of Bio-Based Polyurethane Foam for Automotive Interiors in China
China is the largest vehicle production base and gives foam suppliers a broad route to test renewable-content systems. The State Council of the People’s Republic of China reported total auto output of 34.531 million units in 2025, up 10.4% from 2024. China is expected to expand at 12.9% CAGR through 2036 because new energy vehicle platforms and domestic seating capacity support faster qualification cycles.
- Shanghai and Guangdong programs can test bio-based foam in electric vehicle interiors with high cabin differentiation.
- Local chemical suppliers can compete when they document renewable input and foam emissions performance.
- Export-focused models need material records that can satisfy European circularity and product carbon reviews.
Demand Outlook for Bio-Based Polyurethane Foam for Automotive Interiors in India
India is moving from assembly depth toward a broader vehicle component base. The Press Information Bureau reported passenger vehicle production of 53.8 lakh units and commercial vehicle production of 11.1 lakh units during January to December 2025. India is forecast to grow at 13.6% CAGR through 2036 because domestic vehicle programs and global supplier plants are widening the buyer base for bio-based seat foam.
- Gujarat and Tamil Nadu vehicle clusters can support local foam supply near assembly plants.
- Price sensitivity is expected to keep renewable content modest unless suppliers show processing fit and stable foam cost.
- Domestic chemical input development can raise volume if local polyol sourcing reduces import exposure.
Opportunity Analysis of Bio-Based Polyurethane Foam for Automotive Interiors in Germany
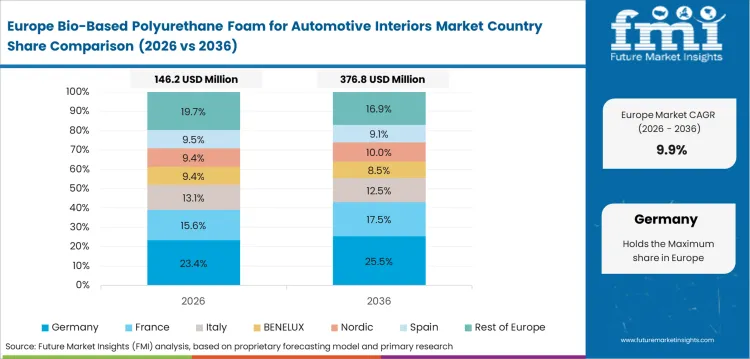
Germany remains a high-specification interior market where material approval is tied to engineering proof. The German Association of the Automotive Industry reported 2.5 million passenger cars made in Germany during the first seven months of 2025. Germany is expected to advance at 10.9% CAGR through 2036 because premium vehicle interiors can absorb higher documentation and qualification cost.
- Bavaria and Baden-Wurttemberg seating programs need clear data on emissions and odor and foam aging.
- German suppliers can lead in mass-balance documentation when automakers compare material carbon claims.
- Higher energy and labor costs limit faster conversion unless renewable foam avoids retooling.
Future Outlook for Bio-Based Polyurethane Foam for Automotive Interiors in Japan
Japanese automakers are careful material approvers because comfort and durability standards are high. Japan Automobile Manufacturers Association reported in May 2025 that Japanese automakers produced 3.28 million vehicles locally in the United States during 2024. Japan is projected to rise at 10.6% CAGR through 2036 as global Japanese platforms qualify renewable-content interiors through conservative test cycles.
- Nagoya-centered vehicle engineering gives suppliers a route into global seating platforms.
- Low-odor foam will matter because cabin quality expectations are tightly managed in Japanese brands.
- Volume conversion will depend on proof that bio-based input does not change cushion feel across climates.
Sales Analysis of Bio-Based Polyurethane Foam for Automotive Interiors in South Korea
South Korea links domestic seat suppliers with global export programs. Invest Korea reported domestic automobile production of 4.1 million units in 2025 and record vehicle exports of USD 72.0 billion. South Korea is forecast at 12.1% CAGR through 2036 because export vehicles need material evidence for Europe and North America.
- Ulsan and Gyeonggi supplier networks can test bio-based foam near Hyundai and Kia programs.
- Seat suppliers can use renewable-content foam to support model-level material carbon disclosures.
- Export exposure makes documentation depth more important than the renewable-content claim alone.
Future Outlook for Bio-Based Polyurethane Foam for Automotive Interiors in Mexico
Mexico’s light truck mix creates a high foam-per-vehicle opportunity for seat cushion suppliers. Instituto Nacional de Estadistica y Geografia reported 3.95 million light vehicles produced in 2025. Light trucks represented 77.2% of output. Mexico is expected to post 12.3% CAGR through 2036 because nearshoring and export programs support local material qualification.
- Northern Mexico seat and trim plants can serve U.S. programs with shorter logistics routes.
- Light truck output creates higher cushion and back-pad foam volume per vehicle than small-car programs.
- Tariff and trade uncertainty can slow approval if buyers delay new material changes before model refreshes.
Competitive Landscape and Strategic Positioning
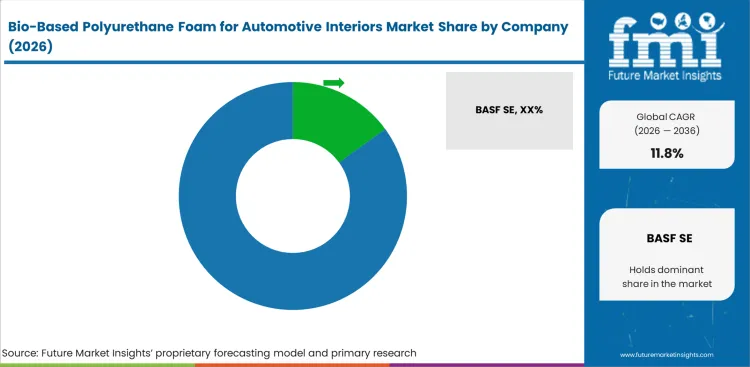
- Competition is organized around raw material access with seating foam validation and program documentation. Automotive seating systems help explain why Tier 1 seat makers control approval timing.
- Chemical suppliers shape polyol and isocyanate routes that decide bio-content with emissions and molding behavior.
- Seating suppliers win when they translate those inputs into cushions that pass OEM comfort and durability tests.
- Entry barriers include repeatable foam behavior and odor control. Validation cost and chain-of-custody proof add another gate for renewable input.
Key players in the industry such as BASF are using a biomass balance route to move lower-carbon polyurethane systems into familiar foam processes. The company said its March 2025 flexible polyurethane foam systems could reduce product carbon footprint by up to 75% compared with conventional BASF systems. For automotive interiors, this matters because foam plants prefer input changes that avoid new capital spending. The automotive seating systems outlook helps explain why Tier 1 seat suppliers control qualification timing for bio-based foam programs.
Huntsman is positioning polyurethane chemistry around bio-based polyols and recyclability options. In January 2024, the company listed novel PU-based automotive seating foams that can be made using bio-based polyols and allow recyclability options. This puts the company in the supplier group that can serve early seating qualification work.
Seat makers and interior integrators hold the conversion gate. Magna’s April 2026 EcoSphere note describes bio-based foam with up to 20% renewable content and a second bio plus recycled system. Dow with Jaguar Land Rover and Adient showed the adjacent route in November 2024 by using closed-loop seat foam content in automotive production.
Key Companies in the Bio-Based Polyurethane Foam for Automotive Interiors Market
Competition is best read by role because raw material suppliers and seat system suppliers hold different points of control.
- Polyurethane Chemistry Suppliers: BASF SE and Huntsman Corporation and Dow Inc. influence polyol and isocyanate and additive and mass-balance input decisions.
- Seat and Interior Foam Specialists: Woodbridge and Adient plc and Magna International and Lear Corporation translate foam chemistry into vehicle interior parts.
- Qualification Advantage: Suppliers with emissions data with odor testing and compression behavior and chain-of-custody records are better placed for platform awards.
Competitive Benchmarking: Bio-Based Polyurethane Foam for Automotive Interiors Market
| Company | Renewable Input Depth | Seating Validation Depth | Documentation Support | Geographic Footprint |
|---|---|---|---|---|
| BASF SE | High | Medium | Strong | Global with North American and European polyurethane systems depth |
| Huntsman Corporation | High | Medium | Strong | Global polyurethane supplier with automotive seating formulation activity |
| Dow Inc. | High | Strong | Strong | Global materials supplier with circular seating foam collaboration |
| Woodbridge | Medium | High | Medium | North America centered with automotive interior foam specialization |
| Adient plc | Medium | High | Strong | Global seating supplier with OEM platform access |
| Magna International | Medium | High | Medium | Global seating and interior integrator with EcoSphere foam work |
| Lear Corporation | Medium | High | Medium | Global seating supplier with foam and recyclable cushion alternatives |
Key Developments in Bio-Based Polyurethane Foam for Automotive Interiors Market
- In January 2025, Adient reported a 38% reduction in global scope 1 and scope 2 absolute greenhouse gas emissions from its 2019 base year.
- In March 2025, BASF introduced biomass balance flexible polyurethane foam systems for North America with potential product carbon footprint reduction of up to 75%.
- In April 2026, Magna described EcoSphere bio-based foam with up to 20% renewable content for automotive seating applications.
- In February 2025, Lear integrated ComfortMax seat engineering technology with General Motors and referenced FlexAir as an alternative to polyurethane foam.
Key Players in the Bio-Based Polyurethane Foam for Automotive Interiors Market
Major Global Players:
- BASF SE
- Huntsman Corporation
- Dow Inc.
- Adient plc
- Magna International
- Lear Corporation
Specialist and Regional Player:
- Woodbridge
Report Scope and Coverage
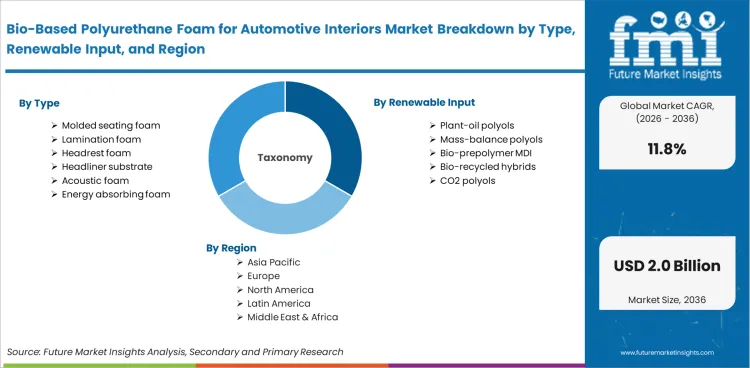
| Item | Value |
|---|---|
| Quantitative Units | USD 0.66 billion in 2026 to USD 2.01 billion by 2036 at 11.8% CAGR |
| Market Definition | Bio-based polyurethane foam systems used in automotive interior seating and trim parts |
| Foam Type | Molded seating foam, Lamination foam, Headrest foam, Headliner substrate, Acoustic foam, Energy absorbing foam |
| Renewable Input | Plant-oil polyols, Mass-balance polyols, Bio-prepolymer MDI, Bio-recycled hybrids, CO2 polyols |
| Interior Application | Seat cushions, Seat backs, Headrests, Armrests, Headliners, Door pads, Acoustic pads |
| Vehicle Class | Passenger vehicles, Light trucks, Electric vehicles, Commercial vans, Buses |
| Regions Covered | North America, Latin America, Western Europe, Eastern Europe, East Asia, South Asia Pacific, Middle East and Africa |
| Countries Covered | United States, China, India, Germany, Japan, South Korea, Mexico |
| Key Companies Profiled | BASF SE, Huntsman Corporation, Dow Inc., Woodbridge, Adient plc, Magna International, Lear Corporation |
| Forecast Period | 2026 to 2036 |
| Approach | Bottom-up foam content model triangulated with vehicle output, supplier activity, and primary interview logic |
Bio-Based Polyurethane Foam for Automotive Interiors Market Breakdown by Foam Type, Renewable Input, Interior Application,
By Foam Type
- Molded seating foam
- Lamination foam
- Headrest foam
- Headliner substrate
- Acoustic foam
- Energy absorbing foam
By Renewable Input
- Plant-oil polyols
- Mass-balance polyols
- Bio-prepolymer MDI
- Bio-recycled hybrids
- CO2 polyols
By Interior Application
- Seat cushions
- Seat backs
- Headrests
- Armrests
- Headliners
- Door pads
- Acoustic pads
By Vehicle Class
- Passenger vehicles
- Light trucks
- Electric vehicles
- Commercial vans
- Buses
By Supply Route
- Tier 1 suppliers
- Foam converters
- Chemical suppliers
- Direct OEM
- Aftermarket
By Certification Model
- Mass-balance certified
- Bio-content tested
- LCA declared
- Low-VOC compliant
- Recycled blend
By Region
- North America
- Latin America
- Western Europe
- Eastern Europe
- East Asia
- South Asia Pacific
- Middle East and Africa
Research Sources and Bibliography
- European Automobile Manufacturers’ Association. (2026, April). Economic and market report: Full year 2025.
- Federal Reserve Bank of St. Louis. (2026, April 30). Light Weight Vehicle Sales: Autos and Light Trucks. Source data from the U.S. Bureau of Economic Analysis.
- The State Council of the People’s Republic of China. (2026, January 14). China’s auto output and sales reach new highs in 2025.
- Press Information Bureau, Government of India. (2026, February 10). Status of heavy industries sector.
- German Association of the Automotive Industry. (2025, August 4). Production and market in July 2025.
- Japan Automobile Manufacturers Association. (2025, May 22). JAMA press conference May 2025.
- Invest Korea. (2026, January 15). South Korea’s auto exports hit record USD 72 billion in 2025.
- Instituto Nacional de Estadistica y Geografia. (2026, January 9). Registro Administrativo de la Industria Automotriz de Vehículos Ligeros.
- BASF SE. (2025, March 27). BASF introduces biomass balance flexible polyurethane foam systems for the North American furniture industry.
- Huntsman Corporation. (2024, January 19). Huntsman to share its polyurethane work at UTECH Europe.
- Dow Inc. (2024, November 27). Dow with Jaguar Land Rover and Adient develop circularity work for automotive seating.
- Magna International Inc. (2026, April 20). EcoSphere automotive foam update.
- Adient plc. (2025, January 29). 2024 corporate responsibility update.
- Lear Corporation. (2025, February 5). Lear integrates ComfortMax seat engineering technology with General Motors.
- Council of the European Union. (2025, June 17). Circular economy: Council adopts position on the recycling of vehicles at the end of their life.
This Report Answers
- What is the current and future size of the bio-based polyurethane foam for automotive interiors market?
- How fast is the bio-based polyurethane foam for automotive interiors market forecast to expand between 2026 and 2036?
- Which foam type is projected to lead demand by 2026?
- Which renewable input is forecast to account for the largest share in 2026?
- Why are seat cushions and passenger vehicles important for this market?
- How do feedstock premiums and qualification testing affect approval timelines?
- Which countries are projected to record faster expansion during the forecast period?
- Who are the main companies active in bio-based polyurethane foam for automotive interiors?
Frequently Asked Questions
How large is the Bio-Based Polyurethane Foam for Automotive Interiors Market in 2026?
The market is estimated at USD 0.66 billion in 2026. The estimate is based on vehicle output with foam use and renewable-content penetration.
What is the Bio-Based Polyurethane Foam for Automotive Interiors Market forecast for 2036?
The market is projected to reach USD 2.01 billion by 2036 as seat foam programs add renewable-content formulations across larger model families.
Which segment leads the Bio-Based Polyurethane Foam for Automotive Interiors Market?
Passenger vehicles lead vehicle class demand with 63.0% share in 2026 because interior comfort packages are concentrated in higher-volume cabin programs.
Which country grows fastest in the Bio-Based Polyurethane Foam for Automotive Interiors Market?
India records the fastest country outlook at 13.6% CAGR through 2036 because vehicle production and seating supply are widening together.
Why are automakers using bio-based polyurethane foam in automotive interiors?
Automakers are testing these foams to reduce fossil-carbon content while keeping familiar comfort and safety and molding performance requirements intact.
Preview the report firsthand - request a free sample
Get SampleGet the brochure for pricing and purchase details.
Get PDFTable of Content
- Key Takeaways
- Market Size and CAGR
- Top Growth Driver
- Fastest Growing Segment
- Leading Region
- Key Companies
- Emerging Opportunities
- Executive Summary
- Global Market Outlook
- Demand-side Trends
- Supply-side Trends
- Technology Roadmap Analysis
- Analysis and Recommendations
- Analyst Perspective (What is happening? Why now? What should investors know?)
- Key Questions Answered
- How large is the market?
- What is the CAGR?
- What are key trends?
- Which region dominates?
- Who are the leaders?
- Market Overview
- Market Coverage / Taxonomy
- Market Definition / Scope / Limitations
- Research Methodology
- Chapter Orientation
- Analytical Lens and Working Hypotheses
- Market Structure, Signals, and Trend Drivers
- Benchmarking and Cross-market Comparability
- Market Sizing, Forecasting, and Opportunity Mapping
- Research Design and Evidence Framework
- Desk Research Programme (Secondary Evidence)
- Expert Input and Fieldwork (Primary Evidence)
- Tooling, Models, and Reference Databases
- Data Engineering and Model Build
- Quality Assurance and Audit Trail
- Market Background
- Market Dynamics (Drivers, Restraints, Opportunity, Trends)
- Scenario Forecast (Optimistic, Likely, Conservative)
- Impact Analysis
- AI Impact
- Sustainability Impact
- Regulatory Impact
- Technology Impact
- Consumer / Buyer Analysis
- Purchase Drivers
- Adoption Barriers
- Buyer Journey
- Opportunity Map Analysis
- Product Life Cycle Analysis
- Supply Chain Analysis
- Investment Feasibility Matrix
- Value Chain Analysis
- PESTLE and Porter's Analysis
- Regulatory Landscape
- Regional Parent Market Outlook
- Production and Consumption Statistics
- Import and Export Statistics
- Global Market Analysis and Forecast, 2021 to 2036
- Historical Market Size Value (USD Million) & Volume (Unit) Analysis, 2021 to 2025
- Current and Future Market Size Value (USD Million) & Volume (Unit) Projections, 2026 to 2036
- Y-o-Y Growth Trend Analysis
- Absolute $ Opportunity Analysis
- Global Market Pricing Analysis, 2021 to 2036
- Global Market Analysis and Forecast, By Foam Type, 2021 to 2036
- Introduction / Key Findings
- Historical Market Size Value (USD Million) & Volume (Unit) Analysis By Foam Type, 2021 to 2025
- Current and Future Market Size Value (USD Million) & Volume (Unit) Analysis and Forecast By Foam Type, 2026 to 2036
- Molded seating foam
- Lamination foam
- Headrest foam
- Headliner substrate
- Acoustic foam
- Energy absorbing foam
- Molded seating foam
- Y-o-Y Growth Trend Analysis By Foam Type, 2021 to 2025
- Absolute $ Opportunity Analysis By Foam Type, 2026 to 2036
- Global Market Analysis and Forecast, By Renewable Input, 2021 to 2036
- Introduction / Key Findings
- Historical Market Size Value (USD Million) & Volume (Unit) Analysis By Renewable Input, 2021 to 2025
- Current and Future Market Size Value (USD Million) & Volume (Unit) Analysis and Forecast By Renewable Input, 2026 to 2036
- Plant-oil polyols
- Mass-balance polyols
- Bio-prepolymer MDI
- Bio-recycled hybrids
- CO2 polyols
- Plant-oil polyols
- Y-o-Y Growth Trend Analysis By Renewable Input, 2021 to 2025
- Absolute $ Opportunity Analysis By Renewable Input, 2026 to 2036
- Global Market Analysis and Forecast, By Interior Application, 2021 to 2036
- Introduction / Key Findings
- Historical Market Size Value (USD Million) & Volume (Unit) Analysis By Interior Application, 2021 to 2025
- Current and Future Market Size Value (USD Million) & Volume (Unit) Analysis and Forecast By Interior Application, 2026 to 2036
- Seat cushions
- Seat backs
- Headrests
- Armrests
- Headliners
- Door pads
- Acoustic pads
- Seat cushions
- Y-o-Y Growth Trend Analysis By Interior Application, 2021 to 2025
- Absolute $ Opportunity Analysis By Interior Application, 2026 to 2036
- Global Market Analysis and Forecast, By Vehicle Class, 2021 to 2036
- Introduction / Key Findings
- Historical Market Size Value (USD Million) & Volume (Unit) Analysis By Vehicle Class, 2021 to 2025
- Current and Future Market Size Value (USD Million) & Volume (Unit) Analysis and Forecast By Vehicle Class, 2026 to 2036
- Passenger vehicles
- Light trucks
- Electric vehicles
- Commercial vans
- Buses
- Passenger vehicles
- Y-o-Y Growth Trend Analysis By Vehicle Class, 2021 to 2025
- Absolute $ Opportunity Analysis By Vehicle Class, 2026 to 2036
- Global Market Analysis and Forecast, By Supply Route, 2021 to 2036
- Introduction / Key Findings
- Historical Market Size Value (USD Million) & Volume (Unit) Analysis By Supply Route, 2021 to 2025
- Current and Future Market Size Value (USD Million) & Volume (Unit) Analysis and Forecast By Supply Route, 2026 to 2036
- Tier 1 suppliers
- Foam converters
- Chemical suppliers
- Direct OEM
- Aftermarket
- Tier 1 suppliers
- Y-o-Y Growth Trend Analysis By Supply Route, 2021 to 2025
- Absolute $ Opportunity Analysis By Supply Route, 2026 to 2036
- Global Market Analysis and Forecast, By Certification Model
- Introduction / Key Findings
- Historical Market Size Value (USD Million) & Volume (Unit) Analysis By Certification Model, 2021 to 2025
- Current and Future Market Size Value (USD Million) & Volume (Unit) Analysis and Forecast By Certification Model, 2026 to 2036
- Mass-balance certified
- Bio-content tested
- LCA declared
- Low-VOC compliant
- Recycled blend
- Mass-balance certified
- Y-o-Y Growth Trend Analysis By Certification Model, 2021 to 2025
- Absolute $ Opportunity Analysis By Certification Model, 2026 to 2036
- Global Market Analysis and Forecast, By Region, 2021 to 2036
- Introduction
- Historical Market Size Value (USD Million) & Volume (Unit) Analysis By Region, 2021 to 2025
- Current Market Size Value (USD Million) & Volume (Unit) Analysis and Forecast By Region, 2026 to 2036
- North America
- Latin America
- Western Europe
- Eastern Europe
- East Asia
- South Asia and Pacific
- Middle East & Africa
- Market Attractiveness Analysis By Region
- North America Market Analysis and Forecast, By Country, 2021 to 2036
- Historical Market Size Value (USD Million) & Volume (Unit) Trend Analysis By Market Taxonomy, 2021 to 2025
- Market Size Value (USD Million) & Volume (Unit) Forecast By Market Taxonomy, 2026 to 2036
- By Country
- USA
- Canada
- Mexico
- By Foam Type
- By Renewable Input
- By Interior Application
- By Vehicle Class
- By Supply Route
- By Certification Model
- By Country
- Market Attractiveness Analysis
- By Country
- By Foam Type
- By Renewable Input
- By Interior Application
- By Vehicle Class
- By Supply Route
- By Certification Model
- Key Takeaways
- Latin America Market Analysis and Forecast, By Country
- Historical Market Size Value (USD Million) & Volume (Unit) Trend Analysis By Market Taxonomy, 2021 to 2025
- Market Size Value (USD Million) & Volume (Unit) Forecast By Market Taxonomy, 2026 to 2036
- By Country
- Brazil
- Chile
- Rest of Latin America
- By Foam Type
- By Renewable Input
- By Interior Application
- By Vehicle Class
- By Supply Route
- By Certification Model
- By Country
- Market Attractiveness Analysis
- By Country
- By Foam Type
- By Renewable Input
- By Interior Application
- By Vehicle Class
- By Supply Route
- By Certification Model
- Key Takeaways
- Western Europe Market Analysis and Forecast, By Country
- Historical Market Size Value (USD Million) & Volume (Unit) Trend Analysis By Market Taxonomy, 2021 to 2025
- Market Size Value (USD Million) & Volume (Unit) Forecast By Market Taxonomy, 2026 to 2036
- By Country
- Germany
- UK
- Italy
- Spain
- France
- Nordic
- BENELUX
- Rest of Western Europe
- By Foam Type
- By Renewable Input
- By Interior Application
- By Vehicle Class
- By Supply Route
- By Certification Model
- By Country
- Market Attractiveness Analysis
- By Country
- By Foam Type
- By Renewable Input
- By Interior Application
- By Vehicle Class
- By Supply Route
- By Certification Model
- Key Takeaways
- Eastern Europe Market Analysis and Forecast, By Country
- Historical Market Size Value (USD Million) & Volume (Unit) Trend Analysis By Market Taxonomy, 2021 to 2025
- Market Size Value (USD Million) & Volume (Unit) Forecast By Market Taxonomy, 2026 to 2036
- By Country
- Russia
- Poland
- Hungary
- Balkan & Baltic
- Rest of Eastern Europe
- By Foam Type
- By Renewable Input
- By Interior Application
- By Vehicle Class
- By Supply Route
- By Certification Model
- By Country
- Market Attractiveness Analysis
- By Country
- By Foam Type
- By Renewable Input
- By Interior Application
- By Vehicle Class
- By Supply Route
- By Certification Model
- Key Takeaways
- East Asia Market Analysis and Forecast, By Country
- Historical Market Size Value (USD Million) & Volume (Unit) Trend Analysis By Market Taxonomy, 2021 to 2025
- Market Size Value (USD Million) & Volume (Unit) Forecast By Market Taxonomy, 2026 to 2036
- By Country
- China
- Japan
- South Korea
- By Foam Type
- By Renewable Input
- By Interior Application
- By Vehicle Class
- By Supply Route
- By Certification Model
- By Country
- Market Attractiveness Analysis
- By Country
- By Foam Type
- By Renewable Input
- By Interior Application
- By Vehicle Class
- By Supply Route
- By Certification Model
- Key Takeaways
- South Asia and Pacific Market Analysis and Forecast, By Country
- Historical Market Size Value (USD Million) & Volume (Unit) Trend Analysis By Market Taxonomy, 2021 to 2025
- Market Size Value (USD Million) & Volume (Unit) Forecast By Market Taxonomy, 2026 to 2036
- By Country
- India
- ASEAN
- Australia & New Zealand
- Rest of South Asia and Pacific
- By Foam Type
- By Renewable Input
- By Interior Application
- By Vehicle Class
- By Supply Route
- By Certification Model
- By Country
- Market Attractiveness Analysis
- By Country
- By Foam Type
- By Renewable Input
- By Interior Application
- By Vehicle Class
- By Supply Route
- By Certification Model
- Key Takeaways
- Middle East & Africa Market Analysis and Forecast, By Country
- Historical Market Size Value (USD Million) & Volume (Unit) Trend Analysis By Market Taxonomy, 2021 to 2025
- Market Size Value (USD Million) & Volume (Unit) Forecast By Market Taxonomy, 2026 to 2036
- By Country
- Kingdom of Saudi Arabia
- Other GCC Countries
- Türkiye
- South Africa
- Other African Union
- Rest of Middle East & Africa
- By Foam Type
- By Renewable Input
- By Interior Application
- By Vehicle Class
- By Supply Route
- By Certification Model
- By Country
- Market Attractiveness Analysis
- By Country
- By Foam Type
- By Renewable Input
- By Interior Application
- By Vehicle Class
- By Supply Route
- By Certification Model
- Key Takeaways
- Key Countries Market Analysis
- USA
- Pricing Analysis
- Market Share Analysis, 2025
- By Foam Type
- By Renewable Input
- By Interior Application
- By Vehicle Class
- By Supply Route
- By Certification Model
- Canada
- Pricing Analysis
- Market Share Analysis, 2025
- By Foam Type
- By Renewable Input
- By Interior Application
- By Vehicle Class
- By Supply Route
- By Certification Model
- Mexico
- Pricing Analysis
- Market Share Analysis, 2025
- By Foam Type
- By Renewable Input
- By Interior Application
- By Vehicle Class
- By Supply Route
- By Certification Model
- Brazil
- Pricing Analysis
- Market Share Analysis, 2025
- By Foam Type
- By Renewable Input
- By Interior Application
- By Vehicle Class
- By Supply Route
- By Certification Model
- Chile
- Pricing Analysis
- Market Share Analysis, 2025
- By Foam Type
- By Renewable Input
- By Interior Application
- By Vehicle Class
- By Supply Route
- By Certification Model
- Germany
- Pricing Analysis
- Market Share Analysis, 2025
- By Foam Type
- By Renewable Input
- By Interior Application
- By Vehicle Class
- By Supply Route
- By Certification Model
- UK
- Pricing Analysis
- Market Share Analysis, 2025
- By Foam Type
- By Renewable Input
- By Interior Application
- By Vehicle Class
- By Supply Route
- By Certification Model
- Italy
- Pricing Analysis
- Market Share Analysis, 2025
- By Foam Type
- By Renewable Input
- By Interior Application
- By Vehicle Class
- By Supply Route
- By Certification Model
- Spain
- Pricing Analysis
- Market Share Analysis, 2025
- By Foam Type
- By Renewable Input
- By Interior Application
- By Vehicle Class
- By Supply Route
- By Certification Model
- France
- Pricing Analysis
- Market Share Analysis, 2025
- By Foam Type
- By Renewable Input
- By Interior Application
- By Vehicle Class
- By Supply Route
- By Certification Model
- India
- Pricing Analysis
- Market Share Analysis, 2025
- By Foam Type
- By Renewable Input
- By Interior Application
- By Vehicle Class
- By Supply Route
- By Certification Model
- ASEAN
- Pricing Analysis
- Market Share Analysis, 2025
- By Foam Type
- By Renewable Input
- By Interior Application
- By Vehicle Class
- By Supply Route
- By Certification Model
- Australia & New Zealand
- Pricing Analysis
- Market Share Analysis, 2025
- By Foam Type
- By Renewable Input
- By Interior Application
- By Vehicle Class
- By Supply Route
- By Certification Model
- China
- Pricing Analysis
- Market Share Analysis, 2025
- By Foam Type
- By Renewable Input
- By Interior Application
- By Vehicle Class
- By Supply Route
- By Certification Model
- Japan
- Pricing Analysis
- Market Share Analysis, 2025
- By Foam Type
- By Renewable Input
- By Interior Application
- By Vehicle Class
- By Supply Route
- By Certification Model
- South Korea
- Pricing Analysis
- Market Share Analysis, 2025
- By Foam Type
- By Renewable Input
- By Interior Application
- By Vehicle Class
- By Supply Route
- By Certification Model
- Russia
- Pricing Analysis
- Market Share Analysis, 2025
- By Foam Type
- By Renewable Input
- By Interior Application
- By Vehicle Class
- By Supply Route
- By Certification Model
- Poland
- Pricing Analysis
- Market Share Analysis, 2025
- By Foam Type
- By Renewable Input
- By Interior Application
- By Vehicle Class
- By Supply Route
- By Certification Model
- Hungary
- Pricing Analysis
- Market Share Analysis, 2025
- By Foam Type
- By Renewable Input
- By Interior Application
- By Vehicle Class
- By Supply Route
- By Certification Model
- Kingdom of Saudi Arabia
- Pricing Analysis
- Market Share Analysis, 2025
- By Foam Type
- By Renewable Input
- By Interior Application
- By Vehicle Class
- By Supply Route
- By Certification Model
- Türkiye
- Pricing Analysis
- Market Share Analysis, 2025
- By Foam Type
- By Renewable Input
- By Interior Application
- By Vehicle Class
- By Supply Route
- By Certification Model
- South Africa
- Pricing Analysis
- Market Share Analysis, 2025
- By Foam Type
- By Renewable Input
- By Interior Application
- By Vehicle Class
- By Supply Route
- By Certification Model
- USA
- Market Structure Analysis
- Competition Dashboard
- Competition Benchmarking
- Market Share Analysis of Top Players
- By Regional
- By Foam Type
- By Renewable Input
- By Interior Application
- By Vehicle Class
- By Supply Route
- By Certification Model
- Emerging Startups
- Innovation Benchmarking
- Competition Analysis
- Competition Deep Dive
- BASF SE
- Overview
- Product Portfolio
- Profitability by Market Segments (Product/Region/Sales Channel)
- Sales Footprint
- Strategy Overview
- Marketing Strategy
- Product Strategy
- Channel Strategy
- Huntsman Corporation
- Dow Inc.
- Adient plc
- Magna International
- Lear Corporation
- Woodbridge
- BASF SE
- Case Studies
- Success Stories
- Recent Developments
- Competition Deep Dive
- Assumptions & Acronyms Used


