Boston Round Glass Bottle Market Size and Share Forecast Outlook 2025 to 2035

The Boston Round Glass Bottle Market is estimated to be valued at USD 103.6 billion in 2025 and is projected to reach USD 178.7 billion by 2035, registering a compound annual growth rate (CAGR) of 5.6% over the forecast period.
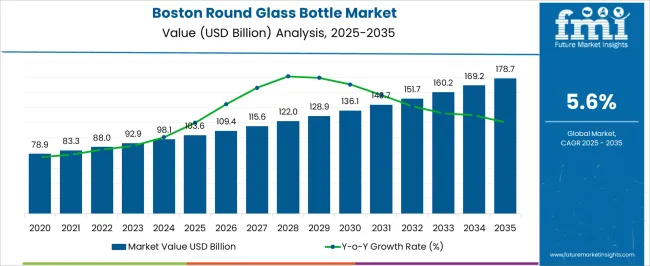
Quick Stats for Boston Round Glass Bottle Market

  • Boston Round Glass Bottle Market Value (2025): USD 103.6 billion
  • Boston Round Glass Bottle Market Forecast Value (2035): USD 178.7 billion
  • Boston Round Glass Bottle Market Forecast CAGR: 5.6%
  • Leading Segment in Boston Round Glass Bottle Market in 2025: 177 Ml - 414 Ml (35.2%)
  • Key Growth Regions in Boston Round Glass Bottle Market: North America, Asia-Pacific, Europe
  • Top Key Players in Boston Round Glass Bottle Market: Glaspac Manufacturing, Keraglass, Anchor Glass Container, Ardagh Group, DPG Glass, Corning Incorporated, Owens-Illinois, Beatson Clark, AGI Glaspac, Gerresheimer, Delphis Glass, Inc., Clinigen Group, SCHOTT, Wheaton Industries, SGD Pharma
Boston Round Glass Bottle Market Market Value Analysis

Boston Round Glass Bottle Market Key Takeaways

Metric Value
Boston Round Glass Bottle Market Estimated Value in (2025 E) USD 103.6 billion
Boston Round Glass Bottle Market Forecast Value in (2035 F) USD 178.7 billion
Forecast CAGR (2025 to 2035) 5.6%

Why is the Boston Round Glass Bottle Market Growing?

The Boston Round Glass Bottle market is witnessing consistent growth, driven by the increasing demand for durable and versatile glass packaging in industries such as pharmaceuticals, cosmetics, and essential oils. The adoption of Boston round bottles is being supported by their inherent chemical resistance, ability to preserve product quality, and suitability for a variety of liquid and semi-liquid formulations. Rising consumer preference for sustainable and reusable packaging is further enhancing market adoption, as glass is considered environmentally friendly compared to plastic alternatives.

Advancements in glass manufacturing processes, including improvements in strength, clarity, and uniformity, are increasing the reliability and appeal of Boston round bottles. Manufacturers are focusing on producing bottles that accommodate various filling and dispensing requirements, enabling seamless integration into automated packaging lines.

Regulatory emphasis on product safety, hygiene, and compatibility with sensitive formulations is also driving adoption As industries continue to prioritize sustainability, durability, and functional packaging solutions, the Boston Round Glass Bottle market is expected to experience steady growth over the next decade, supported by technological innovations and evolving consumer preferences.

Segmental Analysis

The boston round glass bottle market is segmented by capacity, cap style, neck finish, neck width, end use industry, and geographic regions. By capacity, boston round glass bottle market is divided into 177 Ml - 414 Ml, 15 Ml - 60 Ml, 60 Ml - 177 Ml, and 414 Ml - 950 Ml. In terms of cap style, boston round glass bottle market is classified into Dropper, Fine Mist Sprayer, Lotion Pump, and Others. Based on neck finish, boston round glass bottle market is segmented into 18 - 410, 18 - 400, 20 - 400, 22 - 400, 24 - 400, 28 - 400, and 33 - 400. By neck width, boston round glass bottle market is segmented into 18 Mm - 22 Mm and 24 Mm - 33 Mm. By end use industry, boston round glass bottle market is segmented into Personal Care, Pharmaceutical, Chemical Industrial, Food & Beverage, and Others. Regionally, the boston round glass bottle industry is classified into North America, Latin America, Western Europe, Eastern Europe, Balkan & Baltic Countries, Russia & Belarus, Central Asia, East Asia, South Asia & Pacific, and the Middle East & Africa.
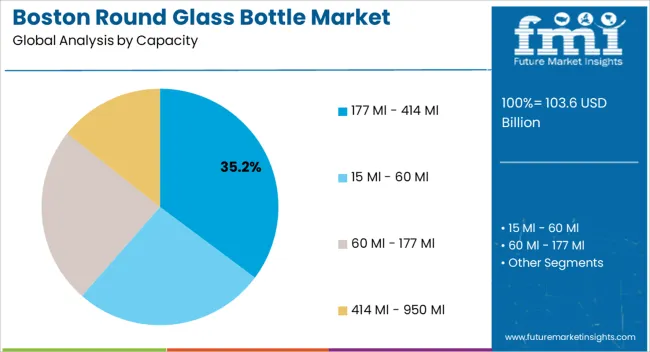
Insights into the 177 Ml - 414 Ml Capacity Segment

Boston Round Glass Bottle Market Analysis By Capacity

The 177 Ml - 414 Ml capacity segment is projected to hold 35.2% of the market revenue in 2025, establishing it as the leading capacity category. Growth in this segment is being driven by its versatility for a wide range of applications, including pharmaceuticals, nutraceuticals, and personal care products, where mid-sized packaging is preferred for ease of handling and storage. This capacity range allows manufacturers to balance product volume with transportation efficiency and cost-effectiveness, making it suitable for both retail and industrial distribution.

The segment benefits from compatibility with standard capping and dispensing systems, ensuring streamlined production and filling processes. Consumer preference for convenient, single-use, or moderately sized packaging is further enhancing adoption.

Additionally, the ability to combine this capacity with different closure types and neck finishes increases its applicability across diverse end-use industries As demand for functional, durable, and environmentally sustainable packaging solutions continues to grow, the 177 Ml - 414 Ml capacity segment is expected to maintain its market leadership.
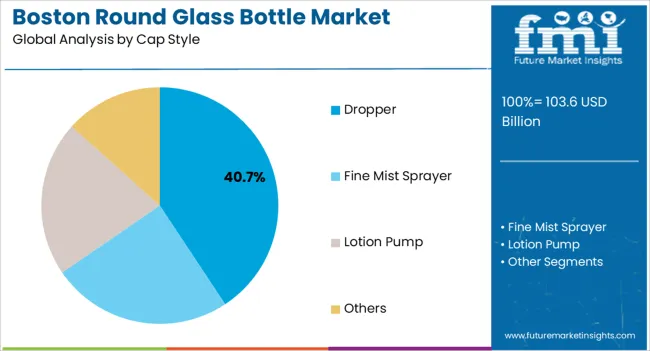
Insights into the Dropper Cap Style Segment

Boston Round Glass Bottle Market Analysis By Cap Style

The dropper cap style segment is expected to account for 40.7% of the market revenue in 2025, making it the leading closure type. Growth in this segment is being driven by the increasing need for precise liquid dispensing in pharmaceuticals, essential oils, and cosmetic formulations. Dropper caps enable controlled dosing, reduce spillage, and improve product usability, which enhances consumer satisfaction and safety.

Compatibility with standard mid-sized Boston round bottles ensures seamless integration into production and packaging lines. The segment is further supported by rising adoption in applications requiring frequent small-volume dispensing, such as serums, tinctures, and lab reagents.

Advances in materials and design, including tamper-evident and child-resistant features, are improving safety and compliance with industry regulations As the demand for precision dispensing and functional packaging increases across healthcare, personal care, and laboratory sectors, the dropper cap style is expected to remain the dominant closure type in the Boston Round Glass Bottle market.
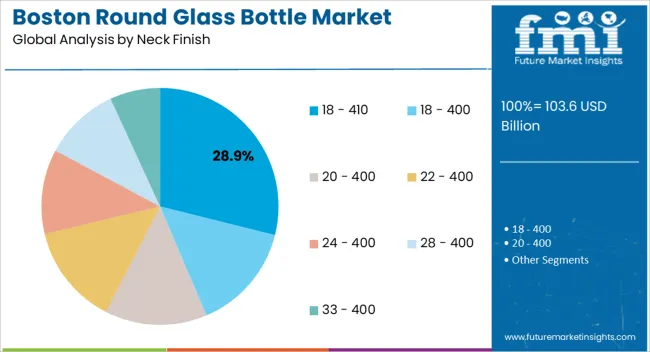
Insights into the 18 - 410 Neck Finish Segment

Boston Round Glass Bottle Market Analysis By Neck Finish

The 18 - 410 neck finish segment is projected to hold 28.9% of the market revenue in 2025, establishing it as the leading neck type. Its adoption is being driven by compatibility with a wide range of closure types, including droppers, screw caps, and spray pumps, which enhances versatility across multiple industries. This neck finish allows for secure sealing and efficient dispensing while maintaining product integrity, making it ideal for sensitive formulations such as pharmaceuticals and essential oils.

Manufacturing processes that ensure precise threading and durability contribute to consistent performance, reducing leakage and wastage. Rising demand for standardized bottle dimensions that facilitate packaging automation and supply chain efficiency is also driving adoption.

The ability to integrate with various filling and capping equipment further supports operational efficiency As industries increasingly prioritize reliable, safe, and versatile packaging solutions, the 18 - 410 neck finish segment is expected to maintain its leading position, supported by its adaptability and functional benefits.

Market Overview

Boston Round Glass Bottle Market Outlook (2025-2035)

Good quality bottles are becoming a vital constituent of modern life due to the avoidance of wastage, ease of transportation, storage and inclination of the consumer. These factors have led to the increasing demand for Boston round glass bottles as they provide robust resistance to successfully store any liquid, powdered specimens or solid samples.

Future Market Insights recent study suggests that the growth of the global Boston round glass bottles market is being driven by great quality offered by the bottles as they are assembled with the best material grade. In addition to this, the glass bottles frequently feature a broad-mouthed design for the practical addition and removal of materials.

The FMI report further indicated that the Boston round glass bottles are mostly preferred in the personal care and pharmaceutical industry, as these bottles can package high quality solid and liquid applications.

Studies suggest that these bottles are replacing traditional plastic bottles owing to their versatile application. Furthermore, these bottles are made up of glass, offering more strength and compatibility.

Research shows great potential of Boston round glass bottles that provide all the features such as-

  • Excellent convenience for carrying
  • High quality storage of liquid products
  • Solid and liquid applications
  • Resilience and adaptability
  • Customer experience
  • Revenue and profit growth
  • Easy to use designs
  • Business model innovation
  • Availability of different styles and colors

To reach potential outcomes, organizations are investing in intelligent and innovative packaging solutions such as Boston round glass bottles. Moreover, companies in the market are adopting new technology and launching new products. Not just organizations, but various regions of the world are pushing their limits to attain maximum growth in the industry.

Intelligent solutions are increasingly becoming an integral component of manufacturers as they evolve their portfolios and expand their capabilities in these dimensions and several others to meet a broader range of customer needs. Successful organizations partner with providers that understand their maturity, offer appropriate solutions, and provide insight to improve solutions and deliver better business outcomes.
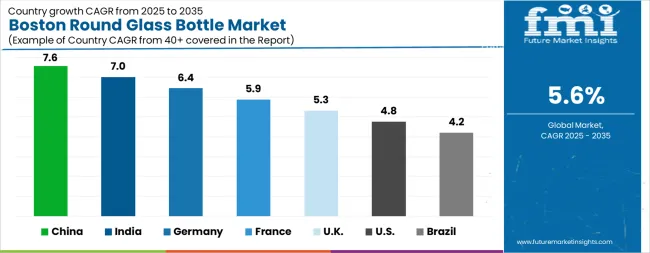
Analysis of Boston Round Glass Bottle Market By Key Countries

Boston Round Glass Bottle Market Cagr Analysis By Country

Country CAGR
China 7.6%
India 7.0%
Germany 6.4%
France 5.9%
UK 5.3%
USA 4.8%
Brazil 4.2%

Country-wise Analysis

The Boston Round Glass Bottle Market is expected to register a CAGR of 5.6% during the forecast period, exhibiting varied country level momentum. China leads with the highest CAGR of 7.6%, followed by India at 7.0%. Developed markets such as Germany, France, and the UK continue to expand steadily, while the USA is likely to grow at consistent rates. Brazil posts the lowest CAGR at 4.2%, yet still underscores a broadly positive trajectory for the global Boston Round Glass Bottle Market. In 2024, Germany held a dominant revenue in the Western Europe market and is expected to grow with a CAGR of 6.4%. The USA Boston Round Glass Bottle Market is estimated to be valued at USD 36.2 billion in 2025 and is anticipated to reach a valuation of USD 57.6 billion by 2035. Sales are projected to rise at a CAGR of 4.8% over the forecast period between 2025 and 2035. While Japan and South Korea markets are estimated to be valued at USD 5.7 billion and USD 3.5 billion respectively in 2025.
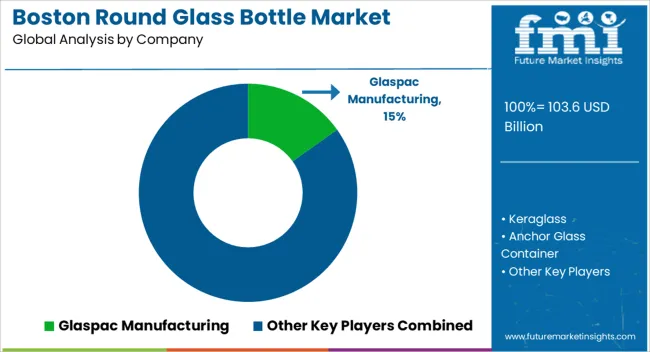
Key Players in the Boston Round Glass Bottle Market

Boston Round Glass Bottle Market Analysis By Company

  • Glaspac Manufacturing
  • Keraglass
  • Anchor Glass Container
  • Ardagh Group
  • DPG Glass
  • Corning Incorporated
  • Owens-Illinois
  • Beatson Clark
  • AGI Glaspac
  • Gerresheimer
  • Delphis Glass, Inc.
  • Clinigen Group
  • SCHOTT
  • Wheaton Industries
  • SGD Pharma

Scope of the Report

Item Value
Quantitative Units USD 103.6 Billion
Capacity 177 Ml - 414 Ml, 15 Ml - 60 Ml, 60 Ml - 177 Ml, and 414 Ml - 950 Ml
Cap Style Dropper, Fine Mist Sprayer, Lotion Pump, and Others
Neck Finish 18 - 410, 18 - 400, 20 - 400, 22 - 400, 24 - 400, 28 - 400, and 33 - 400
Neck Width 18 Mm - 22 Mm and 24 Mm - 33 Mm
End Use Industry Personal Care, Pharmaceutical, Chemical Industrial, Food & Beverage, and Others
Regions Covered North America, Europe, Asia-Pacific, Latin America, Middle East & Africa
Country Covered United States, Canada, Germany, France, United Kingdom, China, Japan, India, Brazil, South Africa
Key Companies Profiled Glaspac Manufacturing, Keraglass, Anchor Glass Container, Ardagh Group, DPG Glass, Corning Incorporated, Owens-Illinois, Beatson Clark, AGI Glaspac, Gerresheimer, Delphis Glass, Inc., Clinigen Group, SCHOTT, Wheaton Industries, and SGD Pharma

Boston Round Glass Bottle Market by Segments

Capacity:

  • 177 Ml - 414 Ml
  • 15 Ml - 60 Ml
  • 60 Ml - 177 Ml
  • 414 Ml - 950 Ml

Cap Style:

  • Dropper
  • Fine Mist Sprayer
  • Lotion Pump
  • Others

Neck Finish:

  • 18 - 410
  • 18 - 400
  • 20 - 400
  • 22 - 400
  • 24 - 400
  • 28 - 400
  • 33 - 400

Neck Width:

  • 18 Mm - 22 Mm
  • 24 Mm - 33 Mm

End Use Industry:

  • Personal Care
  • Pharmaceutical
  • Chemical Industrial
  • Food & Beverage
  • Others

Region:

  • North America
    • USA
    • Canada
    • Mexico
  • Latin America
    • Brazil
    • Chile
    • Rest of Latin America
  • Western Europe
    • Germany
    • UK
    • Italy
    • Spain
    • France
    • Nordic
    • BENELUX
    • Rest of Western Europe
  • Eastern Europe
    • Russia
    • Poland
    • Hungary
    • Balkan & Baltic
    • Rest of Eastern Europe
  • East Asia
    • China
    • Japan
    • South Korea
  • South Asia and Pacific
    • India
    • ASEAN
    • Australia & New Zealand
    • Rest of South Asia and Pacific
  • Middle East & Africa
    • Kingdom of Saudi Arabia
    • Other GCC Countries
    • Turkiye
    • South Africa
    • Other African Union
    • Rest of Middle East & Africa

Frequently Asked Questions

How big is the boston round glass bottle market in 2025?

The global boston round glass bottle market is estimated to be valued at USD 103.6 billion in 2025.

What will be the size of boston round glass bottle market in 2035?

The market size for the boston round glass bottle market is projected to reach USD 178.7 billion by 2035.

How much will be the boston round glass bottle market growth between 2025 and 2035?

The boston round glass bottle market is expected to grow at a 5.6% CAGR between 2025 and 2035.

What are the key product types in the boston round glass bottle market?

The key product types in boston round glass bottle market are 177 ml - 414 ml, 15 ml - 60 ml, 60 ml - 177 ml and 414 ml - 950 ml.

Which cap style segment to contribute significant share in the boston round glass bottle market in 2025?

In terms of cap style, dropper segment to command 40.7% share in the boston round glass bottle market in 2025.

Table of Content

  1. Executive Summary
    • Global Market Outlook
    • Demand-side Trends
    • Supply-side Trends
    • Technology Roadmap Analysis
    • Analysis and Recommendations
  2. Market Overview
    • Market Coverage / Taxonomy
    • Market Definition / Scope / Limitations
  3. Market Background
    • Market Dynamics
      • Drivers
      • Restraints
      • Opportunity
      • Trends
    • Scenario Forecast
      • Demand in Optimistic Scenario
      • Demand in Likely Scenario
      • Demand in Conservative Scenario
    • Opportunity Map Analysis
    • Product Life Cycle Analysis
    • Supply Chain Analysis
    • Investment Feasibility Matrix
    • Value Chain Analysis
    • PESTLE and Porter’s Analysis
    • Regulatory Landscape
    • Regional Parent Market Outlook
    • Production and Consumption Statistics
    • Import and Export Statistics
  4. Global Market Analysis 2020 to 2024 and Forecast, 2025 to 2035
    • Historical Market Size Value (USD Million) Analysis, 2020 to 2024
    • Current and Future Market Size Value (USD Million) Projections, 2025 to 2035
      • Y-o-Y Growth Trend Analysis
      • Absolute $ Opportunity Analysis
  5. Global Market Pricing Analysis 2020 to 2024 and Forecast 2025 to 2035
  6. Global Market Analysis 2020 to 2024 and Forecast 2025 to 2035, By Capacity
    • Introduction / Key Findings
    • Historical Market Size Value (USD Million) Analysis By Capacity , 2020 to 2024
    • Current and Future Market Size Value (USD Million) Analysis and Forecast By Capacity , 2025 to 2035
      • 177 Ml - 414 Ml
      • 15 Ml - 60 Ml
      • 60 Ml - 177 Ml
      • 414 Ml - 950 Ml
    • Y-o-Y Growth Trend Analysis By Capacity , 2020 to 2024
    • Absolute $ Opportunity Analysis By Capacity , 2025 to 2035
  7. Global Market Analysis 2020 to 2024 and Forecast 2025 to 2035, By Cap Style
    • Introduction / Key Findings
    • Historical Market Size Value (USD Million) Analysis By Cap Style, 2020 to 2024
    • Current and Future Market Size Value (USD Million) Analysis and Forecast By Cap Style, 2025 to 2035
      • Dropper
      • Fine Mist Sprayer
      • Lotion Pump
      • Others
    • Y-o-Y Growth Trend Analysis By Cap Style, 2020 to 2024
    • Absolute $ Opportunity Analysis By Cap Style, 2025 to 2035
  8. Global Market Analysis 2020 to 2024 and Forecast 2025 to 2035, By Neck Finish
    • Introduction / Key Findings
    • Historical Market Size Value (USD Million) Analysis By Neck Finish, 2020 to 2024
    • Current and Future Market Size Value (USD Million) Analysis and Forecast By Neck Finish, 2025 to 2035
      • 18 - 410
      • 18 - 400
      • 20 - 400
      • 22 - 400
      • 24 - 400
      • 28 - 400
      • 33 - 400
    • Y-o-Y Growth Trend Analysis By Neck Finish, 2020 to 2024
    • Absolute $ Opportunity Analysis By Neck Finish, 2025 to 2035
  9. Global Market Analysis 2020 to 2024 and Forecast 2025 to 2035, By Neck Width
    • Introduction / Key Findings
    • Historical Market Size Value (USD Million) Analysis By Neck Width, 2020 to 2024
    • Current and Future Market Size Value (USD Million) Analysis and Forecast By Neck Width, 2025 to 2035
      • 18 Mm - 22 Mm
      • 24 Mm - 33 Mm
    • Y-o-Y Growth Trend Analysis By Neck Width, 2020 to 2024
    • Absolute $ Opportunity Analysis By Neck Width, 2025 to 2035
  10. Global Market Analysis 2020 to 2024 and Forecast 2025 to 2035, By End Use Industry
    • Introduction / Key Findings
    • Historical Market Size Value (USD Million) Analysis By End Use Industry, 2020 to 2024
    • Current and Future Market Size Value (USD Million) Analysis and Forecast By End Use Industry, 2025 to 2035
      • Personal Care
      • Pharmaceutical
      • Chemical Industrial
      • Food & Beverage
      • Others
    • Y-o-Y Growth Trend Analysis By End Use Industry, 2020 to 2024
    • Absolute $ Opportunity Analysis By End Use Industry, 2025 to 2035
  11. Global Market Analysis 2020 to 2024 and Forecast 2025 to 2035, By Region
    • Introduction
    • Historical Market Size Value (USD Million) Analysis By Region, 2020 to 2024
    • Current Market Size Value (USD Million) Analysis and Forecast By Region, 2025 to 2035
      • North America
      • Latin America
      • Western Europe
      • Eastern Europe
      • East Asia
      • South Asia and Pacific
      • Middle East & Africa
    • Market Attractiveness Analysis By Region
  12. North America Market Analysis 2020 to 2024 and Forecast 2025 to 2035, By Country
    • Historical Market Size Value (USD Million) Trend Analysis By Market Taxonomy, 2020 to 2024
    • Market Size Value (USD Million) Forecast By Market Taxonomy, 2025 to 2035
      • By Country
        • USA
        • Canada
        • Mexico
      • By Capacity
      • By Cap Style
      • By Neck Finish
      • By Neck Width
      • By End Use Industry
    • Market Attractiveness Analysis
      • By Country
      • By Capacity
      • By Cap Style
      • By Neck Finish
      • By Neck Width
      • By End Use Industry
    • Key Takeaways
  13. Latin America Market Analysis 2020 to 2024 and Forecast 2025 to 2035, By Country
    • Historical Market Size Value (USD Million) Trend Analysis By Market Taxonomy, 2020 to 2024
    • Market Size Value (USD Million) Forecast By Market Taxonomy, 2025 to 2035
      • By Country
        • Brazil
        • Chile
        • Rest of Latin America
      • By Capacity
      • By Cap Style
      • By Neck Finish
      • By Neck Width
      • By End Use Industry
    • Market Attractiveness Analysis
      • By Country
      • By Capacity
      • By Cap Style
      • By Neck Finish
      • By Neck Width
      • By End Use Industry
    • Key Takeaways
  14. Western Europe Market Analysis 2020 to 2024 and Forecast 2025 to 2035, By Country
    • Historical Market Size Value (USD Million) Trend Analysis By Market Taxonomy, 2020 to 2024
    • Market Size Value (USD Million) Forecast By Market Taxonomy, 2025 to 2035
      • By Country
        • Germany
        • UK
        • Italy
        • Spain
        • France
        • Nordic
        • BENELUX
        • Rest of Western Europe
      • By Capacity
      • By Cap Style
      • By Neck Finish
      • By Neck Width
      • By End Use Industry
    • Market Attractiveness Analysis
      • By Country
      • By Capacity
      • By Cap Style
      • By Neck Finish
      • By Neck Width
      • By End Use Industry
    • Key Takeaways
  15. Eastern Europe Market Analysis 2020 to 2024 and Forecast 2025 to 2035, By Country
    • Historical Market Size Value (USD Million) Trend Analysis By Market Taxonomy, 2020 to 2024
    • Market Size Value (USD Million) Forecast By Market Taxonomy, 2025 to 2035
      • By Country
        • Russia
        • Poland
        • Hungary
        • Balkan & Baltic
        • Rest of Eastern Europe
      • By Capacity
      • By Cap Style
      • By Neck Finish
      • By Neck Width
      • By End Use Industry
    • Market Attractiveness Analysis
      • By Country
      • By Capacity
      • By Cap Style
      • By Neck Finish
      • By Neck Width
      • By End Use Industry
    • Key Takeaways
  16. East Asia Market Analysis 2020 to 2024 and Forecast 2025 to 2035, By Country
    • Historical Market Size Value (USD Million) Trend Analysis By Market Taxonomy, 2020 to 2024
    • Market Size Value (USD Million) Forecast By Market Taxonomy, 2025 to 2035
      • By Country
        • China
        • Japan
        • South Korea
      • By Capacity
      • By Cap Style
      • By Neck Finish
      • By Neck Width
      • By End Use Industry
    • Market Attractiveness Analysis
      • By Country
      • By Capacity
      • By Cap Style
      • By Neck Finish
      • By Neck Width
      • By End Use Industry
    • Key Takeaways
  17. South Asia and Pacific Market Analysis 2020 to 2024 and Forecast 2025 to 2035, By Country
    • Historical Market Size Value (USD Million) Trend Analysis By Market Taxonomy, 2020 to 2024
    • Market Size Value (USD Million) Forecast By Market Taxonomy, 2025 to 2035
      • By Country
        • India
        • ASEAN
        • Australia & New Zealand
        • Rest of South Asia and Pacific
      • By Capacity
      • By Cap Style
      • By Neck Finish
      • By Neck Width
      • By End Use Industry
    • Market Attractiveness Analysis
      • By Country
      • By Capacity
      • By Cap Style
      • By Neck Finish
      • By Neck Width
      • By End Use Industry
    • Key Takeaways
  18. Middle East & Africa Market Analysis 2020 to 2024 and Forecast 2025 to 2035, By Country
    • Historical Market Size Value (USD Million) Trend Analysis By Market Taxonomy, 2020 to 2024
    • Market Size Value (USD Million) Forecast By Market Taxonomy, 2025 to 2035
      • By Country
        • Kingdom of Saudi Arabia
        • Other GCC Countries
        • Turkiye
        • South Africa
        • Other African Union
        • Rest of Middle East & Africa
      • By Capacity
      • By Cap Style
      • By Neck Finish
      • By Neck Width
      • By End Use Industry
    • Market Attractiveness Analysis
      • By Country
      • By Capacity
      • By Cap Style
      • By Neck Finish
      • By Neck Width
      • By End Use Industry
    • Key Takeaways
  19. Key Countries Market Analysis
    • USA
      • Pricing Analysis
      • Market Share Analysis, 2024
        • By Capacity
        • By Cap Style
        • By Neck Finish
        • By Neck Width
        • By End Use Industry
    • Canada
      • Pricing Analysis
      • Market Share Analysis, 2024
        • By Capacity
        • By Cap Style
        • By Neck Finish
        • By Neck Width
        • By End Use Industry
    • Mexico
      • Pricing Analysis
      • Market Share Analysis, 2024
        • By Capacity
        • By Cap Style
        • By Neck Finish
        • By Neck Width
        • By End Use Industry
    • Brazil
      • Pricing Analysis
      • Market Share Analysis, 2024
        • By Capacity
        • By Cap Style
        • By Neck Finish
        • By Neck Width
        • By End Use Industry
    • Chile
      • Pricing Analysis
      • Market Share Analysis, 2024
        • By Capacity
        • By Cap Style
        • By Neck Finish
        • By Neck Width
        • By End Use Industry
    • Germany
      • Pricing Analysis
      • Market Share Analysis, 2024
        • By Capacity
        • By Cap Style
        • By Neck Finish
        • By Neck Width
        • By End Use Industry
    • UK
      • Pricing Analysis
      • Market Share Analysis, 2024
        • By Capacity
        • By Cap Style
        • By Neck Finish
        • By Neck Width
        • By End Use Industry
    • Italy
      • Pricing Analysis
      • Market Share Analysis, 2024
        • By Capacity
        • By Cap Style
        • By Neck Finish
        • By Neck Width
        • By End Use Industry
    • Spain
      • Pricing Analysis
      • Market Share Analysis, 2024
        • By Capacity
        • By Cap Style
        • By Neck Finish
        • By Neck Width
        • By End Use Industry
    • France
      • Pricing Analysis
      • Market Share Analysis, 2024
        • By Capacity
        • By Cap Style
        • By Neck Finish
        • By Neck Width
        • By End Use Industry
    • India
      • Pricing Analysis
      • Market Share Analysis, 2024
        • By Capacity
        • By Cap Style
        • By Neck Finish
        • By Neck Width
        • By End Use Industry
    • ASEAN
      • Pricing Analysis
      • Market Share Analysis, 2024
        • By Capacity
        • By Cap Style
        • By Neck Finish
        • By Neck Width
        • By End Use Industry
    • Australia & New Zealand
      • Pricing Analysis
      • Market Share Analysis, 2024
        • By Capacity
        • By Cap Style
        • By Neck Finish
        • By Neck Width
        • By End Use Industry
    • China
      • Pricing Analysis
      • Market Share Analysis, 2024
        • By Capacity
        • By Cap Style
        • By Neck Finish
        • By Neck Width
        • By End Use Industry
    • Japan
      • Pricing Analysis
      • Market Share Analysis, 2024
        • By Capacity
        • By Cap Style
        • By Neck Finish
        • By Neck Width
        • By End Use Industry
    • South Korea
      • Pricing Analysis
      • Market Share Analysis, 2024
        • By Capacity
        • By Cap Style
        • By Neck Finish
        • By Neck Width
        • By End Use Industry
    • Russia
      • Pricing Analysis
      • Market Share Analysis, 2024
        • By Capacity
        • By Cap Style
        • By Neck Finish
        • By Neck Width
        • By End Use Industry
    • Poland
      • Pricing Analysis
      • Market Share Analysis, 2024
        • By Capacity
        • By Cap Style
        • By Neck Finish
        • By Neck Width
        • By End Use Industry
    • Hungary
      • Pricing Analysis
      • Market Share Analysis, 2024
        • By Capacity
        • By Cap Style
        • By Neck Finish
        • By Neck Width
        • By End Use Industry
    • Kingdom of Saudi Arabia
      • Pricing Analysis
      • Market Share Analysis, 2024
        • By Capacity
        • By Cap Style
        • By Neck Finish
        • By Neck Width
        • By End Use Industry
    • Turkiye
      • Pricing Analysis
      • Market Share Analysis, 2024
        • By Capacity
        • By Cap Style
        • By Neck Finish
        • By Neck Width
        • By End Use Industry
    • South Africa
      • Pricing Analysis
      • Market Share Analysis, 2024
        • By Capacity
        • By Cap Style
        • By Neck Finish
        • By Neck Width
        • By End Use Industry
  20. Market Structure Analysis
    • Competition Dashboard
    • Competition Benchmarking
    • Market Share Analysis of Top Players
      • By Regional
      • By Capacity
      • By Cap Style
      • By Neck Finish
      • By Neck Width
      • By End Use Industry
  21. Competition Analysis
    • Competition Deep Dive
      • Glaspac Manufacturing
        • Overview
        • Product Portfolio
        • Profitability by Market Segments (Product/Age /Sales Channel/Region)
        • Sales Footprint
        • Strategy Overview
          • Marketing Strategy
          • Product Strategy
          • Channel Strategy
      • Keraglass
      • Anchor Glass Container
      • Ardagh Group
      • DPG Glass
      • Corning Incorporated
      • Owens-Illinois
      • Beatson Clark
      • AGI Glaspac
      • Gerresheimer
      • Delphis Glass, Inc.
      • Clinigen Group
      • SCHOTT
      • Wheaton Industries
      • SGD Pharma
  22. Assumptions & Acronyms Used
  23. Research Methodology

List of Tables

  • Table 1: Global Market Value (USD Million) Forecast by Region, 2020-2035
  • Table 2: Global Market Value (USD Million) Forecast by Capacity , 2020-2035
  • Table 3: Global Market Value (USD Million) Forecast by Cap Style, 2020-2035
  • Table 4: Global Market Value (USD Million) Forecast by Neck Finish, 2020-2035
  • Table 5: Global Market Value (USD Million) Forecast by Neck Width, 2020-2035
  • Table 6: Global Market Value (USD Million) Forecast by End Use Industry, 2020-2035
  • Table 7: North America Market Value (USD Million) Forecast by Country, 2020-2035
  • Table 8: North America Market Value (USD Million) Forecast by Capacity , 2020-2035
  • Table 9: North America Market Value (USD Million) Forecast by Cap Style, 2020-2035
  • Table 10: North America Market Value (USD Million) Forecast by Neck Finish, 2020-2035
  • Table 11: North America Market Value (USD Million) Forecast by Neck Width, 2020-2035
  • Table 12: North America Market Value (USD Million) Forecast by End Use Industry, 2020-2035
  • Table 13: Latin America Market Value (USD Million) Forecast by Country, 2020-2035
  • Table 14: Latin America Market Value (USD Million) Forecast by Capacity , 2020-2035
  • Table 15: Latin America Market Value (USD Million) Forecast by Cap Style, 2020-2035
  • Table 16: Latin America Market Value (USD Million) Forecast by Neck Finish, 2020-2035
  • Table 17: Latin America Market Value (USD Million) Forecast by Neck Width, 2020-2035
  • Table 18: Latin America Market Value (USD Million) Forecast by End Use Industry, 2020-2035
  • Table 19: Western Europe Market Value (USD Million) Forecast by Country, 2020-2035
  • Table 20: Western Europe Market Value (USD Million) Forecast by Capacity , 2020-2035
  • Table 21: Western Europe Market Value (USD Million) Forecast by Cap Style, 2020-2035
  • Table 22: Western Europe Market Value (USD Million) Forecast by Neck Finish, 2020-2035
  • Table 23: Western Europe Market Value (USD Million) Forecast by Neck Width, 2020-2035
  • Table 24: Western Europe Market Value (USD Million) Forecast by End Use Industry, 2020-2035
  • Table 25: Eastern Europe Market Value (USD Million) Forecast by Country, 2020-2035
  • Table 26: Eastern Europe Market Value (USD Million) Forecast by Capacity , 2020-2035
  • Table 27: Eastern Europe Market Value (USD Million) Forecast by Cap Style, 2020-2035
  • Table 28: Eastern Europe Market Value (USD Million) Forecast by Neck Finish, 2020-2035
  • Table 29: Eastern Europe Market Value (USD Million) Forecast by Neck Width, 2020-2035
  • Table 30: Eastern Europe Market Value (USD Million) Forecast by End Use Industry, 2020-2035
  • Table 31: East Asia Market Value (USD Million) Forecast by Country, 2020-2035
  • Table 32: East Asia Market Value (USD Million) Forecast by Capacity , 2020-2035
  • Table 33: East Asia Market Value (USD Million) Forecast by Cap Style, 2020-2035
  • Table 34: East Asia Market Value (USD Million) Forecast by Neck Finish, 2020-2035
  • Table 35: East Asia Market Value (USD Million) Forecast by Neck Width, 2020-2035
  • Table 36: East Asia Market Value (USD Million) Forecast by End Use Industry, 2020-2035
  • Table 37: South Asia and Pacific Market Value (USD Million) Forecast by Country, 2020-2035
  • Table 38: South Asia and Pacific Market Value (USD Million) Forecast by Capacity , 2020-2035
  • Table 39: South Asia and Pacific Market Value (USD Million) Forecast by Cap Style, 2020-2035
  • Table 40: South Asia and Pacific Market Value (USD Million) Forecast by Neck Finish, 2020-2035
  • Table 41: South Asia and Pacific Market Value (USD Million) Forecast by Neck Width, 2020-2035
  • Table 42: South Asia and Pacific Market Value (USD Million) Forecast by End Use Industry, 2020-2035
  • Table 43: Middle East & Africa Market Value (USD Million) Forecast by Country, 2020-2035
  • Table 44: Middle East & Africa Market Value (USD Million) Forecast by Capacity , 2020-2035
  • Table 45: Middle East & Africa Market Value (USD Million) Forecast by Cap Style, 2020-2035
  • Table 46: Middle East & Africa Market Value (USD Million) Forecast by Neck Finish, 2020-2035
  • Table 47: Middle East & Africa Market Value (USD Million) Forecast by Neck Width, 2020-2035
  • Table 48: Middle East & Africa Market Value (USD Million) Forecast by End Use Industry, 2020-2035

List of Figures

  • Figure 1: Global Market Pricing Analysis
  • Figure 2: Global Market Value (USD Million) Forecast 2020-2035
  • Figure 3: Global Market Value Share and BPS Analysis by Capacity , 2025 and 2035
  • Figure 4: Global Market Y-o-Y Growth Comparison by Capacity , 2025-2035
  • Figure 5: Global Market Attractiveness Analysis by Capacity
  • Figure 6: Global Market Value Share and BPS Analysis by Cap Style, 2025 and 2035
  • Figure 7: Global Market Y-o-Y Growth Comparison by Cap Style, 2025-2035
  • Figure 8: Global Market Attractiveness Analysis by Cap Style
  • Figure 9: Global Market Value Share and BPS Analysis by Neck Finish, 2025 and 2035
  • Figure 10: Global Market Y-o-Y Growth Comparison by Neck Finish, 2025-2035
  • Figure 11: Global Market Attractiveness Analysis by Neck Finish
  • Figure 12: Global Market Value Share and BPS Analysis by Neck Width, 2025 and 2035
  • Figure 13: Global Market Y-o-Y Growth Comparison by Neck Width, 2025-2035
  • Figure 14: Global Market Attractiveness Analysis by Neck Width
  • Figure 15: Global Market Value Share and BPS Analysis by End Use Industry, 2025 and 2035
  • Figure 16: Global Market Y-o-Y Growth Comparison by End Use Industry, 2025-2035
  • Figure 17: Global Market Attractiveness Analysis by End Use Industry
  • Figure 18: Global Market Value (USD Million) Share and BPS Analysis by Region, 2025 and 2035
  • Figure 19: Global Market Y-o-Y Growth Comparison by Region, 2025-2035
  • Figure 20: Global Market Attractiveness Analysis by Region
  • Figure 21: North America Market Incremental Dollar Opportunity, 2025-2035
  • Figure 22: Latin America Market Incremental Dollar Opportunity, 2025-2035
  • Figure 23: Western Europe Market Incremental Dollar Opportunity, 2025-2035
  • Figure 24: Eastern Europe Market Incremental Dollar Opportunity, 2025-2035
  • Figure 25: East Asia Market Incremental Dollar Opportunity, 2025-2035
  • Figure 26: South Asia and Pacific Market Incremental Dollar Opportunity, 2025-2035
  • Figure 27: Middle East & Africa Market Incremental Dollar Opportunity, 2025-2035
  • Figure 28: North America Market Value Share and BPS Analysis by Country, 2025 and 2035
  • Figure 29: North America Market Value Share and BPS Analysis by Capacity , 2025 and 2035
  • Figure 30: North America Market Y-o-Y Growth Comparison by Capacity , 2025-2035
  • Figure 31: North America Market Attractiveness Analysis by Capacity
  • Figure 32: North America Market Value Share and BPS Analysis by Cap Style, 2025 and 2035
  • Figure 33: North America Market Y-o-Y Growth Comparison by Cap Style, 2025-2035
  • Figure 34: North America Market Attractiveness Analysis by Cap Style
  • Figure 35: North America Market Value Share and BPS Analysis by Neck Finish, 2025 and 2035
  • Figure 36: North America Market Y-o-Y Growth Comparison by Neck Finish, 2025-2035
  • Figure 37: North America Market Attractiveness Analysis by Neck Finish
  • Figure 38: North America Market Value Share and BPS Analysis by Neck Width, 2025 and 2035
  • Figure 39: North America Market Y-o-Y Growth Comparison by Neck Width, 2025-2035
  • Figure 40: North America Market Attractiveness Analysis by Neck Width
  • Figure 41: North America Market Value Share and BPS Analysis by End Use Industry, 2025 and 2035
  • Figure 42: North America Market Y-o-Y Growth Comparison by End Use Industry, 2025-2035
  • Figure 43: North America Market Attractiveness Analysis by End Use Industry
  • Figure 44: Latin America Market Value Share and BPS Analysis by Country, 2025 and 2035
  • Figure 45: Latin America Market Value Share and BPS Analysis by Capacity , 2025 and 2035
  • Figure 46: Latin America Market Y-o-Y Growth Comparison by Capacity , 2025-2035
  • Figure 47: Latin America Market Attractiveness Analysis by Capacity
  • Figure 48: Latin America Market Value Share and BPS Analysis by Cap Style, 2025 and 2035
  • Figure 49: Latin America Market Y-o-Y Growth Comparison by Cap Style, 2025-2035
  • Figure 50: Latin America Market Attractiveness Analysis by Cap Style
  • Figure 51: Latin America Market Value Share and BPS Analysis by Neck Finish, 2025 and 2035
  • Figure 52: Latin America Market Y-o-Y Growth Comparison by Neck Finish, 2025-2035
  • Figure 53: Latin America Market Attractiveness Analysis by Neck Finish
  • Figure 54: Latin America Market Value Share and BPS Analysis by Neck Width, 2025 and 2035
  • Figure 55: Latin America Market Y-o-Y Growth Comparison by Neck Width, 2025-2035
  • Figure 56: Latin America Market Attractiveness Analysis by Neck Width
  • Figure 57: Latin America Market Value Share and BPS Analysis by End Use Industry, 2025 and 2035
  • Figure 58: Latin America Market Y-o-Y Growth Comparison by End Use Industry, 2025-2035
  • Figure 59: Latin America Market Attractiveness Analysis by End Use Industry
  • Figure 60: Western Europe Market Value Share and BPS Analysis by Country, 2025 and 2035
  • Figure 61: Western Europe Market Value Share and BPS Analysis by Capacity , 2025 and 2035
  • Figure 62: Western Europe Market Y-o-Y Growth Comparison by Capacity , 2025-2035
  • Figure 63: Western Europe Market Attractiveness Analysis by Capacity
  • Figure 64: Western Europe Market Value Share and BPS Analysis by Cap Style, 2025 and 2035
  • Figure 65: Western Europe Market Y-o-Y Growth Comparison by Cap Style, 2025-2035
  • Figure 66: Western Europe Market Attractiveness Analysis by Cap Style
  • Figure 67: Western Europe Market Value Share and BPS Analysis by Neck Finish, 2025 and 2035
  • Figure 68: Western Europe Market Y-o-Y Growth Comparison by Neck Finish, 2025-2035
  • Figure 69: Western Europe Market Attractiveness Analysis by Neck Finish
  • Figure 70: Western Europe Market Value Share and BPS Analysis by Neck Width, 2025 and 2035
  • Figure 71: Western Europe Market Y-o-Y Growth Comparison by Neck Width, 2025-2035
  • Figure 72: Western Europe Market Attractiveness Analysis by Neck Width
  • Figure 73: Western Europe Market Value Share and BPS Analysis by End Use Industry, 2025 and 2035
  • Figure 74: Western Europe Market Y-o-Y Growth Comparison by End Use Industry, 2025-2035
  • Figure 75: Western Europe Market Attractiveness Analysis by End Use Industry
  • Figure 76: Eastern Europe Market Value Share and BPS Analysis by Country, 2025 and 2035
  • Figure 77: Eastern Europe Market Value Share and BPS Analysis by Capacity , 2025 and 2035
  • Figure 78: Eastern Europe Market Y-o-Y Growth Comparison by Capacity , 2025-2035
  • Figure 79: Eastern Europe Market Attractiveness Analysis by Capacity
  • Figure 80: Eastern Europe Market Value Share and BPS Analysis by Cap Style, 2025 and 2035
  • Figure 81: Eastern Europe Market Y-o-Y Growth Comparison by Cap Style, 2025-2035
  • Figure 82: Eastern Europe Market Attractiveness Analysis by Cap Style
  • Figure 83: Eastern Europe Market Value Share and BPS Analysis by Neck Finish, 2025 and 2035
  • Figure 84: Eastern Europe Market Y-o-Y Growth Comparison by Neck Finish, 2025-2035
  • Figure 85: Eastern Europe Market Attractiveness Analysis by Neck Finish
  • Figure 86: Eastern Europe Market Value Share and BPS Analysis by Neck Width, 2025 and 2035
  • Figure 87: Eastern Europe Market Y-o-Y Growth Comparison by Neck Width, 2025-2035
  • Figure 88: Eastern Europe Market Attractiveness Analysis by Neck Width
  • Figure 89: Eastern Europe Market Value Share and BPS Analysis by End Use Industry, 2025 and 2035
  • Figure 90: Eastern Europe Market Y-o-Y Growth Comparison by End Use Industry, 2025-2035
  • Figure 91: Eastern Europe Market Attractiveness Analysis by End Use Industry
  • Figure 92: East Asia Market Value Share and BPS Analysis by Country, 2025 and 2035
  • Figure 93: East Asia Market Value Share and BPS Analysis by Capacity , 2025 and 2035
  • Figure 94: East Asia Market Y-o-Y Growth Comparison by Capacity , 2025-2035
  • Figure 95: East Asia Market Attractiveness Analysis by Capacity
  • Figure 96: East Asia Market Value Share and BPS Analysis by Cap Style, 2025 and 2035
  • Figure 97: East Asia Market Y-o-Y Growth Comparison by Cap Style, 2025-2035
  • Figure 98: East Asia Market Attractiveness Analysis by Cap Style
  • Figure 99: East Asia Market Value Share and BPS Analysis by Neck Finish, 2025 and 2035
  • Figure 100: East Asia Market Y-o-Y Growth Comparison by Neck Finish, 2025-2035
  • Figure 101: East Asia Market Attractiveness Analysis by Neck Finish
  • Figure 102: East Asia Market Value Share and BPS Analysis by Neck Width, 2025 and 2035
  • Figure 103: East Asia Market Y-o-Y Growth Comparison by Neck Width, 2025-2035
  • Figure 104: East Asia Market Attractiveness Analysis by Neck Width
  • Figure 105: East Asia Market Value Share and BPS Analysis by End Use Industry, 2025 and 2035
  • Figure 106: East Asia Market Y-o-Y Growth Comparison by End Use Industry, 2025-2035
  • Figure 107: East Asia Market Attractiveness Analysis by End Use Industry
  • Figure 108: South Asia and Pacific Market Value Share and BPS Analysis by Country, 2025 and 2035
  • Figure 109: South Asia and Pacific Market Value Share and BPS Analysis by Capacity , 2025 and 2035
  • Figure 110: South Asia and Pacific Market Y-o-Y Growth Comparison by Capacity , 2025-2035
  • Figure 111: South Asia and Pacific Market Attractiveness Analysis by Capacity
  • Figure 112: South Asia and Pacific Market Value Share and BPS Analysis by Cap Style, 2025 and 2035
  • Figure 113: South Asia and Pacific Market Y-o-Y Growth Comparison by Cap Style, 2025-2035
  • Figure 114: South Asia and Pacific Market Attractiveness Analysis by Cap Style
  • Figure 115: South Asia and Pacific Market Value Share and BPS Analysis by Neck Finish, 2025 and 2035
  • Figure 116: South Asia and Pacific Market Y-o-Y Growth Comparison by Neck Finish, 2025-2035
  • Figure 117: South Asia and Pacific Market Attractiveness Analysis by Neck Finish
  • Figure 118: South Asia and Pacific Market Value Share and BPS Analysis by Neck Width, 2025 and 2035
  • Figure 119: South Asia and Pacific Market Y-o-Y Growth Comparison by Neck Width, 2025-2035
  • Figure 120: South Asia and Pacific Market Attractiveness Analysis by Neck Width
  • Figure 121: South Asia and Pacific Market Value Share and BPS Analysis by End Use Industry, 2025 and 2035
  • Figure 122: South Asia and Pacific Market Y-o-Y Growth Comparison by End Use Industry, 2025-2035
  • Figure 123: South Asia and Pacific Market Attractiveness Analysis by End Use Industry
  • Figure 124: Middle East & Africa Market Value Share and BPS Analysis by Country, 2025 and 2035
  • Figure 125: Middle East & Africa Market Value Share and BPS Analysis by Capacity , 2025 and 2035
  • Figure 126: Middle East & Africa Market Y-o-Y Growth Comparison by Capacity , 2025-2035
  • Figure 127: Middle East & Africa Market Attractiveness Analysis by Capacity
  • Figure 128: Middle East & Africa Market Value Share and BPS Analysis by Cap Style, 2025 and 2035
  • Figure 129: Middle East & Africa Market Y-o-Y Growth Comparison by Cap Style, 2025-2035
  • Figure 130: Middle East & Africa Market Attractiveness Analysis by Cap Style
  • Figure 131: Middle East & Africa Market Value Share and BPS Analysis by Neck Finish, 2025 and 2035
  • Figure 132: Middle East & Africa Market Y-o-Y Growth Comparison by Neck Finish, 2025-2035
  • Figure 133: Middle East & Africa Market Attractiveness Analysis by Neck Finish
  • Figure 134: Middle East & Africa Market Value Share and BPS Analysis by Neck Width, 2025 and 2035
  • Figure 135: Middle East & Africa Market Y-o-Y Growth Comparison by Neck Width, 2025-2035
  • Figure 136: Middle East & Africa Market Attractiveness Analysis by Neck Width
  • Figure 137: Middle East & Africa Market Value Share and BPS Analysis by End Use Industry, 2025 and 2035
  • Figure 138: Middle East & Africa Market Y-o-Y Growth Comparison by End Use Industry, 2025-2035
  • Figure 139: Middle East & Africa Market Attractiveness Analysis by End Use Industry
  • Figure 140: Global Market - Tier Structure Analysis
  • Figure 141: Global Market - Company Share Analysis
Dashboard
Dashboard
Dashboard
Dashboard
Dashboard
Dashboard

Full Research Suite comprises of:

Market outlook & trends analysis

Market outlook & trends analysis

Interviews & case studies

Interviews & case studies

Strategic recommendations

Strategic recommendations

Vendor profiles & capabilities analysis

Vendor profiles & capabilities analysis

5-year forecasts

5-year forecasts

8 regions and 60+ country-level data splits

8 regions and 60+ country-level data splits

Market segment data splits

Market segment data splits

12 months of continuous data updates

12 months of continuous data updates

DELIVERED AS:

PDF EXCEL ONLINE

Full Research Suite


$5000

$7500

$10000

Buy Report Now
Similar Industry Reports

Similar Industry Reports

Boston Round Bottle Market

Boston Round Bottle Market

Round Iron Rod Market

Round Iron Rod Market Size and Share Forecast Outlook 2025 to 2035

Round Bottle Cooling Tower Market

Round Bottle Cooling Tower Market Size and Share Forecast Outlook 2025 to 2035

Ground Grid Tester Market

Ground Grid Tester Market Size and Share Forecast Outlook 2025 to 2035

Ground And Precipitated Calcium Carbonate Market

Ground and Precipitated Calcium Carbonate Market Size and Share Forecast Outlook 2025 to 2035

Ground Mounted Solar PV Module Market

Ground Mounted Solar PV Module Market Size and Share Forecast Outlook 2025 to 2035

Ground Mounted Solar EPC Market

Ground Mounted Solar EPC Market Size and Share Forecast Outlook 2025 to 2035

Ground Resistance Testers Market

Ground Resistance Testers Market Growth - Trends & Forecast 2025 to 2035

Ground Fault Circuit Interrupter Market

Ground Fault Circuit Interrupter Market

Wraparound Case Packers Market

Wraparound Case Packers Market Size and Share Forecast Outlook 2025 to 2035

USA Ground and Precipitated Calcium Carbonate Market

USA Ground and Precipitated Calcium Carbonate Market Growth by Product Type, Application, End-Use, and Region in 2025 to 2035

Wrap Around Cartoners Market

Wrap Around Cartoners Market Size and Share Forecast Outlook 2025 to 2035

Underground Mining Equipment Market

Underground Mining Equipment Market Size and Share Forecast Outlook 2025 to 2035

Underground Hydrogen Storage Market

Underground Hydrogen Storage Market Size and Share Forecast Outlook 2025 to 2035

Aboveground Storage Tanks Market

Aboveground Storage Tanks Market Size and Share Forecast Outlook 2025 to 2035

Underground Coal Gasification Industry Analysis in Asia Pacific

Underground Coal Gasification Industry Analysis in Asia Pacific Size and Share Forecast Outlook 2025 to 2035

Underground Cabling EPC Market

Underground Cabling EPC Market Size and Share Forecast Outlook 2025 to 2035

Underground Mining Automation Market

Underground Mining Automation Market Size and Share Forecast Outlook 2025 to 2035

Wrap Around Label Films Market

Wrap Around Label Films Market Size and Share Forecast Outlook 2025 to 2035

Wrap-Around Label Market Share Analysis

Market Positioning & Share in the Wrap-Around Label Industry

Future Market Insights

Boston Round Glass Bottle Market

Chat With MaRIA

Chat With

MaRIA

Hi There, I am MaRIA, Your Market Research Intelligence Assistant. How may I help you?