Brewer’s Yeast Market Forecast and Outlook 2025 to 2035

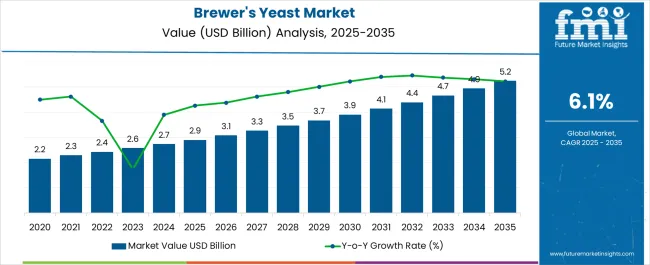
The brewer’s yeast market is estimated to be valued at USD 2.9 billion in 2025 and is projected to reach USD 5.3 billion by 2035, registering a compound annual growth rate (CAGR) of 6.1% over the forecast period.
Quick Stats for Brewer’s Yeast Market

  • Brewer’s Yeast Market Value (2025): USD 2.9 billion
  • Brewer’s Yeast Market Forecast Value (2035): USD 5.3 billion
  • Brewer’s Yeast Market Forecast CAGR: 6.1%
  • Leading Segment in Brewer’s Yeast Market in 2025: Dry Brewer’s Yeast (71% market share)
  • Key Growth Regions in Brewer’s Yeast Market: Asia Pacific, North America, Europe
  • Top Key Players in Brewer’s Yeast Market: Lesaffre Group, Archer Daniels Midland Company, Nutreco N.V., Alltech Inc., Cargill Incorporated, Leiber GmbH, Associated British Food Plc., AB Mauri India Pvt. Ltd., Kothari Fermentation and Biochem Ltd., Angel Yeast Company, Oriental Yeast Co., Ltd, Hansen Holding A/S, Koninklijke DSM N.V., Bruchem Inc, Scandinavian Formulas, Omega Yeast Labs, Lallemand Inc., Synergy Flavors

Brewers Yeast Market

Metric Value
Estimated Size (2025E) USD 2.9 billion
Projected Value (2035F) USD 5.3 billion
CAGR (2025 to 2035) 6.1%

The market is expected to add an absolute dollar opportunity of USD 2.4 billion between 2025 and 2035. This reflects a 1.83x growth trajectory at a CAGR of 6.1%. Demand growth is expected to be fueled by rising interest in sustainable protein sources, high vitamin B content, and multifunctional applications across animal feed and functional food supplements.

By 2030, the market is projected to reach USD 4.0 billion, accounting for USD 1.06 billion in value growth over the first half of the decade. The remaining USD 0.87 billion is expected to be generated between 2030 and 2035, indicating a relatively front-loaded expansion pattern across key demand clusters.

Leading companies are advancing their positions through the development of enhanced dry yeast formulations and nutrient-enriched strains. Process scale-ups and functional ingredient partnerships have been prioritized by players such as Lesaffre Group, Lallemand Inc., and Associated British Foods plc. Growth strategies are being centered around clean-label certification, microbiome-focused nutrition, and bioavailability optimization.

The brewer’s yeast market holds a significant yet specialized share across several broader parent markets. In the Food Ingredients Market, it accounts for approximately 4-6%, driven by its role as a natural flavor enhancer and nutritional supplement. Within the Nutraceuticals Market, brewer’s yeast contributes around 3-5%, owing to its rich vitamin B content and functional health benefits. In the Animal Feed Market, it represents about 5-7%, valued for improving animal digestion and immunity. The Pharmaceutical Ingredients Market sees a smaller share, near 2-4%, as brewer’s yeast is used mainly in dietary supplements. Its presence in the Brewing Industry is integral but niche, estimated at 3-5%.

Strong demand is being observed in both developed and emerging economies for organic and fortified ingredients. Brewer’s yeast is being increasingly used in protein-rich snacks, vegan foods, and gut health formulations. Advances in bioprocessing and fermentation are enabling product innovations tailored for pet food, aquaculture, and sports nutrition. Recent trends include sustainable upcycling from brewery waste streams and increased R&D in postbiotic yeast strains for immunity-boosting benefits.

Why is the Brewer’s Yeast Market Growing?

Brewer’s yeast’s proven nutritional benefits, high protein content, and rich source of B-complex vitamins make it a compelling ingredient in functional foods, dietary supplements, and livestock feed. Its natural origin and bioavailability support the growing shift toward clean-label and plant-based alternatives in health-conscious consumption.

Widening consumer awareness of digestive health and immune support is further driving brewer’s yeast adoption, especially among vegans, vegetarians, and athletes seeking natural energy and wellness solutions. Innovations in fermentation, along with sustainable sourcing from brewery by-products, are enhancing production efficiency and environmental appeal.

As global nutrition trends prioritize immunity, sustainability, and gut health, the market outlook remains strong. With manufacturers and consumers favoring high-protein, non-GMO, and eco-friendly formulations, brewer’s yeast is well-positioned for broader use across supplements, animal nutrition, and fortified food applications.

Segmental Analysis

The market is segmented by product type, end use, and region. By product type, the market is classified into dry brewer’s yeast and liquid brewer’s yeast. Based on end use, the market is divided into food and beverage industry, pharmaceutical industry and brewing industry. Regionally, the market is classified into North America, Latin America, Europe, East Asia, South Asia, Oceania, and the Middle East & Africa.

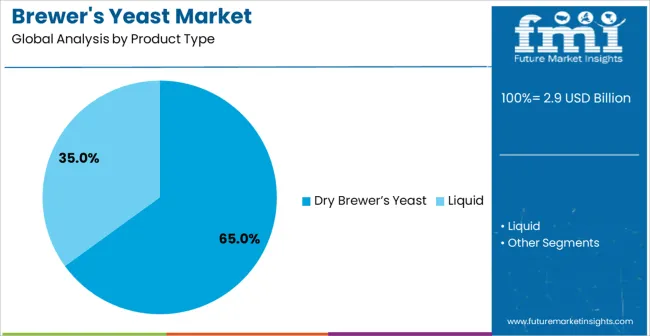
By Product Type, Dry Brewer’s Yeast Accounts for 71% of the Market Share

Brewers Yeast Market By Product

The dry brewer’s yeast segment leads with a commanding 71% share of the product type category, underscoring its functional versatility, longer shelf life, and broad applicability across both food and feed sectors. Dry yeast is widely preferred in formulations where preservation, storage ease, and consistent nutrient delivery are required, especially in dietary supplements and animal nutrition.

Its dominance is further supported by production efficiency and global transport advantages. Manufacturers are focused on enhancing the nutritional profile of dry yeast through fermentation control and post-processing innovations that preserve B-vitamins, selenium, and other micronutrients. Dry yeast formats are also favored in health foods and fortified snacks due to their ease of blending and powder uniformity.

As demand for natural, protein-rich ingredients continues to grow, dry brewer’s yeast has been increasingly adopted in functional foods, savory flavor enhancers, and vegan cheese alternatives. Technological advancements in drying techniques and purity optimization are expected to sustain this segment’s leadership and extend its reach into emerging applications such as personalized nutrition and sports supplements.

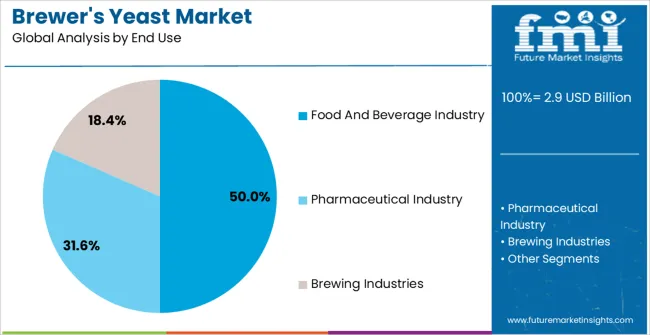
By End Use, Food and Beverage Industry Segment Accounts for 50% of the Market Share

Brewers Yeast Market By End Use

The food and beverage industry constitutes the largest end-use segment, accounting for 50% of total brewer’s yeast market share, owing to its increasing incorporation into functional food items, fortified beverages, and nutritional supplements. The segment benefits from a broader consumer shift toward clean-label and plant-based diets, which has elevated demand for yeast-based protein sources, flavor enhancers, and vitamin-rich additives. Brewer’s yeast is being used extensively in soups, sauces, meat substitutes, and nutritional powders, offering natural umami taste, high digestibility, and a rich nutrient profile. Formulators in the F&B industry are capitalizing on the ingredient’s non-GMO, vegan-friendly nature and exploring novel pairings with dairy-free and gluten-free products.

Increased innovation in flavor masking, microencapsulation, and heat-stable formulations is enabling brewer’s yeast to enter new product categories. As global manufacturers target immunity-boosting and gut-health-enhancing ingredients, the food and beverage industry is set to remain a major growth anchor for brewer’s yeast adoption.

What are the Drivers, Restraints, and Key Trends of the Brewer’s Yeast Market?

From 2025 to 2035, ingredient manufacturers aligned their strategies with demand for functional, high-protein, and clean-label inputs to support health-focused product development. This shift positioned brewer’s yeast suppliers, especially those offering natural, fortified, and sustainably sourced variants, as essential partners to food, supplement, and animal nutrition industries aiming to boost product efficacy and consumer appeal.

Rising Demand for Nutrient-Dense Ingredients Fuels Brewer’s Yeast Market Growth

Growing consumer preference for nutrient-rich, plant-based alternatives has emerged as the core driver of the brewer’s yeast market expansion. In 2024, increased awareness of brewer’s yeast’s benefits, such as natural B-vitamin content, probiotic potential, and high protein levels, drove incorporation into functional food and animal feed formulations. By 2025, manufacturers were expected to diversify product portfolios with enriched, spray-dried, and organic yeast variants tailored for wellness, sports nutrition, and livestockproductivity. These developments indicate that sustained adoption of scientifically supported nutrition solutions, not short-lived dietary trends, is underpinning long-term market momentum. Suppliers offering bioavailable, clean-label brewer’s yeast are well-positioned to benefit from rising demand across dietary supplements, alternative proteins, and fortified feed categories.

Sustainability and By-Product Utilization Strengthen Market Opportunity

In 2024, the industry began scaling circular economy models by sourcing yeast from brewery waste streams, enabling cost-effective production and eco-aligned branding. By 2025, brewer’s yeast processors will embed sustainable procurement and zero-waste principles directly into product design, ensuring compliance with environmental regulations and supporting brand reputation. These implementations confirm that when product innovation is coupled with sustainability, brand value and market reach expand. Suppliers delivering traceable, environmentally responsible brewer’s yeast, with certified nutritional properties, are positioned to gain long-term traction in food, agriculture, and nutraceutical sectors.

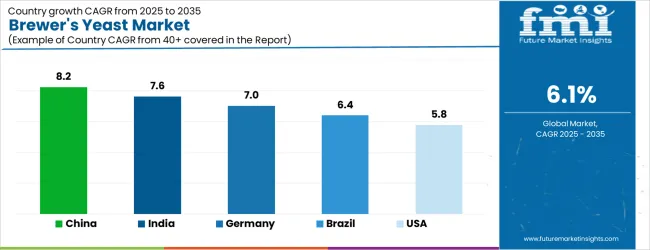
Brewer’s Yeast Market Analysis by Top Countries

Brewers Yeast Market By Country

Countries CAGR (2025 to 2035)
United Kingdom 6.3%
United States 6.1%
Germany 5.7%
France 5.2%
Japan 4.8%

Among the top five markets, the UK leads with a CAGR of 6.3%, followed closely by the USA at 6.1%, reflecting strong consumer demand for functional nutrition and fortified food ingredients. Germany, France, and Japan also show promising growth, driven by rising adoption of clean-label dietary solutions and sustainable sourcing practices. While the USA and UK dominate due to their proactive food innovation ecosystems, Germany and France benefit from organic food regulations and culinary integration. Japan’s steady rise is attributed to umami-enhanced functional products and growing consumer awareness of nutritional yeast benefits.

The report covers an in-depth analysis of 40+ countries; five top-performing OECD countries are highlighted below.

Future Outlook of Brewer’s Yeast Market in the United Kingdom

Revenue from brewer’s yeast in the UK is expected to register a CAGR of 6.3% through 2035, supported by widespread consumer acceptance of nutritional yeast as a key component of vegan and vegetarian diets. Public health campaigns and nutritional education have increased awareness about the vitamin B complex benefits of brewer’s yeast, driving its integration into dietary routines. The market also benefits from innovative partnerships between breweries and health product companies that upcycle brewing by-products into value-added supplements and baking ingredients.

Online retail channels and organic specialty stores are broadening the availability of premium yeast powders, making these products more accessible to health-conscious consumers. The growing preference for sustainable and natural nutrition sources continues to encourage market growth in the UK.

  • Breweries and wellness brands collaborate on upcycled yeast-based ingredients.
  • Vegan and vegetarian consumers adopt brewer’s yeast for natural B-vitamin supplementation.
  • Online retail and organic stores drive consumer access to premium yeast powders.

Growth Analysis of Brewer’s Yeast Market in the United States

The brewer’s yeast market in the USA is projected to grow at a CAGR of 6.1% through 2035, driven by rising consumer interest in dietary supplements, functional foods, and pet nutrition products. Increasing awareness about immune health, digestive wellness, and the benefits of plant-based protein alternatives is bolstering demand for clean-label, fortified brewer’s yeast variants. Innovations such as microencapsulation and probiotic yeast blends are expanding product offerings in wellness and health segments.

Additionally, expanding distribution channels including specialty health stores and e-commerce platforms are facilitating consumer access. As manufacturers invest in product diversification, brewer’s yeast is being incorporated into functional snacks, beverages, and animal feed formulations. This diversified usage is expected to support steady market expansion through the forecast period.

  • Fortified brewer’s yeast products are favored for digestive and immune health support.
  • Product diversification includes functional snacks, beverages, and pet food applications.
  • Retailers and wellness brands prioritize clean-label, allergen-free yeast formulations.

Demand Forecast for Brewer’s Yeast in Germany

The sales of brewer’s yeast in Germany are projected to flourish at a CAGR of 5.7% from 2025 to 2035, driven by strong consumer preference for organic, non-GMO, and sustainably produced food ingredients. Germany’s well-established organic food infrastructure and eco-conscious consumer base contribute to the premium placement of fortified yeast variants in health food stores and supermarkets.

Brewer’s yeast is increasingly incorporated into vegan and plant-based baked goods, dietary supplements, and natural health products. Regulatory support for organic certification and sustainable sourcing reinforces consumer confidence and market demand. The rising focus on clean-label ingredients and traceability is encouraging manufacturers to enhance product transparency and sustainability practices, fostering steady market growth.

  • Organic certification enhances consumer trust in nutritional yeast offerings.
  • Brewer’s yeast is incorporated into clean-label vegan baked goods and supplements.
  • Eco-conscious consumers prioritize sustainable sourcing and traceability.

Analysis of the Brewer’s Yeast Market in France

The demand for brewer’s yeast in France is anticipated to rise at a CAGR of 5.2% through 2035, fueled by strong culinary traditions and increasing interest in nutritional supplements. French consumers are embracing brewer’s yeast for its rich umami flavor and natural vitamin B content, particularly in gourmet vegan cheeses, soups, and artisanal seasoning blends.

The market benefits from growing consumer experimentation with yeast-based ingredients in both home cooking and foodservice sectors. Enhanced retail visibility of nutritional supplements featuring brewer’s yeast further supports market expansion. Additionally, clean-label formulations align well with the health and wellness preferences of French consumers seeking natural and functional foods. The premium positioning of yeast-based ingredients in gourmet and health-conscious applications is expected to drive consistent growth.

  • Yeast applications expand into gourmet vegan cooking and artisan meal kits.
  • Nutritional supplements based on brewer’s yeast gain retail visibility.
  • Clean-label ingredients support health and wellness positioning in gourmet formats.

Growth Outlook for Brewer’s Yeast Market in Japan

The brewer’s yeast market in Japan is estimated to strengthen at a CAGR of 4.8% through 2035, shaped by traditional taste preferences and increasing consumer focus on health and wellness. The alignment of brewer’s yeast with umami-rich flavors makes it a popular choice in Japanese cuisine, while growing demand for gut-friendly, low-sodium condiments supports functional food innovations. Functional beverage manufacturers are incorporating fortified yeast extracts to address digestive health and immunity trends.

Premium food brands emphasize natural seasoning bases featuring brewer’s yeast, capitalizing on local flavor profiles. Consumers in Japan show a strong preference for clean-label, vitamin-enriched yeast powders, which are often positioned as premium health products in retail markets. The combination of traditional culinary acceptance and modern health concerns is expected to support steady growth in this market.

  • Functional drinks infused with yeast extracts appeal to digestive wellness trends.
  • Umami-rich yeast formulations support demand in natural, low-sodium seasonings.
  • Health-conscious shoppers prefer clean-label, vitamin-enriched yeast powders.

Competitive Landscape of Brewer’s Yeast Market

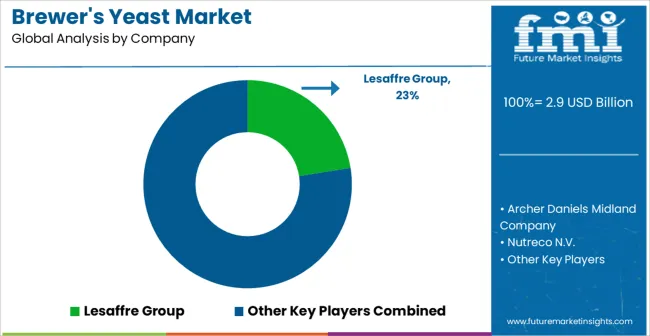
Brewers Yeast Market By Company

The brewer’s yeast market is moderately concentrated, with major players such as Lesaffre Group, Archer Daniels Midland (ADM), Nutreco N.V., Alltech Inc., and Cargill Incorporated holding significant market shares. These companies leverage extensive global production capabilities, strong distribution networks, and integrated supply chains to maintain leadership positions. Strategic acquisitions and investments in research and development allow them to expand product portfolios and enhance technological capabilities, focusing on product quality, fermentation efficiency, and sustainability. Vertical integration is common, enabling control from raw material sourcing to finished product delivery.

Regional and specialty players like Angel Yeast, AB Mauri, Lallemand Inc., Leiber GmbH, Kerry Group, Oriental Yeast, and Chr. Hansen differentiate themselves through innovation in strain development, organic yeast extracts, and customized applications in food, beverages, animal nutrition, and nutraceutical sectors. These companies focus on producing value-added yeast products such as bio-enhanced strains, umami-rich extracts, and plant-based beverage yeasts, catering to evolving consumer preferences for natural and functional ingredients.

Barriers to entry remain moderate due to high capital investment, strict quality standards, and the need to develop brand recognition in local markets. However, the increasing consumer demand for clean-label, sustainable, and functional products provides opportunities for companies that can deliver traceable, nutritionally beneficial, and environmentally responsible brewer’s yeast variants. Competitive advantage will depend on innovation, sustainability practices, and effective market penetration across diverse regions and applications.

Scope of Report

Item Value
Quantitative Units USD 2.9 Billion
Product Type Dry Brewer’s Yeast, Liquid Brewer’s Yeast
End Use Food and Beverage Industry, Pharmaceutical Industry, Brewing Industries
Regions Covered North America, Europe, Asia-Pacific, Latin America, Oceania, Middle East & Africa
Countries Covered United States, Canada, United Kingdom, Germany, France, China, Japan, South Korea, Brazil, Australia and 40+ countries
Key Companies Profiled Lesaffre Group, Archer Daniels Midland Company, Nutreco N.V., Alltech Inc., Cargill Incorporated, Leiber GmbH, Associated British Food Plc., AB Mauri India Pvt. Ltd., Kothari Fermentation and Biochem Ltd., Angel Yeast Company, Oriental Yeast Co., Ltd, Hansen Holding A/S, Koninklijke DSM N.V., Bruchem Inc, Scandinavian Formulas, Omega Yeast Labs, Lallemand Inc., Synergy Flavors
Additional Attributes Dollar sales by application and purity grade, regional demand trends, competitive landscape, consumer preferences for natural versus synthetic alternatives, integration with sustainable sourcing practices, innovations in extraction technology and quality standardization for diverse industrial applications

Key Segments

By Product Type:

  • Dry Brewer’s Yeast
  • Liquid

By End Use:

  • Food and Beverage Industry
  • Pharmaceutical Industry
  • Brewing Industries

By Region:

  • North America
  • Latin America
  • Western Europe
  • Eastern Europe
  • East Asia
  • South Asia & Pacific
  • Middle East and Africa

Table of Content

  1. Executive Summary
    • Global Market Outlook
    • Demand-side Trends
    • Supply-side Trends
    • Technology Roadmap Analysis
    • Analysis and Recommendations
  2. Market Overview
    • Market Coverage / Taxonomy
    • Market Definition / Scope / Limitations
  3. Market Background
    • Market Dynamics
      • Drivers
      • Restraints
      • Opportunity
      • Trends
    • Scenario Forecast
      • Demand in Optimistic Scenario
      • Demand in Likely Scenario
      • Demand in Conservative Scenario
    • Opportunity Map Analysis
    • Product Life Cycle Analysis
    • Supply Chain Analysis
      • Supply Side Participants and their Roles
        • Producers
        • Mid-Level Participants (Traders/ Agents/ Brokers)
        • Wholesalers and Distributors
      • Value Added and Value Created at Node in the Supply Chain
      • List of Raw Material Suppliers
      • List of Existing and Potential Buyer’s
    • Investment Feasibility Matrix
    • Value Chain Analysis
      • Profit Margin Analysis
      • Wholesalers and Distributors
      • Retailers
    • PESTLE and Porter’s Analysis
    • Regulatory Landscape
      • By Key Regions
      • By Key Countries
    • Regional Parent Market Outlook
    • Production and Consumption Statistics
    • Import and Export Statistics
  4. Global Market Analysis 2020 to 2024 and Forecast, 2025 to 2035
    • Historical Market Size Value (USD Billion) & Volume (Metric Tons) Analysis, 2020 to 2024
    • Current and Future Market Size Value (USD Billion) & Volume (Metric Tons) Projections, 2025 to 2035
      • Y-o-Y Growth Trend Analysis
      • Absolute $ Opportunity Analysis
  5. Global Market Pricing Analysis 2020 to 2024 and Forecast 2025 to 2035
  6. Global Market Analysis 2020 to 2024 and Forecast 2025 to 2035, By Product Type
    • Introduction / Key Findings
    • Historical Market Size Value (USD Billion) & Volume (Metric Tons) Analysis By Product Type, 2020 to 2024
    • Current and Future Market Size Value (USD Billion) & Volume (Metric Tons) Analysis and Forecast By Product Type, 2025 to 2035
      • Dry Brewer’s Yeast
      • Liquid
    • Y-o-Y Growth Trend Analysis By Product Type, 2020 to 2024
    • Absolute $ Opportunity Analysis By Product Type, 2025 to 2035
  7. Global Market Analysis 2020 to 2024 and Forecast 2025 to 2035, By End Use
    • Introduction / Key Findings
    • Historical Market Size Value (USD Billion) & Volume (Metric Tons) Analysis By End Use, 2020 to 2024
    • Current and Future Market Size Value (USD Billion) & Volume (Metric Tons) Analysis and Forecast By End Use, 2025 to 2035
      • Food and Beverage Industry
      • Pharmaceutical Industry
      • Brewing Industries
    • Y-o-Y Growth Trend Analysis By End Use, 2020 to 2024
    • Absolute $ Opportunity Analysis By End Use, 2025 to 2035
  8. Global Market Analysis 2020 to 2024 and Forecast 2025 to 2035, By Region
    • Introduction
    • Historical Market Size Value (USD Billion) & Volume (Metric Tons) Analysis By Region, 2020 to 2024
    • Current Market Size Value (USD Billion) & Volume (Metric Tons) Analysis and Forecast By Region, 2025 to 2035
      • North America
      • Latin America
      • Western Europe
      • Eastern Europe
      • East Asia
      • South Asia & Pacific
      • Middle East and Africa
    • Market Attractiveness Analysis By Region
  9. North America Market Analysis 2020 to 2024 and Forecast 2025 to 2035, By Country
    • Historical Market Size Value (USD Billion) & Volume (Metric Tons) Trend Analysis By Market Taxonomy, 2020 to 2024
    • Market Size Value (USD Billion) & Volume (Metric Tons) Forecast By Market Taxonomy, 2025 to 2035
      • By Country
        • USA
        • Canada
        • Mexico
      • By Product Type
      • By End Use
    • Market Attractiveness Analysis
      • By Country
      • By Product Type
      • By End Use
    • Key Takeaways
  10. Latin America Market Analysis 2020 to 2024 and Forecast 2025 to 2035, By Country
    • Historical Market Size Value (USD Billion) & Volume (Metric Tons) Trend Analysis By Market Taxonomy, 2020 to 2024
    • Market Size Value (USD Billion) & Volume (Metric Tons) Forecast By Market Taxonomy, 2025 to 2035
      • By Country
        • Brazil
        • Argentina
        • Rest of LATAM
      • By Product Type
      • By End Use
    • Market Attractiveness Analysis
      • By Country
      • By Product Type
      • By End Use
    • Key Takeaways
  11. Western Europe Market Analysis 2020 to 2024 and Forecast 2025 to 2035, By Country
    • Historical Market Size Value (USD Billion) & Volume (Metric Tons) Trend Analysis By Market Taxonomy, 2020 to 2024
    • Market Size Value (USD Billion) & Volume (Metric Tons) Forecast By Market Taxonomy, 2025 to 2035
      • By Country
        • Germany
        • Italy
        • France
        • UK
        • Spain
        • BENELUX
        • Nordic
        • Rest of W.Europe
      • By Product Type
      • By End Use
    • Market Attractiveness Analysis
      • By Country
      • By Product Type
      • By End Use
    • Key Takeaways
  12. Eastern Europe Market Analysis 2020 to 2024 and Forecast 2025 to 2035, By Country
    • Historical Market Size Value (USD Billion) & Volume (Metric Tons) Trend Analysis By Market Taxonomy, 2020 to 2024
    • Market Size Value (USD Billion) & Volume (Metric Tons) Forecast By Market Taxonomy, 2025 to 2035
      • By Country
        • Russia
        • Hungary
        • Poland
        • Balkan & Baltics
        • Rest of E. Europe
      • By Product Type
      • By End Use
    • Market Attractiveness Analysis
      • By Country
      • By Product Type
      • By End Use
    • Key Takeaways
  13. East Asia Market Analysis 2020 to 2024 and Forecast 2025 to 2035, By Country
    • Historical Market Size Value (USD Billion) & Volume (Metric Tons) Trend Analysis By Market Taxonomy, 2020 to 2024
    • Market Size Value (USD Billion) & Volume (Metric Tons) Forecast By Market Taxonomy, 2025 to 2035
      • By Country
        • China
        • Japan
        • South Korea
      • By Product Type
      • By End Use
    • Market Attractiveness Analysis
      • By Country
      • By Product Type
      • By End Use
    • Key Takeaways
  14. South Asia & Pacific Market Analysis 2020 to 2024 and Forecast 2025 to 2035, By Country
    • Historical Market Size Value (USD Billion) & Volume (Metric Tons) Trend Analysis By Market Taxonomy, 2020 to 2024
    • Market Size Value (USD Billion) & Volume (Metric Tons) Forecast By Market Taxonomy, 2025 to 2035
      • By Country
        • India
        • Australia & New Zealand
        • ASEAN
        • Rest of SAP
      • By Product Type
      • By End Use
    • Market Attractiveness Analysis
      • By Country
      • By Product Type
      • By End Use
    • Key Takeaways
  15. Middle East and Africa Market Analysis 2020 to 2024 and Forecast 2025 to 2035, By Country
    • Historical Market Size Value (USD Billion) & Volume (Metric Tons) Trend Analysis By Market Taxonomy, 2020 to 2024
    • Market Size Value (USD Billion) & Volume (Metric Tons) Forecast By Market Taxonomy, 2025 to 2035
      • By Country
        • GCC Countries
        • Northern Africa
        • South Africa
        • Turkiye
        • Rest of MEA
      • By Product Type
      • By End Use
    • Market Attractiveness Analysis
      • By Country
      • By Product Type
      • By End Use
    • Key Takeaways
  16. Key Countries Market Analysis
    • USA
      • Pricing Analysis
      • Market Share Analysis, 2024
        • By Product Type
        • By End Use
    • Canada
      • Pricing Analysis
      • Market Share Analysis, 2024
        • By Product Type
        • By End Use
    • Brazil
      • Pricing Analysis
      • Market Share Analysis, 2024
        • By Product Type
        • By End Use
    • Mexico
      • Pricing Analysis
      • Market Share Analysis, 2024
        • By Product Type
        • By End Use
    • Argentina
      • Pricing Analysis
      • Market Share Analysis, 2024
        • By Product Type
        • By End Use
  17. Market Structure Analysis
    • Competition Dashboard
    • Competition Benchmarking
    • Market Share Analysis of Top Players
      • By Regional
      • By Product Type
      • By End Use
  18. Competition Analysis
    • Competition Deep Dive
      • Lesaffre Group
        • Overview
        • Product Portfolio
        • Profitability by Market Segments (Product/Age /Sales Channel/Region)
        • Sales Footprint
        • Strategy Overview
          • Marketing Strategy
          • Product Strategy
          • Channel Strategy
      • Archer Daniels Midland Company
        • Overview
        • Product Portfolio
        • Profitability by Market Segments (Product/Age /Sales Channel/Region)
        • Sales Footprint
        • Strategy Overview
          • Marketing Strategy
          • Product Strategy
          • Channel Strategy
      • Nutreco N.V.
        • Overview
        • Product Portfolio
        • Profitability by Market Segments (Product/Age /Sales Channel/Region)
        • Sales Footprint
        • Strategy Overview
          • Marketing Strategy
          • Product Strategy
          • Channel Strategy
      • Alltech Inc.
        • Overview
        • Product Portfolio
        • Profitability by Market Segments (Product/Age /Sales Channel/Region)
        • Sales Footprint
        • Strategy Overview
          • Marketing Strategy
          • Product Strategy
          • Channel Strategy
      • Cargill Incorporated
        • Overview
        • Product Portfolio
        • Profitability by Market Segments (Product/Age /Sales Channel/Region)
        • Sales Footprint
        • Strategy Overview
          • Marketing Strategy
          • Product Strategy
          • Channel Strategy
      • Leiber GmbH
        • Overview
        • Product Portfolio
        • Profitability by Market Segments (Product/Age /Sales Channel/Region)
        • Sales Footprint
        • Strategy Overview
          • Marketing Strategy
          • Product Strategy
          • Channel Strategy
      • Associated British Food Plc.
        • Overview
        • Product Portfolio
        • Profitability by Market Segments (Product/Age /Sales Channel/Region)
        • Sales Footprint
        • Strategy Overview
          • Marketing Strategy
          • Product Strategy
          • Channel Strategy
      • AB Mauri India Pvt. Ltd.
        • Overview
        • Product Portfolio
        • Profitability by Market Segments (Product/Age /Sales Channel/Region)
        • Sales Footprint
        • Strategy Overview
          • Marketing Strategy
          • Product Strategy
          • Channel Strategy
      • Kothari Fermentation and Biochem Ltd.
        • Overview
        • Product Portfolio
        • Profitability by Market Segments (Product/Age /Sales Channel/Region)
        • Sales Footprint
        • Strategy Overview
          • Marketing Strategy
          • Product Strategy
          • Channel Strategy
      • Angel yeast company
        • Overview
        • Product Portfolio
        • Profitability by Market Segments (Product/Age /Sales Channel/Region)
        • Sales Footprint
        • Strategy Overview
          • Marketing Strategy
          • Product Strategy
          • Channel Strategy
      • Oriental Yeast Co., Ltd
        • Overview
        • Product Portfolio
        • Profitability by Market Segments (Product/Age /Sales Channel/Region)
        • Sales Footprint
        • Strategy Overview
          • Marketing Strategy
          • Product Strategy
          • Channel Strategy
      • Hansen Holding A/S
        • Overview
        • Product Portfolio
        • Profitability by Market Segments (Product/Age /Sales Channel/Region)
        • Sales Footprint
        • Strategy Overview
          • Marketing Strategy
          • Product Strategy
          • Channel Strategy
      • Koninklijke DSM N.V.
        • Overview
        • Product Portfolio
        • Profitability by Market Segments (Product/Age /Sales Channel/Region)
        • Sales Footprint
        • Strategy Overview
          • Marketing Strategy
          • Product Strategy
          • Channel Strategy
      • Bruchem Inc
        • Overview
        • Product Portfolio
        • Profitability by Market Segments (Product/Age /Sales Channel/Region)
        • Sales Footprint
        • Strategy Overview
          • Marketing Strategy
          • Product Strategy
          • Channel Strategy
      • Scandinavian Formulas
        • Overview
        • Product Portfolio
        • Profitability by Market Segments (Product/Age /Sales Channel/Region)
        • Sales Footprint
        • Strategy Overview
          • Marketing Strategy
          • Product Strategy
          • Channel Strategy
      • Omega Yeast Labs
        • Overview
        • Product Portfolio
        • Profitability by Market Segments (Product/Age /Sales Channel/Region)
        • Sales Footprint
        • Strategy Overview
          • Marketing Strategy
          • Product Strategy
          • Channel Strategy
      • Lallemand Inc.
        • Overview
        • Product Portfolio
        • Profitability by Market Segments (Product/Age /Sales Channel/Region)
        • Sales Footprint
        • Strategy Overview
          • Marketing Strategy
          • Product Strategy
          • Channel Strategy
      • Synergy Flavors
        • Overview
        • Product Portfolio
        • Profitability by Market Segments (Product/Age /Sales Channel/Region)
        • Sales Footprint
        • Strategy Overview
          • Marketing Strategy
          • Product Strategy
          • Channel Strategy
  19. Assumptions & Acronyms Used
  20. Research Methodology

List of Tables

  • Table 1: Global Market Value (USD Billion) Forecast by Region, 2020-2035
  • Table 2: Global Market Volume (Metric Tons) Forecast by Region, 2020-2035
  • Table 3: Global Market Value (USD Billion) Forecast by Product Type, 2020-2035
  • Table 4: Global Market Volume (Metric Tons) Forecast by Product Type, 2020-2035
  • Table 5: Global Market Value (USD Billion) Forecast by End-Use, 2020-2035
  • Table 6: Global Market Volume (Metric Tons) Forecast by End-Use, 2020-2035
  • Table 7: North America Market Value (USD Billion) Forecast by Country, 2020-2035
  • Table 8: North America Market Volume (Metric Tons) Forecast by Country, 2020-2035
  • Table 9: North America Market Value (USD Billion) Forecast by Product Type, 2020-2035
  • Table 10: North America Market Volume (Metric Tons) Forecast by Product Type, 2020-2035
  • Table 11: North America Market Value (USD Billion) Forecast by End-Use, 2020-2035
  • Table 12: North America Market Volume (Metric Tons) Forecast by End-Use, 2020-2035
  • Table 13: Latin America Market Value (USD Billion) Forecast by Country, 2020-2035
  • Table 14: Latin America Market Volume (Metric Tons) Forecast by Country, 2020-2035
  • Table 15: Latin America Market Value (USD Billion) Forecast by Product Type, 2020-2035
  • Table 16: Latin America Market Volume (Metric Tons) Forecast by Product Type, 2020-2035
  • Table 17: Latin America Market Value (USD Billion) Forecast by End-Use, 2020-2035
  • Table 18: Latin America Market Volume (Metric Tons) Forecast by End-Use, 2020-2035
  • Table 19: Western Europe Market Value (USD Billion) Forecast by Country, 2020-2035
  • Table 20: Western Europe Market Volume (Metric Tons) Forecast by Country, 2020-2035
  • Table 21: Western Europe Market Value (USD Billion) Forecast by Product Type, 2020-2035
  • Table 22: Western Europe Market Volume (Metric Tons) Forecast by Product Type, 2020-2035
  • Table 23: Western Europe Market Value (USD Billion) Forecast by End-Use, 2020-2035
  • Table 24: Western Europe Market Volume (Metric Tons) Forecast by End-Use, 2020-2035
  • Table 25: Eastern Europe Market Value (USD Billion) Forecast by Country, 2020-2035
  • Table 26: Eastern Europe Market Volume (Metric Tons) Forecast by Country, 2020-2035
  • Table 27: Eastern Europe Market Value (USD Billion) Forecast by Product Type, 2020-2035
  • Table 28: Eastern Europe Market Volume (Metric Tons) Forecast by Product Type, 2020-2035
  • Table 29: Eastern Europe Market Value (USD Billion) Forecast by End-Use, 2020-2035
  • Table 30: Eastern Europe Market Volume (Metric Tons) Forecast by End-Use, 2020-2035
  • Table 31: East Asia Market Value (USD Billion) Forecast by Country, 2020-2035
  • Table 32: East Asia Market Volume (Metric Tons) Forecast by Country, 2020-2035
  • Table 33: East Asia Market Value (USD Billion) Forecast by Product Type, 2020-2035
  • Table 34: East Asia Market Volume (Metric Tons) Forecast by Product Type, 2020-2035
  • Table 35: East Asia Market Value (USD Billion) Forecast by End-Use, 2020-2035
  • Table 36: East Asia Market Volume (Metric Tons) Forecast by End-Use, 2020-2035
  • Table 37: South Asia & Pacific Market Value (USD Billion) Forecast by Country, 2020-2035
  • Table 38: South Asia & Pacific Market Volume (Metric Tons) Forecast by Country, 2020-2035
  • Table 39: South Asia & Pacific Market Value (USD Billion) Forecast by Product Type, 2020-2035
  • Table 40: South Asia & Pacific Market Volume (Metric Tons) Forecast by Product Type, 2020-2035
  • Table 41: South Asia & Pacific Market Value (USD Billion) Forecast by End-Use, 2020-2035
  • Table 42: South Asia & Pacific Market Volume (Metric Tons) Forecast by End-Use, 2020-2035
  • Table 43: Middle East and Africa Market Value (USD Billion) Forecast by Country, 2020-2035
  • Table 44: Middle East and Africa Market Volume (Metric Tons) Forecast by Country, 2020-2035
  • Table 45: Middle East and Africa Market Value (USD Billion) Forecast by Product Type, 2020-2035
  • Table 46: Middle East and Africa Market Volume (Metric Tons) Forecast by Product Type, 2020-2035
  • Table 47: Middle East and Africa Market Value (USD Billion) Forecast by End-Use, 2020-2035
  • Table 48: Middle East and Africa Market Volume (Metric Tons) Forecast by End-Use, 2020-2035

List of Figures

  • Figure 1: Global Market Volume (Metric Tons) Forecast 2020-2035
  • Figure 2: Global Market Pricing Analysis
  • Figure 3: Global Market Value (USD Billion) Forecast 2020-2035
  • Figure 4: Global Market Value Share and BPS Analysis by Product Type, 2025 and 2035
  • Figure 5: Global Market Y-o-Y Growth Comparison by Product Type, 2025-2035
  • Figure 6: Global Market Attractiveness Analysis by Product Type
  • Figure 7: Global Market Value Share and BPS Analysis by End-Use, 2025 and 2035
  • Figure 8: Global Market Y-o-Y Growth Comparison by End-Use, 2025-2035
  • Figure 9: Global Market Attractiveness Analysis by End-Use
  • Figure 10: Global Market Value (USD Billion) Share and BPS Analysis by Region, 2025 and 2035
  • Figure 11: Global Market Y-o-Y Growth Comparison by Region, 2025-2035
  • Figure 12: Global Market Attractiveness Analysis by Region
  • Figure 13: North America Market Incremental $ Opportunity, 2025-2035
  • Figure 14: Latin America Market Incremental $ Opportunity, 2025-2035
  • Figure 15: Western Europe Market Incremental $ Opportunity, 2025-2035
  • Figure 16: Eastern Europe Market Incremental $ Opportunity, 2025-2035
  • Figure 17: East Asia Market Incremental $ Opportunity, 2025-2035
  • Figure 18: South Asia & Pacific Market Incremental $ Opportunity, 2025-2035
  • Figure 19: Middle East and Africa Market Incremental $ Opportunity, 2025-2035
  • Figure 20: North America Market Value Share and BPS Analysis by Country, 2025 and 2035
  • Figure 21: North America Market Value Share and BPS Analysis by Product Type, 2025 and 2035
  • Figure 22: North America Market Y-o-Y Growth Comparison by Product Type, 2025-2035
  • Figure 23: North America Market Attractiveness Analysis by Product Type
  • Figure 24: North America Market Value Share and BPS Analysis by End-Use, 2025 and 2035
  • Figure 25: North America Market Y-o-Y Growth Comparison by End-Use, 2025-2035
  • Figure 26: North America Market Attractiveness Analysis by End-Use
  • Figure 27: Latin America Market Value Share and BPS Analysis by Country, 2025 and 2035
  • Figure 28: Latin America Market Value Share and BPS Analysis by Product Type, 2025 and 2035
  • Figure 29: Latin America Market Y-o-Y Growth Comparison by Product Type, 2025-2035
  • Figure 30: Latin America Market Attractiveness Analysis by Product Type
  • Figure 31: Latin America Market Value Share and BPS Analysis by End-Use, 2025 and 2035
  • Figure 32: Latin America Market Y-o-Y Growth Comparison by End-Use, 2025-2035
  • Figure 33: Latin America Market Attractiveness Analysis by End-Use
  • Figure 34: Western Europe Market Value Share and BPS Analysis by Country, 2025 and 2035
  • Figure 35: Western Europe Market Value Share and BPS Analysis by Product Type, 2025 and 2035
  • Figure 36: Western Europe Market Y-o-Y Growth Comparison by Product Type, 2025-2035
  • Figure 37: Western Europe Market Attractiveness Analysis by Product Type
  • Figure 38: Western Europe Market Value Share and BPS Analysis by End-Use, 2025 and 2035
  • Figure 39: Western Europe Market Y-o-Y Growth Comparison by End-Use, 2025-2035
  • Figure 40: Western Europe Market Attractiveness Analysis by End-Use
  • Figure 41: Eastern Europe Market Value Share and BPS Analysis by Country, 2025 and 2035
  • Figure 42: Eastern Europe Market Value Share and BPS Analysis by Product Type, 2025 and 2035
  • Figure 43: Eastern Europe Market Y-o-Y Growth Comparison by Product Type, 2025-2035
  • Figure 44: Eastern Europe Market Attractiveness Analysis by Product Type
  • Figure 45: Eastern Europe Market Value Share and BPS Analysis by End-Use, 2025 and 2035
  • Figure 46: Eastern Europe Market Y-o-Y Growth Comparison by End-Use, 2025-2035
  • Figure 47: Eastern Europe Market Attractiveness Analysis by End-Use
  • Figure 48: East Asia Market Value Share and BPS Analysis by Country, 2025 and 2035
  • Figure 49: East Asia Market Value Share and BPS Analysis by Product Type, 2025 and 2035
  • Figure 50: East Asia Market Y-o-Y Growth Comparison by Product Type, 2025-2035
  • Figure 51: East Asia Market Attractiveness Analysis by Product Type
  • Figure 52: East Asia Market Value Share and BPS Analysis by End-Use, 2025 and 2035
  • Figure 53: East Asia Market Y-o-Y Growth Comparison by End-Use, 2025-2035
  • Figure 54: East Asia Market Attractiveness Analysis by End-Use
  • Figure 55: South Asia & Pacific Market Value Share and BPS Analysis by Country, 2025 and 2035
  • Figure 56: South Asia & Pacific Market Value Share and BPS Analysis by Product Type, 2025 and 2035
  • Figure 57: South Asia & Pacific Market Y-o-Y Growth Comparison by Product Type, 2025-2035
  • Figure 58: South Asia & Pacific Market Attractiveness Analysis by Product Type
  • Figure 59: South Asia & Pacific Market Value Share and BPS Analysis by End-Use, 2025 and 2035
  • Figure 60: South Asia & Pacific Market Y-o-Y Growth Comparison by End-Use, 2025-2035
  • Figure 61: South Asia & Pacific Market Attractiveness Analysis by End-Use
  • Figure 62: Middle East and Africa Market Value Share and BPS Analysis by Country, 2025 and 2035
  • Figure 63: Middle East and Africa Market Value Share and BPS Analysis by Product Type, 2025 and 2035
  • Figure 64: Middle East and Africa Market Y-o-Y Growth Comparison by Product Type, 2025-2035
  • Figure 65: Middle East and Africa Market Attractiveness Analysis by Product Type
  • Figure 66: Middle East and Africa Market Value Share and BPS Analysis by End-Use, 2025 and 2035
  • Figure 67: Middle East and Africa Market Y-o-Y Growth Comparison by End-Use, 2025-2035
  • Figure 68: Middle East and Africa Market Attractiveness Analysis by End-Use
  • Figure 69: Global Market - Tier Structure Analysis
  • Figure 70: Global Market - Company Share Analysis

Frequently Asked Questions

How big is the brewer’s yeast market in 2025?

The global brewer’s yeast market is estimated to be valued at USD 2.9 billion in 2025.

What will be the size of the brewer’s yeast market in 2035?

The market size for the brewer’s yeast market is projected to reach USD 5.3 billion by 2035.

How much will be the brewer’s yeast market growth between 2025 and 2035?

The brewer’s yeast market is expected to grow at a 6.1% CAGR between 2025 and 2035.

Which product type is projected to lead in the brewer’s yeast market in 2025?

The dry brewer’s yeast segment is projected to lead in the brewer’s yeast market with 71% market share in 2025.

Which end use industry is set to contribute significant share in the brewer’s yeast market in 2025?

In terms of end use industry, the food and beverage industry segment is expected to command 50% share in the brewer’s yeast market in 2025.

Explore Similar Insights

Future Market Insights

Brewer's Yeast Market