Global Car Market Size, Share, and Forecast Outlook (2025 to 2035)

The global car market has been valued at USD 1.61 trillion in 2025 and is forecast to reach nearly USD 4.8 trillion by 2035, expanding at a CAGR of 11.5%.
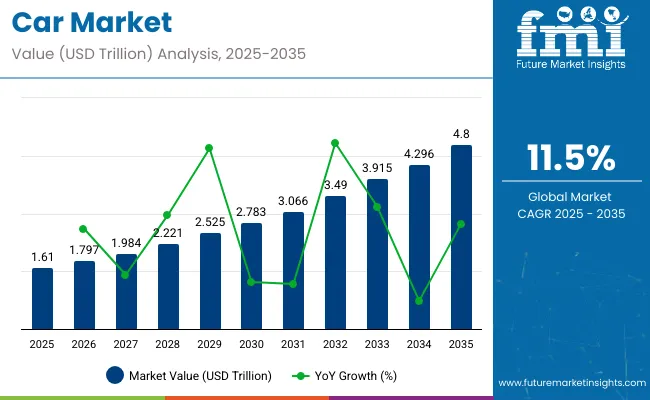
Quick Stats of Global Car Market

  • Global Car Market Size (2025): USD 1.61 trillion
  • Projected Global Car Market Size (2035): USD 4.8 trillion
  • Forecast CAGR of Global Car Market (2025 to 2035): 11.5%
  • Leading Segment of Global Car Market (2025): SUVs (38%)
  • Key Growth Regions of Global Car Market: China, India, Germany, United States, United Kingdom
  • Top Key Player of Global Car Market: Toyota Motor holding 13.7% Industry Share.

Car Market

Metric Value
Industry Size (2025E) USD 1.61 trillion
Industry Value (2035F) USD 4.8 trillion
CAGR (2025 to 2035) 11.5%

The market trajectory reflects a stable pattern of long-range accumulation, driven by rising fleet modernization, higher adoption of electric vehicle lines, and increased consumer preference for connected transport systems. Between 2025 and 2028, the rolling CAGR is estimated at 10.6%, with consistent uplift from hybrid variants across ASEAN and gradual internal combustion engine phase-out across select OECD zones. The 2028 to 2031 period indicates a rolling CAGR close to 11.4%, showing amplified contribution from AI-based driver assistance integrations.

Rolling CAGR between 2031 and 2035 trends higher at approximately 12.2%, led by rising demand for software-defined vehicle platforms, premium electric sedans, and performance utility vehicles. Price elasticity has remained stable during these transition phases, allowing inventory cycles to rebalance without margin compression.

The rolling CAGR framework confirms structural strength without reliance on sharp peaks. Manufacturers are projected to retain pricing power as digital mobility platforms widen access and usage metrics. Each sub-period exhibits consistent gains, avoiding volatility typical of single-trend reliance, which reinforces a long-term growth outlook.

The car industry has formed a substantial part of the global mobility ecosystem. Around 45% of vehicle manufacturing operations have been directed toward car assembly, reflecting its dominant share in the overall automotive production base. Roughly 55% of the light-duty transport sector has been influenced by car models, especially in commuter and personal use categories.

About 30% of emissions mitigation investments across the transport value chain have been linked to passenger cars due to evolving regulatory frameworks. In automotive sensor deployment, car models have contributed to nearly 50% of system integration across driver assistance and navigation applications. Nearly 40% of structural metals used in road vehicles have been assigned to car manufacturing for body and underframe design.

The shift toward electrified cars have reshaped product planning across global automakers, accounting for 20% of current rollouts. Hybridized platforms have been introduced in 35% of new launches, while connected services now feature in 40% of new car deliveries. Flexible ownership formats have accounted for 10% of market distribution. In-house assembly of critical subcomponents has been prioritized to stabilize procurement. Real-time analytics and digital twin frameworks have been utilized by 25% of global plants to streamline output precision.

Top Dynamics Driving the Global Car Market

Fuel-flexible models and city-adapted SUVs have been prioritized by OEMs to meet regional mandates. Advanced infotainment and semi-autonomous features have been introduced across mid-tier variants to maintain competitiveness. Nearly 60% of car buyers in ASEAN and MENA regions have relied on digital platforms for research and financing.

Localized production clusters have been developed in Indonesia, Morocco, and Mexico to manage costs and improve supply agility. Shifts in emission laws and powertrain innovation have directly influenced vehicle design and distribution strategies.

Vehicle ownership demand has been influenced by shifting demographics

Over 65% of first-time car buyers in India and Southeast Asia have opted for vehicles below 1,500 cc engine capacity. Rising urban employment and two-wheeler to four-wheeler migration have supported compact hatchback and sedan sales. Monthly bookings for compact SUVs increased by 22% in Brazil between Q1 and Q2 2025. In South Africa, more than 40% of new passenger cars sold in 2024 were financed through subscription or flexible leasing models.

Dual-fuel options, including petrol-CNG and petrol-ethanol, have been introduced in low-emission zones. Automakers have released models with high ground clearance and shorter turning radii to match dense traffic and poor road quality. Regional variants featuring simplified digital dashboards, wireless mirroring, and rear sensors have dominated demand in the sub-USD 15,000 bracket. Local assembly operations have enabled delivery timelines below six weeks across selected metro zones.

Industry constraints have been observed due to input volatility

Lithium carbonate prices fluctuated by over 45% in 2024, disrupting EV battery cost structures. Semiconductor lead times have averaged 38 weeks, delaying final assembly of infotainment-heavy vehicles. In Europe and Japan, energy-intensive stamping and paint shop operations saw cost increases exceeding 20% year-over-year. Manufacturers in India reported a 12-15% increase in total production costs for B-segment vehicles between 2023 and 2025.

Container shipping rates remained volatile, with key routes from East Asia to the EU rising by 18% in Q1 2025. Multiple OEMs experienced unit shortages in fleet channels, especially in hybrid and petrol-automatic trims. High reliance on a limited pool of tier-1 vendors has restricted platform scalability. In ASEAN, government-imposed localization thresholds delayed homologation of imported components, lengthening rollout timelines for new model introductions across key markets like Vietnam and Malaysia.

Regional production shifts have opened new sales channels

Electric vehicle production in China surpassed 10 million units in 2024, capturing nearly 30% of global EV output. India’s FAME-linked incentives pushed battery EV sales to over 140,000 units in the same year. Localized cell manufacturing has started in Thailand, South Korea, and Brazil, reducing import costs by up to 17%. Indonesia and South Africa have both committed to policy frameworks supporting low-cost urban EV assembly under 100 km range.

Entry-level EVs priced below USD 20,000 have gained visibility across Latin America due to duty exemptions. Software-defined vehicle architecture has been integrated into new launches to enable OTA upgrades. Battery-swapping networks have been piloted in selected Indian cities to support delivery fleets. Manufacturing units optimized for modular chassis have been commissioned in Mexico and Eastern Europe to supply neighboring trade blocks, meeting origin-specific compliance without reengineering.

Subscription-based usage models have been adopted in urban clusters

In Japan and Germany, subscription-based car ownership grew by over 35% year-over-year during 2024, focused on compact and urban crossover models. Over 20,000 active car subscriptions have been recorded across Delhi, Mumbai, and Bengaluru combined, with average usage durations of 6-11 months. In the United States, more than 12% of Gen Z car buyers opted for pay-per-mile ownership via digital platforms.

OEMs have included flexible monthly plans bundled with insurance, scheduled maintenance, and roadside assistance. Electric variants now account for over 25% of active subscriptions in London and Oslo due to zero-emission zone mandates. Real-time usage data has been leveraged by fleet operators to adjust pricing models and control wear-related expenses. Contactless onboarding and digital key systems have shortened delivery and return cycles. Subscription models are being localized for college towns, gated housing societies, and tech parks.

Analyzing Car Market by Top Investment Segments

In 2025, the car market will be led by SUVs, gasoline-powered vehicles, and franchised dealer networks. These segments account for the highest global market shares and continue to attract both consumer interest and OEM investment. Individual ownership remains the dominant end-use, although taxi, rental, and fleet models are showing marginal growth due to operational cost efficiency.

While electric propulsion is expanding, traditional gasoline platforms remain dominant. The market is being shaped by consumer preferences for performance, design flexibility, and accessible servicing, which explains the resilience of certain high-share segments across developing and developed regions alike.
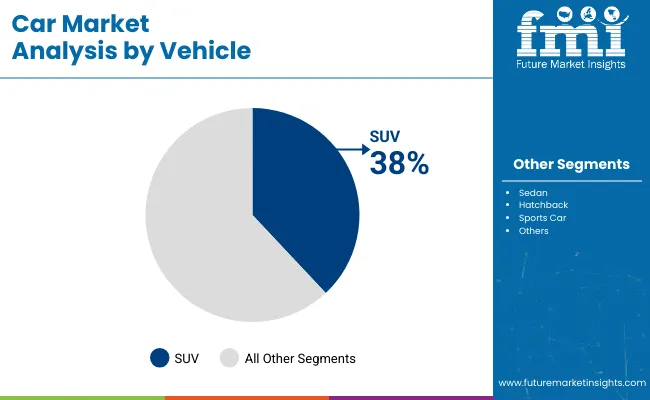
SUVs Dominate Global Demand by Vehicle Type in 2025

Car Market By Vehicle

SUVs are projected to maintain dominance in the vehicle segment with a 38% market share in 2025, driven by consumer preference for larger cabin space, road visibility, and all-terrain utility. Manufacturers such as Toyota, Ford, and Hyundai have aggressively expanded their SUV offerings, including compact and crossover variants. The high seating position, safety features, and flexibility for family and recreational use support steady sales volumes. Regions such as North America, the Middle East, and Australia continue to prefer SUVs due to road infrastructure and lifestyle alignment. The segment benefits from strong resale value and consistent model refresh cycles among leading OEMs.
  • Hyundai Tucson and Toyota RAV4 rank among the top five global SUV models by volume
  • Ford’s Bronco and Explorer lineups experienced double-digit sales growth from 2023 to 2025
  • SUV resale values are, on average, 18% higher than hatchbacks over a 3-year period

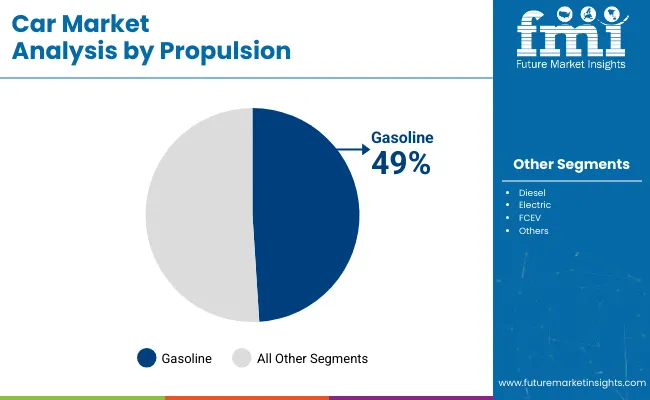
Gasoline Vehicles Remain the Largest Propulsion Segment at 49%

Car Market By Propulsion

Gasoline-powered vehicles are forecasted to maintain their lead with a 49% market share in 2025, driven by broad refueling infrastructure and improved engine efficiency. Automakers such as Honda, Chevrolet, and Kia continue to launch gasoline-based models that are more compliant with emission standards without drastically increasing costs.

In markets like Southeast Asia, Africa, and South America, gasoline remains more accessible and less regulated compared to diesel and EV alternatives. The affordability of repairs and maintenance further sustains interest in gasoline cars. While electrification grows, the gasoline segment offers performance consistency, longer range, and better support in second-hand vehicle markets.
  • Honda Civic and Kia Forte remain top-selling gasoline sedans in ASEAN and GCC countries
  • Over 70% of vehicles sold in South America in 2024 were gasoline-based
  • Advanced fuel injection systems have improved average fuel efficiency by 12% since 2021

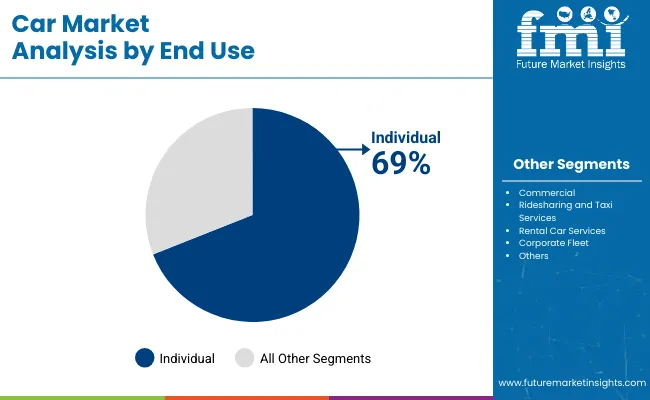
Individual Use Drives 69% of End-User Share in Car Market

Car Market By End Use

Individual car ownership remains the dominant end-use category with 69% market share in 2025, as personal vehicles offer autonomy, flexibility, and status value across socio-economic classes. Brands such as Volkswagen, Skoda, and Nissan continue to design vehicles tailored for personal daily use, including compact sedans and urban hatchbacks.

In rural and semi-urban areas of developing economies, personal car ownership is often the only viable transport option. Financing options, resale value, and personal control over maintenance schedules contribute to sustained demand. While commercial use and shared mobility are growing, their expansion remains constrained by usage limitations and regulatory concerns.
  • Over 85% of car loans issued globally in 2024 were linked to individual buyers
  • Personal car ownership in Tier-2 Indian cities grew by 28% between 2022 and 2025
  • Volkswagen Polo and Nissan Micra dominate entry-level ownership across Eastern Europe

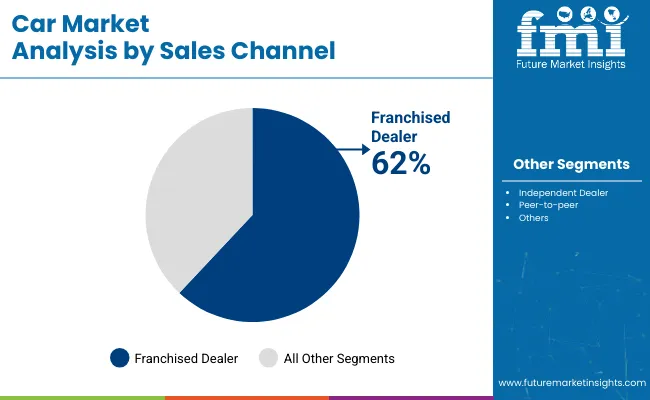
Franchised Dealers Retain 62% Sales Channel Share in 2025

Car Market By Sales

Franchised dealers are projected to account for 62% of car sales globally in 2025, maintaining their lead due to structure after-sales services, manufacturer-backed warranties, and financing assistance. OEMs including Toyota, BMW, and Chevrolet rely heavily on franchised dealer networks for launch events, customer retention, and servicing integration.

These dealerships offer consistent pricing transparency and authorized servicing, making them preferable for new buyers. Franchised dealers are especially prominent in North America, Europe, and parts of Asia where manufacturer trust and product assurance play a critical role in high-value transactions. Digital extensions of these dealers are also growing via hybrid service models.

  • Toyota operates over 5,000 franchised dealers globally with annual expansion averaging 3%
  • BMW’s dealership-linked servicing accounted for 74% of its total maintenance revenue in 2024
  • Franchised dealer financing penetration exceeds 60% in North America and Western Europe

Electric Cars Secure 26% Share Supported by OEM Expansion

Electric vehicles are estimated to account for 26% of the global car market by propulsion in 2025, owing to regulatory pressure, rising consumer awareness, and product diversification. Tesla, BYD, and Volkswagen have launched new models with longer range and lower charging times, driving mainstream adoption.

Subsidies and import duty exemptions are improving affordability in regions like Europe and China. Charging infrastructure in urban zones has also expanded significantly. However, challenges remain in rural areas and emerging economies where power access and battery cost still limit reach. Dedicated EV platforms are helping OEMs reduce manufacturing complexity and boost profit margins.
  • Tesla Model Y and BYD Dolphin collectively represent over 15% of EV units sold in 2025
  • Volkswagen’s ID series increased global deliveries by 47% YoY in the first half of 2025
  • China installed over 1.2 million new EV chargers in urban zones between 2023 and 2025

Top Countries Driving Car Market Growth and Distribution

Car Market By Country

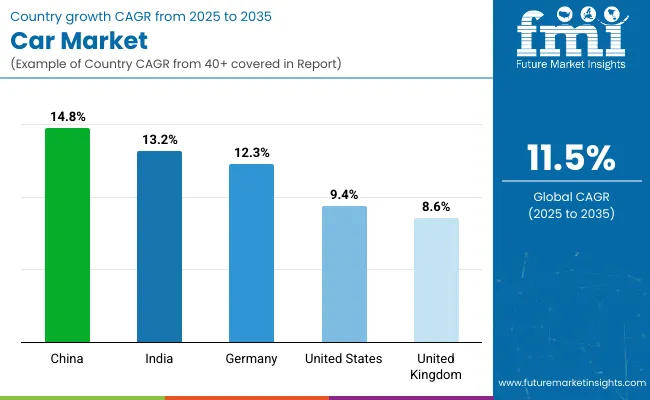
Countries CAGR (%)
Global CAGR 11.5
China (BRICS) 14.8
India (BRICS) 13.2
Germany (OECD) 12.3
United States (OECD) 9.4
United Kingdom (OECD) 8.6

The global car market is projected to grow at a CAGR of 11.5% between 2025 and 2035. China (BRICS) leads with a CAGR of 14.8%, outperforming the global average by 3.3%. India (BRICS) follows at 13.2%, maintaining a 1.7% advantage. Among OECD countries, Germany records 12.3%, slightly above the global rate by 0.8%. The United States is expected to grow at 9.4%, which is 2.1% below the global average, while the United Kingdom posts the lowest among the listed nations at 8.6%, trailing by 2.9%.

BRICS countries show stronger momentum due to domestic vehicle demand, assembly localization, and production-linked programs. OECD markets register slower growth as a result of maturity in ownership rates and regulatory transitions. ASEAN countries, though not shown in this table, are expected to approach or exceed double-digit growth in selected markets, supported by intra-bloc trade frameworks and rising local manufacturing investments.

China Car Market Growth and Technological Expansion

China is forecast to grow at a CAGR of 14.8%, outperforming the global average by 29%. Demand is being driven by affordable EV adoption, subsidy-driven urban vehicle replacement, and export-led production. Compact electric sedans and long-range SUVs have dominated domestic registrations.

OEM strategies have focused on vertically integrated battery sourcing and embedded vehicle intelligence. Charging infrastructure has expanded beyond Tier-1 cities. Provincial compliance targets have been met using AI-integrated powertrain design and OTA update capabilities.

  • Over 1.2 million EVs were exported globally from China in 2024
  • 67% of new car sales in major cities involved electric or hybrid models
  • 78% of Chinese EVs sold in 2024 used domestically manufactured batteries

India Passenger Car Demand and Electrification Outlook

India is expected to register a CAGR of 13.2%, growing 15% faster than the global average. Affordability, road infrastructure upgrades, and EV penetration in urban centers have boosted new registrations. Mid-size cars and compact electric hatchbacks are leading purchases.

Production-linked incentive schemes have enabled local assembly of EVs and lithium-ion battery units. Growth in Tier-2 and Tier-3 cities is being supported by competitive financing and low maintenance costs. Battery swapping and micro-charging infrastructure are under pilot testing in several districts.

  • EV production in India crossed 670,000 units during 2024
  • 35% of new models launched in 2024 were priced below USD 10,000
  • Passenger vehicle penetration reached 32 cars per 1,000 residents

Germany Manufacturing Strategy in Car Segment

Germany is set to grow at a CAGR of 12.3%, 7% above the global mean. Premium electric vehicles, hydrogen fuel cell variants, and modular EV platforms are being prioritized. Tier-1 suppliers have deployed autonomous braking modules and driver monitoring systems.

New assembly units are focused on AI-enhanced quality control and heat-efficient battery layouts. Exports have expanded due to increased demand for smart performance vehicles in Nordic and East Asian regions. Cross-border EV collaborations with France and Italy are ongoing.

  • 71% of cars manufactured in Germany during 2024 supported autonomous features
  • EUR 4.1 billion was allocated for smart mobility R&D in 2024
  • Electric variants accounted for 52% of total automotive exports in 2024

United States Market for Passenger Vehicles

The United States is projected to record a CAGR of 9.4%, falling 18% below the global rate. Demand continues to favor SUVs and pickup trucks with higher torque specifications. Urban EV adoption has grown, but suburban and rural segments remain slow-moving.

Model upgrades have been focused on infotainment systems, battery range enhancement, and integration of safety assist features. Federal incentives have shifted focus toward zero-emission vehicles. Supply chains for critical parts remain partially reliant on imports from East Asia.

  • 42% of all new vehicle registrations were hybrid or electric in 2024
  • USD 49,120 marked the average transaction price for new vehicles
  • Over 200,000 EVs assembled in the United States were exported globally

United Kingdom Car Sector Recovery and Output

The United Kingdom is anticipated to grow at a CAGR of 8.6%, 25% below the global average. Output has been partially restored following capacity upgrades and supply chain localization. Emphasis is being placed on converting combustion-based assembly lines to EV-centric formats.

Tax credits and emission-linked benefits have encouraged electric fleet procurement. OEMs are emphasizing compact electric hatchbacks with enhanced battery safety profiles. Domestic demand has favored brands with integrated AI driving assistance.
  • Over 910,000 passenger vehicles were manufactured in the United Kingdom in 2024
  • 38% of new registrations were for electric or low-emission vehicles
  • Local content in car manufacturing rose to 44%, from 36% two years’ prior

Leading Car Manufacturers, Suppliers, and Distributors

Car Market By Company

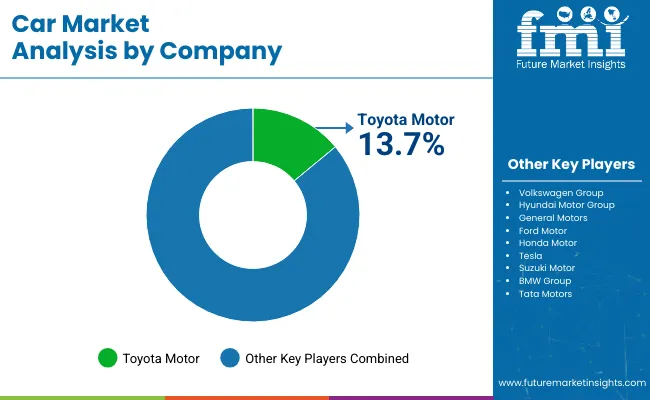
The market continues to be led by established companies such as Toyota Motor, Volkswagen, Ford Motor, and General Motors. Product portfolio expansion has been prioritized by Toyota Motor through the launch of hybrid variants across ASEAN and Latin American countries. Volkswagen has widened its sedan and crossover offerings in Europe through regional manufacturing tie-ups. Ford Motor has optimized platform sharing for cost reduction and volume flexibility in the US and Canadian markets.

General Motors has directed capital towards large SUV and pickup segments, especially within North America. BMW has concentrated on expanding electric vehicle output across Europe while maintaining leadership in the premium sedan segment. Tesla has scaled output through expanded Gigafactory operations in Germany and China. Hyundai Motor has increased its dealership footprint across Asia and the Middle East, while also streamlining exports from South Korea.

Second-tier players such as Tata Motors, Suzuki Motor, and Honda Motor have focused on value-driven segments. Tata Motors has launched compact electric cars in India to meet demand for low-cost personal transport. Suzuki Motor has expanded low-emission ICE and hybrid offerings across African and ASEAN nations. Honda Motor has diversified mid-segment vehicles for Latin America. Direct-to-consumer models, R&D into drive-cycle efficiency, and cross-platform production partnerships are now being pursued by several regional entrants.

Recent Industry News

  • In July 2025, BMW announced to launch all-new BMW 2 Series Gran Coupe in India. This car can be booked via BMW online store.
  • In July 2025, Tesla launched the model Y in India. This new autonomous vehicle is designed for the elite-class consumers of this nation.

Leading Players

  • Toyota Motor
  • Volkswagen Group
  • Hyundai Motor Group
  • General Motors
  • Ford Motor
  • Honda Motor
  • Tesla
  • Suzuki Motor
  • BMW Group
  • Tata Motors

Report Scope

Report Attributes Details
Market Size (2025) USD 1.61 trillion
Projected Market Size (2035) USD 4.8 trillion
CAGR (2025 to 2035) 11.5%
Base Year for Estimation 2024
Historical Period 2020 to 2024
Projections Period 2025 to 2035
Quantitative Units USD trillion for value and volume units as applicable
Vehicle Types Analyzed (Segment 1) Hatchback, Sedan, SUV, Sports Car, Others
Propulsion Types (Segment 2) Gasoline, Diesel, Electric, FCEV
End-Use Segments (Segment 3) Commercial, Ridesharing and Taxi Services, Rental Car Services, Corporate Fleet, Individual
Sales Channels (Segment 4) Peer-to-peer, Franchised Dealer, Independent Dealer
Regions Covered North America; Latin America; Western Europe; Eastern Europe; Asia Pacific; Middle East and Africa
Countries Covered United States, Canada, Brazil, Mexico, Germany, United Kingdom, France, Italy, China, Japan, India, UAE, South Africa
Key Players Influencing the Market Toyota Motor, Volkswagen Group, Hyundai Motor Group, General Motors, Ford Motor, Honda Motor, Tesla, Suzuki Motor, BMW Group, Tata Motors
Additional Attributes Dollar sales by fuel type (gasoline, diesel, hybrid, EV) and class (SUV, sedan, hatchback), demand influenced by urban mobility shifts, regional gains in Asia and Europe, innovation in ADAS and vehicle connectivity, environmental push through EV adoption, and emerging uses in car sharing, subscription models, and smart city integration.

Car Market Analyzed by Key Investment Segments 

By Vehicle:

  • Hatchback
  • Sedan
  • SUV
  • Sports Car
  • Others

By Propulsion:

  • Gasoline
  • Diesel
  • Electric
  • FCEV

By End-Use:

  • Commercial
  • Ridesharing and taxi services
  • Rental car services
  • Corporate fleet
  • Individual

By Sales Channel:

  • Peer-to-peer
  • Franchised dealer
  • Independent dealer

By Region:

  • North America
  • Latin America
  • Western Europe
  • Eastern Europe
  • Asia Pacific
  • The Middle East and Africa

Table of Content

  1. Executive Summary
    • Global Market Outlook
    • Demand-side Trends
    • Supply-side Trends
    • Technology Roadmap Analysis
    • Analysis and Recommendations
  2. Market Overview
    • Market Coverage / Taxonomy
    • Market Definition / Scope / Limitations
  3. Market Background
    • Market Dynamics
      • Drivers
      • Restraints
      • Opportunity
      • Trends
    • Scenario Forecast
      • Demand in Optimistic Scenario
      • Demand in Likely Scenario
      • Demand in Conservative Scenario
    • Opportunity Map Analysis
    • Product Life Cycle Analysis
    • Supply Chain Analysis
      • Supply Side Participants and their Roles
        • Producers
        • Mid-Level Participants (Traders/ Agents/ Brokers)
        • Wholesalers and Distributors
      • Value Added and Value Created at Node in the Supply Chain
      • List of Raw Material Suppliers
      • List of Existing and Potential Buyer’s
    • Investment Feasibility Matrix
    • Value Chain Analysis
      • Profit Margin Analysis
      • Wholesalers and Distributors
      • Retailers
    • PESTLE and Porter’s Analysis
    • Regulatory Landscape
      • By Key Regions
      • By Key Countries
    • Regional Parent Market Outlook
    • Production and Consumption Statistics
    • Import and Export Statistics
  4. Global Market Analysis 2020 to 2024 and Forecast, 2025 to 2035
    • Historical Market Size Value (USD Trillion) & Volume (Units) Analysis, 2020 to 2024
    • Current and Future Market Size Value (USD Trillion) & Volume (Units) Projections, 2025 to 2035
      • Y-o-Y Growth Trend Analysis
      • Absolute $ Opportunity Analysis
  5. Global Market Pricing Analysis 2020 to 2024 and Forecast 2025 to 2035
  6. Global Market Analysis 2020 to 2024 and Forecast 2025 to 2035, By Vehicle
    • Introduction / Key Findings
    • Historical Market Size Value (USD Trillion) & Volume (Units) Analysis By Vehicle, 2020 to 2024
    • Current and Future Market Size Value (USD Trillion) & Volume (Units) Analysis and Forecast By Vehicle, 2025 to 2035
      • Hatchback
      • Sedan
      • SUV
      • Sports
      • Others
    • Y-o-Y Growth Trend Analysis By Vehicle, 2020 to 2024
    • Absolute $ Opportunity Analysis By Vehicle, 2025 to 2035
  7. Global Market Analysis 2020 to 2024 and Forecast 2025 to 2035, By Propulsion
    • Introduction / Key Findings
    • Historical Market Size Value (USD Trillion) & Volume (Units) Analysis By Propulsion, 2020 to 2024
    • Current and Future Market Size Value (USD Trillion) & Volume (Units) Analysis and Forecast By Propulsion, 2025 to 2035
      • Gasoline
      • Diesel
      • Electric
      • FCEV
    • Y-o-Y Growth Trend Analysis By Propulsion, 2020 to 2024
    • Absolute $ Opportunity Analysis By Propulsion, 2025 to 2035
  8. Global Market Analysis 2020 to 2024 and Forecast 2025 to 2035, By End-Use
    • Introduction / Key Findings
    • Historical Market Size Value (USD Trillion) & Volume (Units) Analysis By End-Use, 2020 to 2024
    • Current and Future Market Size Value (USD Trillion) & Volume (Units) Analysis and Forecast By End-Use, 2025 to 2035
      • Commercial
      • Ridesharing and taxi services
      • Rental services
      • Corporate fleet
      • Individual
    • Y-o-Y Growth Trend Analysis By End-Use, 2020 to 2024
    • Absolute $ Opportunity Analysis By End-Use, 2025 to 2035
  9. Global Market Analysis 2020 to 2024 and Forecast 2025 to 2035, By Sales Channel
    • Introduction / Key Findings
    • Historical Market Size Value (USD Trillion) & Volume (Units) Analysis By Sales Channel, 2020 to 2024
    • Current and Future Market Size Value (USD Trillion) & Volume (Units) Analysis and Forecast By Sales Channel, 2025 to 2035
      • Peer-to-peer
      • Franchised dealer
      • Independent dealer
    • Y-o-Y Growth Trend Analysis By Sales Channel, 2020 to 2024
    • Absolute $ Opportunity Analysis By Sales Channel, 2025 to 2035
  10. Global Market Analysis 2020 to 2024 and Forecast 2025 to 2035, By Region
    • Introduction
    • Historical Market Size Value (USD Trillion) & Volume (Units) Analysis By Region, 2020 to 2024
    • Current Market Size Value (USD Trillion) & Volume (Units) Analysis and Forecast By Region, 2025 to 2035
      • North America
      • Latin America
      • Western Europe
      • Eastern Europe
      • East Asia
      • South Asia & Pacific
      • Middle East and Africa
    • Market Attractiveness Analysis By Region
  11. North America Market Analysis 2020 to 2024 and Forecast 2025 to 2035, By Country
    • Historical Market Size Value (USD Trillion) & Volume (Units) Trend Analysis By Market Taxonomy, 2020 to 2024
    • Market Size Value (USD Trillion) & Volume (Units) Forecast By Market Taxonomy, 2025 to 2035
      • By Country
        • USA
        • Canada
        • Mexico
      • By Vehicle
      • By Propulsion
      • By End-Use
      • By Sales Channel
    • Market Attractiveness Analysis
      • By Country
      • By Vehicle
      • By Propulsion
      • By End-Use
      • By Sales Channel
    • Key Takeaways
  12. Latin America Market Analysis 2020 to 2024 and Forecast 2025 to 2035, By Country
    • Historical Market Size Value (USD Trillion) & Volume (Units) Trend Analysis By Market Taxonomy, 2020 to 2024
    • Market Size Value (USD Trillion) & Volume (Units) Forecast By Market Taxonomy, 2025 to 2035
      • By Country
        • Brazil
        • Argentina
        • Rest of LATAM
      • By Vehicle
      • By Propulsion
      • By End-Use
      • By Sales Channel
    • Market Attractiveness Analysis
      • By Country
      • By Vehicle
      • By Propulsion
      • By End-Use
      • By Sales Channel
    • Key Takeaways
  13. Western Europe Market Analysis 2020 to 2024 and Forecast 2025 to 2035, By Country
    • Historical Market Size Value (USD Trillion) & Volume (Units) Trend Analysis By Market Taxonomy, 2020 to 2024
    • Market Size Value (USD Trillion) & Volume (Units) Forecast By Market Taxonomy, 2025 to 2035
      • By Country
        • Germany
        • Italy
        • France
        • UK
        • Spain
        • BENELUX
        • Nordic
        • Rest of W.Europe
      • By Vehicle
      • By Propulsion
      • By End-Use
      • By Sales Channel
    • Market Attractiveness Analysis
      • By Country
      • By Vehicle
      • By Propulsion
      • By End-Use
      • By Sales Channel
    • Key Takeaways
  14. Eastern Europe Market Analysis 2020 to 2024 and Forecast 2025 to 2035, By Country
    • Historical Market Size Value (USD Trillion) & Volume (Units) Trend Analysis By Market Taxonomy, 2020 to 2024
    • Market Size Value (USD Trillion) & Volume (Units) Forecast By Market Taxonomy, 2025 to 2035
      • By Country
        • Russia
        • Hungary
        • Poland
        • Balkan & Baltics
        • Rest of E. Europe
      • By Vehicle
      • By Propulsion
      • By End-Use
      • By Sales Channel
    • Market Attractiveness Analysis
      • By Country
      • By Vehicle
      • By Propulsion
      • By End-Use
      • By Sales Channel
    • Key Takeaways
  15. East Asia Market Analysis 2020 to 2024 and Forecast 2025 to 2035, By Country
    • Historical Market Size Value (USD Trillion) & Volume (Units) Trend Analysis By Market Taxonomy, 2020 to 2024
    • Market Size Value (USD Trillion) & Volume (Units) Forecast By Market Taxonomy, 2025 to 2035
      • By Country
        • China
        • Japan
        • South Korea
      • By Vehicle
      • By Propulsion
      • By End-Use
      • By Sales Channel
    • Market Attractiveness Analysis
      • By Country
      • By Vehicle
      • By Propulsion
      • By End-Use
      • By Sales Channel
    • Key Takeaways
  16. South Asia & Pacific Market Analysis 2020 to 2024 and Forecast 2025 to 2035, By Country
    • Historical Market Size Value (USD Trillion) & Volume (Units) Trend Analysis By Market Taxonomy, 2020 to 2024
    • Market Size Value (USD Trillion) & Volume (Units) Forecast By Market Taxonomy, 2025 to 2035
      • By Country
        • India
        • Australia & New Zealand
        • ASEAN
        • Rest of SAP
      • By Vehicle
      • By Propulsion
      • By End-Use
      • By Sales Channel
    • Market Attractiveness Analysis
      • By Country
      • By Vehicle
      • By Propulsion
      • By End-Use
      • By Sales Channel
    • Key Takeaways
  17. Middle East and Africa Market Analysis 2020 to 2024 and Forecast 2025 to 2035, By Country
    • Historical Market Size Value (USD Trillion) & Volume (Units) Trend Analysis By Market Taxonomy, 2020 to 2024
    • Market Size Value (USD Trillion) & Volume (Units) Forecast By Market Taxonomy, 2025 to 2035
      • By Country
        • GCC Countries
        • Northern Africa
        • South Africa
        • Turkiye
        • Rest of MEA
      • By Vehicle
      • By Propulsion
      • By End-Use
      • By Sales Channel
    • Market Attractiveness Analysis
      • By Country
      • By Vehicle
      • By Propulsion
      • By End-Use
      • By Sales Channel
    • Key Takeaways
  18. Key Countries Market Analysis
    • USA
      • Pricing Analysis
      • Market Share Analysis, 2024
        • By Vehicle
        • By Propulsion
        • By End-Use
        • By Sales Channel
    • Canada
      • Pricing Analysis
      • Market Share Analysis, 2024
        • By Vehicle
        • By Propulsion
        • By End-Use
        • By Sales Channel
    • Brazil
      • Pricing Analysis
      • Market Share Analysis, 2024
        • By Vehicle
        • By Propulsion
        • By End-Use
        • By Sales Channel
    • Mexico
      • Pricing Analysis
      • Market Share Analysis, 2024
        • By Vehicle
        • By Propulsion
        • By End-Use
        • By Sales Channel
    • Argentina
      • Pricing Analysis
      • Market Share Analysis, 2024
        • By Vehicle
        • By Propulsion
        • By End-Use
        • By Sales Channel
  19. Market Structure Analysis
    • Competition Dashboard
    • Competition Benchmarking
    • Market Share Analysis of Top Players
      • By Regional
      • By Vehicle
      • By Propulsion
      • By End-Use
      • By Sales Channel
  20. Competition Analysis
    • Competition Deep Dive
      • Toyota Motor
        • Overview
        • Product Portfolio
        • Profitability by Market Segments (Product/Age /Sales Channel/Region)
        • Sales Footprint
        • Strategy Overview
          • Marketing Strategy
          • Product Strategy
          • Channel Strategy
      • Volkswagen Group
        • Overview
        • Product Portfolio
        • Profitability by Market Segments (Product/Age /Sales Channel/Region)
        • Sales Footprint
        • Strategy Overview
          • Marketing Strategy
          • Product Strategy
          • Channel Strategy
      • Hyundai Motor Group
        • Overview
        • Product Portfolio
        • Profitability by Market Segments (Product/Age /Sales Channel/Region)
        • Sales Footprint
        • Strategy Overview
          • Marketing Strategy
          • Product Strategy
          • Channel Strategy
      • General Motors
        • Overview
        • Product Portfolio
        • Profitability by Market Segments (Product/Age /Sales Channel/Region)
        • Sales Footprint
        • Strategy Overview
          • Marketing Strategy
          • Product Strategy
          • Channel Strategy
      • Ford Motor
        • Overview
        • Product Portfolio
        • Profitability by Market Segments (Product/Age /Sales Channel/Region)
        • Sales Footprint
        • Strategy Overview
          • Marketing Strategy
          • Product Strategy
          • Channel Strategy
      • Honda Motor
        • Overview
        • Product Portfolio
        • Profitability by Market Segments (Product/Age /Sales Channel/Region)
        • Sales Footprint
        • Strategy Overview
          • Marketing Strategy
          • Product Strategy
          • Channel Strategy
      • Tesla
        • Overview
        • Product Portfolio
        • Profitability by Market Segments (Product/Age /Sales Channel/Region)
        • Sales Footprint
        • Strategy Overview
          • Marketing Strategy
          • Product Strategy
          • Channel Strategy
      • Suzuki Motor
        • Overview
        • Product Portfolio
        • Profitability by Market Segments (Product/Age /Sales Channel/Region)
        • Sales Footprint
        • Strategy Overview
          • Marketing Strategy
          • Product Strategy
          • Channel Strategy
      • BMW Group
        • Overview
        • Product Portfolio
        • Profitability by Market Segments (Product/Age /Sales Channel/Region)
        • Sales Footprint
        • Strategy Overview
          • Marketing Strategy
          • Product Strategy
          • Channel Strategy
      • Tata Motors
        • Overview
        • Product Portfolio
        • Profitability by Market Segments (Product/Age /Sales Channel/Region)
        • Sales Footprint
        • Strategy Overview
          • Marketing Strategy
          • Product Strategy
          • Channel Strategy
  21. Assumptions & Acronyms Used
  22. Research Methodology

List of Tables

  • Table 1: Global Market Value (USD Trillion) Forecast by Region, 2020-2035
  • Table 2: Global Market Volume (Units) Forecast by Region, 2020-2035
  • Table 3: Global Market Value (USD Trillion) Forecast by Vehicle, 2020-2035
  • Table 4: Global Market Volume (Units) Forecast by Vehicle, 2020-2035
  • Table 5: Global Market Value (USD Trillion) Forecast by Propulsion, 2020-2035
  • Table 6: Global Market Volume (Units) Forecast by Propulsion, 2020-2035
  • Table 7: Global Market Value (USD Trillion) Forecast by End-Use, 2020-2035
  • Table 8: Global Market Volume (Units) Forecast by End-Use, 2020-2035
  • Table 9: Global Market Value (USD Trillion) Forecast by Sales Channel, 2020-2035
  • Table 10: Global Market Volume (Units) Forecast by Sales Channel, 2020-2035
  • Table 11: North America Market Value (USD Trillion) Forecast by Country, 2020-2035
  • Table 12: North America Market Volume (Units) Forecast by Country, 2020-2035
  • Table 13: North America Market Value (USD Trillion) Forecast by Vehicle, 2020-2035
  • Table 14: North America Market Volume (Units) Forecast by Vehicle, 2020-2035
  • Table 15: North America Market Value (USD Trillion) Forecast by Propulsion, 2020-2035
  • Table 16: North America Market Volume (Units) Forecast by Propulsion, 2020-2035
  • Table 17: North America Market Value (USD Trillion) Forecast by End-Use, 2020-2035
  • Table 18: North America Market Volume (Units) Forecast by End-Use, 2020-2035
  • Table 19: North America Market Value (USD Trillion) Forecast by Sales Channel, 2020-2035
  • Table 20: North America Market Volume (Units) Forecast by Sales Channel, 2020-2035
  • Table 21: Latin America Market Value (USD Trillion) Forecast by Country, 2020-2035
  • Table 22: Latin America Market Volume (Units) Forecast by Country, 2020-2035
  • Table 23: Latin America Market Value (USD Trillion) Forecast by Vehicle, 2020-2035
  • Table 24: Latin America Market Volume (Units) Forecast by Vehicle, 2020-2035
  • Table 25: Latin America Market Value (USD Trillion) Forecast by Propulsion, 2020-2035
  • Table 26: Latin America Market Volume (Units) Forecast by Propulsion, 2020-2035
  • Table 27: Latin America Market Value (USD Trillion) Forecast by End-Use, 2020-2035
  • Table 28: Latin America Market Volume (Units) Forecast by End-Use, 2020-2035
  • Table 29: Latin America Market Value (USD Trillion) Forecast by Sales Channel, 2020-2035
  • Table 30: Latin America Market Volume (Units) Forecast by Sales Channel, 2020-2035
  • Table 31: Western Europe Market Value (USD Trillion) Forecast by Country, 2020-2035
  • Table 32: Western Europe Market Volume (Units) Forecast by Country, 2020-2035
  • Table 33: Western Europe Market Value (USD Trillion) Forecast by Vehicle, 2020-2035
  • Table 34: Western Europe Market Volume (Units) Forecast by Vehicle, 2020-2035
  • Table 35: Western Europe Market Value (USD Trillion) Forecast by Propulsion, 2020-2035
  • Table 36: Western Europe Market Volume (Units) Forecast by Propulsion, 2020-2035
  • Table 37: Western Europe Market Value (USD Trillion) Forecast by End-Use, 2020-2035
  • Table 38: Western Europe Market Volume (Units) Forecast by End-Use, 2020-2035
  • Table 39: Western Europe Market Value (USD Trillion) Forecast by Sales Channel, 2020-2035
  • Table 40: Western Europe Market Volume (Units) Forecast by Sales Channel, 2020-2035
  • Table 41: Eastern Europe Market Value (USD Trillion) Forecast by Country, 2020-2035
  • Table 42: Eastern Europe Market Volume (Units) Forecast by Country, 2020-2035
  • Table 43: Eastern Europe Market Value (USD Trillion) Forecast by Vehicle, 2020-2035
  • Table 44: Eastern Europe Market Volume (Units) Forecast by Vehicle, 2020-2035
  • Table 45: Eastern Europe Market Value (USD Trillion) Forecast by Propulsion, 2020-2035
  • Table 46: Eastern Europe Market Volume (Units) Forecast by Propulsion, 2020-2035
  • Table 47: Eastern Europe Market Value (USD Trillion) Forecast by End-Use, 2020-2035
  • Table 48: Eastern Europe Market Volume (Units) Forecast by End-Use, 2020-2035
  • Table 49: Eastern Europe Market Value (USD Trillion) Forecast by Sales Channel, 2020-2035
  • Table 50: Eastern Europe Market Volume (Units) Forecast by Sales Channel, 2020-2035
  • Table 51: East Asia Market Value (USD Trillion) Forecast by Country, 2020-2035
  • Table 52: East Asia Market Volume (Units) Forecast by Country, 2020-2035
  • Table 53: East Asia Market Value (USD Trillion) Forecast by Vehicle, 2020-2035
  • Table 54: East Asia Market Volume (Units) Forecast by Vehicle, 2020-2035
  • Table 55: East Asia Market Value (USD Trillion) Forecast by Propulsion, 2020-2035
  • Table 56: East Asia Market Volume (Units) Forecast by Propulsion, 2020-2035
  • Table 57: East Asia Market Value (USD Trillion) Forecast by End-Use, 2020-2035
  • Table 58: East Asia Market Volume (Units) Forecast by End-Use, 2020-2035
  • Table 59: East Asia Market Value (USD Trillion) Forecast by Sales Channel, 2020-2035
  • Table 60: East Asia Market Volume (Units) Forecast by Sales Channel, 2020-2035
  • Table 61: South Asia & Pacific Market Value (USD Trillion) Forecast by Country, 2020-2035
  • Table 62: South Asia & Pacific Market Volume (Units) Forecast by Country, 2020-2035
  • Table 63: South Asia & Pacific Market Value (USD Trillion) Forecast by Vehicle, 2020-2035
  • Table 64: South Asia & Pacific Market Volume (Units) Forecast by Vehicle, 2020-2035
  • Table 65: South Asia & Pacific Market Value (USD Trillion) Forecast by Propulsion, 2020-2035
  • Table 66: South Asia & Pacific Market Volume (Units) Forecast by Propulsion, 2020-2035
  • Table 67: South Asia & Pacific Market Value (USD Trillion) Forecast by End-Use, 2020-2035
  • Table 68: South Asia & Pacific Market Volume (Units) Forecast by End-Use, 2020-2035
  • Table 69: South Asia & Pacific Market Value (USD Trillion) Forecast by Sales Channel, 2020-2035
  • Table 70: South Asia & Pacific Market Volume (Units) Forecast by Sales Channel, 2020-2035
  • Table 71: Middle East and Africa Market Value (USD Trillion) Forecast by Country, 2020-2035
  • Table 72: Middle East and Africa Market Volume (Units) Forecast by Country, 2020-2035
  • Table 73: Middle East and Africa Market Value (USD Trillion) Forecast by Vehicle, 2020-2035
  • Table 74: Middle East and Africa Market Volume (Units) Forecast by Vehicle, 2020-2035
  • Table 75: Middle East and Africa Market Value (USD Trillion) Forecast by Propulsion, 2020-2035
  • Table 76: Middle East and Africa Market Volume (Units) Forecast by Propulsion, 2020-2035
  • Table 77: Middle East and Africa Market Value (USD Trillion) Forecast by End-Use, 2020-2035
  • Table 78: Middle East and Africa Market Volume (Units) Forecast by End-Use, 2020-2035
  • Table 79: Middle East and Africa Market Value (USD Trillion) Forecast by Sales Channel, 2020-2035
  • Table 80: Middle East and Africa Market Volume (Units) Forecast by Sales Channel, 2020-2035

List of Figures

  • Figure 1: Global Market Volume (Units) Forecast 2020-2035
  • Figure 2: Global Market Pricing Analysis
  • Figure 3: Global Market Value (USD Trillion) Forecast 2020-2035
  • Figure 4: Global Market Value Share and BPS Analysis by Vehicle, 2025 and 2035
  • Figure 5: Global Market Y-o-Y Growth Comparison by Vehicle, 2025-2035
  • Figure 6: Global Market Attractiveness Analysis by Vehicle
  • Figure 7: Global Market Value Share and BPS Analysis by Propulsion, 2025 and 2035
  • Figure 8: Global Market Y-o-Y Growth Comparison by Propulsion, 2025-2035
  • Figure 9: Global Market Attractiveness Analysis by Propulsion
  • Figure 10: Global Market Value Share and BPS Analysis by End-Use, 2025 and 2035
  • Figure 11: Global Market Y-o-Y Growth Comparison by End-Use, 2025-2035
  • Figure 12: Global Market Attractiveness Analysis by End-Use
  • Figure 13: Global Market Value Share and BPS Analysis by Sales Channel, 2025 and 2035
  • Figure 14: Global Market Y-o-Y Growth Comparison by Sales Channel, 2025-2035
  • Figure 15: Global Market Attractiveness Analysis by Sales Channel
  • Figure 16: Global Market Value (USD Trillion) Share and BPS Analysis by Region, 2025 and 2035
  • Figure 17: Global Market Y-o-Y Growth Comparison by Region, 2025-2035
  • Figure 18: Global Market Attractiveness Analysis by Region
  • Figure 19: North America Market Incremental $ Opportunity, 2025-2035
  • Figure 20: Latin America Market Incremental $ Opportunity, 2025-2035
  • Figure 21: Western Europe Market Incremental $ Opportunity, 2025-2035
  • Figure 22: Eastern Europe Market Incremental $ Opportunity, 2025-2035
  • Figure 23: East Asia Market Incremental $ Opportunity, 2025-2035
  • Figure 24: South Asia & Pacific Market Incremental $ Opportunity, 2025-2035
  • Figure 25: Middle East and Africa Market Incremental $ Opportunity, 2025-2035
  • Figure 26: North America Market Value Share and BPS Analysis by Country, 2025 and 2035
  • Figure 27: North America Market Value Share and BPS Analysis by Vehicle, 2025 and 2035
  • Figure 28: North America Market Y-o-Y Growth Comparison by Vehicle, 2025-2035
  • Figure 29: North America Market Attractiveness Analysis by Vehicle
  • Figure 30: North America Market Value Share and BPS Analysis by Propulsion, 2025 and 2035
  • Figure 31: North America Market Y-o-Y Growth Comparison by Propulsion, 2025-2035
  • Figure 32: North America Market Attractiveness Analysis by Propulsion
  • Figure 33: North America Market Value Share and BPS Analysis by End-Use, 2025 and 2035
  • Figure 34: North America Market Y-o-Y Growth Comparison by End-Use, 2025-2035
  • Figure 35: North America Market Attractiveness Analysis by End-Use
  • Figure 36: North America Market Value Share and BPS Analysis by Sales Channel, 2025 and 2035
  • Figure 37: North America Market Y-o-Y Growth Comparison by Sales Channel, 2025-2035
  • Figure 38: North America Market Attractiveness Analysis by Sales Channel
  • Figure 39: Latin America Market Value Share and BPS Analysis by Country, 2025 and 2035
  • Figure 40: Latin America Market Value Share and BPS Analysis by Vehicle, 2025 and 2035
  • Figure 41: Latin America Market Y-o-Y Growth Comparison by Vehicle, 2025-2035
  • Figure 42: Latin America Market Attractiveness Analysis by Vehicle
  • Figure 43: Latin America Market Value Share and BPS Analysis by Propulsion, 2025 and 2035
  • Figure 44: Latin America Market Y-o-Y Growth Comparison by Propulsion, 2025-2035
  • Figure 45: Latin America Market Attractiveness Analysis by Propulsion
  • Figure 46: Latin America Market Value Share and BPS Analysis by End-Use, 2025 and 2035
  • Figure 47: Latin America Market Y-o-Y Growth Comparison by End-Use, 2025-2035
  • Figure 48: Latin America Market Attractiveness Analysis by End-Use
  • Figure 49: Latin America Market Value Share and BPS Analysis by Sales Channel, 2025 and 2035
  • Figure 50: Latin America Market Y-o-Y Growth Comparison by Sales Channel, 2025-2035
  • Figure 51: Latin America Market Attractiveness Analysis by Sales Channel
  • Figure 52: Western Europe Market Value Share and BPS Analysis by Country, 2025 and 2035
  • Figure 53: Western Europe Market Value Share and BPS Analysis by Vehicle, 2025 and 2035
  • Figure 54: Western Europe Market Y-o-Y Growth Comparison by Vehicle, 2025-2035
  • Figure 55: Western Europe Market Attractiveness Analysis by Vehicle
  • Figure 56: Western Europe Market Value Share and BPS Analysis by Propulsion, 2025 and 2035
  • Figure 57: Western Europe Market Y-o-Y Growth Comparison by Propulsion, 2025-2035
  • Figure 58: Western Europe Market Attractiveness Analysis by Propulsion
  • Figure 59: Western Europe Market Value Share and BPS Analysis by End-Use, 2025 and 2035
  • Figure 60: Western Europe Market Y-o-Y Growth Comparison by End-Use, 2025-2035
  • Figure 61: Western Europe Market Attractiveness Analysis by End-Use
  • Figure 62: Western Europe Market Value Share and BPS Analysis by Sales Channel, 2025 and 2035
  • Figure 63: Western Europe Market Y-o-Y Growth Comparison by Sales Channel, 2025-2035
  • Figure 64: Western Europe Market Attractiveness Analysis by Sales Channel
  • Figure 65: Eastern Europe Market Value Share and BPS Analysis by Country, 2025 and 2035
  • Figure 66: Eastern Europe Market Value Share and BPS Analysis by Vehicle, 2025 and 2035
  • Figure 67: Eastern Europe Market Y-o-Y Growth Comparison by Vehicle, 2025-2035
  • Figure 68: Eastern Europe Market Attractiveness Analysis by Vehicle
  • Figure 69: Eastern Europe Market Value Share and BPS Analysis by Propulsion, 2025 and 2035
  • Figure 70: Eastern Europe Market Y-o-Y Growth Comparison by Propulsion, 2025-2035
  • Figure 71: Eastern Europe Market Attractiveness Analysis by Propulsion
  • Figure 72: Eastern Europe Market Value Share and BPS Analysis by End-Use, 2025 and 2035
  • Figure 73: Eastern Europe Market Y-o-Y Growth Comparison by End-Use, 2025-2035
  • Figure 74: Eastern Europe Market Attractiveness Analysis by End-Use
  • Figure 75: Eastern Europe Market Value Share and BPS Analysis by Sales Channel, 2025 and 2035
  • Figure 76: Eastern Europe Market Y-o-Y Growth Comparison by Sales Channel, 2025-2035
  • Figure 77: Eastern Europe Market Attractiveness Analysis by Sales Channel
  • Figure 78: East Asia Market Value Share and BPS Analysis by Country, 2025 and 2035
  • Figure 79: East Asia Market Value Share and BPS Analysis by Vehicle, 2025 and 2035
  • Figure 80: East Asia Market Y-o-Y Growth Comparison by Vehicle, 2025-2035
  • Figure 81: East Asia Market Attractiveness Analysis by Vehicle
  • Figure 82: East Asia Market Value Share and BPS Analysis by Propulsion, 2025 and 2035
  • Figure 83: East Asia Market Y-o-Y Growth Comparison by Propulsion, 2025-2035
  • Figure 84: East Asia Market Attractiveness Analysis by Propulsion
  • Figure 85: East Asia Market Value Share and BPS Analysis by End-Use, 2025 and 2035
  • Figure 86: East Asia Market Y-o-Y Growth Comparison by End-Use, 2025-2035
  • Figure 87: East Asia Market Attractiveness Analysis by End-Use
  • Figure 88: East Asia Market Value Share and BPS Analysis by Sales Channel, 2025 and 2035
  • Figure 89: East Asia Market Y-o-Y Growth Comparison by Sales Channel, 2025-2035
  • Figure 90: East Asia Market Attractiveness Analysis by Sales Channel
  • Figure 91: South Asia & Pacific Market Value Share and BPS Analysis by Country, 2025 and 2035
  • Figure 92: South Asia & Pacific Market Value Share and BPS Analysis by Vehicle, 2025 and 2035
  • Figure 93: South Asia & Pacific Market Y-o-Y Growth Comparison by Vehicle, 2025-2035
  • Figure 94: South Asia & Pacific Market Attractiveness Analysis by Vehicle
  • Figure 95: South Asia & Pacific Market Value Share and BPS Analysis by Propulsion, 2025 and 2035
  • Figure 96: South Asia & Pacific Market Y-o-Y Growth Comparison by Propulsion, 2025-2035
  • Figure 97: South Asia & Pacific Market Attractiveness Analysis by Propulsion
  • Figure 98: South Asia & Pacific Market Value Share and BPS Analysis by End-Use, 2025 and 2035
  • Figure 99: South Asia & Pacific Market Y-o-Y Growth Comparison by End-Use, 2025-2035
  • Figure 100: South Asia & Pacific Market Attractiveness Analysis by End-Use
  • Figure 101: South Asia & Pacific Market Value Share and BPS Analysis by Sales Channel, 2025 and 2035
  • Figure 102: South Asia & Pacific Market Y-o-Y Growth Comparison by Sales Channel, 2025-2035
  • Figure 103: South Asia & Pacific Market Attractiveness Analysis by Sales Channel
  • Figure 104: Middle East and Africa Market Value Share and BPS Analysis by Country, 2025 and 2035
  • Figure 105: Middle East and Africa Market Value Share and BPS Analysis by Vehicle, 2025 and 2035
  • Figure 106: Middle East and Africa Market Y-o-Y Growth Comparison by Vehicle, 2025-2035
  • Figure 107: Middle East and Africa Market Attractiveness Analysis by Vehicle
  • Figure 108: Middle East and Africa Market Value Share and BPS Analysis by Propulsion, 2025 and 2035
  • Figure 109: Middle East and Africa Market Y-o-Y Growth Comparison by Propulsion, 2025-2035
  • Figure 110: Middle East and Africa Market Attractiveness Analysis by Propulsion
  • Figure 111: Middle East and Africa Market Value Share and BPS Analysis by End-Use, 2025 and 2035
  • Figure 112: Middle East and Africa Market Y-o-Y Growth Comparison by End-Use, 2025-2035
  • Figure 113: Middle East and Africa Market Attractiveness Analysis by End-Use
  • Figure 114: Middle East and Africa Market Value Share and BPS Analysis by Sales Channel, 2025 and 2035
  • Figure 115: Middle East and Africa Market Y-o-Y Growth Comparison by Sales Channel, 2025-2035
  • Figure 116: Middle East and Africa Market Attractiveness Analysis by Sales Channel
  • Figure 117: Global Market - Tier Structure Analysis
  • Figure 118: Global Market - Company Share Analysis

Frequently Asked Questions

What is the projected size of the global car market by 2035?

The global car market is expected to reach USD 4.8 trillion by 2035, growing at a CAGR of 11.5%.

How much market share will electric cars hold in 2025?

Electric cars are projected to secure 26% of the global market share by 2025.

Which vehicle type will dominate the car market in 2025?

SUVs are forecasted to lead with a 38% share of the global car market in 2025.

What portion of car sales will franchised dealers contribute in 2025?

Franchised dealers are expected to account for 62% of total global car sales in 2025.

Which company is the top player in the global car market?

Toyota Motor is the leading player with a 13.7% share of the global car market.

Explore Similar Insights

Future Market Insights

Car Market