

- Market Size (2026)
- USD 3.60 Bn
- Forecast (2036)
- USD 12.01 Bn
- CAGR (2026 to 2036)
- 12.8%
Carbon-Neutral Interior Material Collections for OEMs Market Size, Market Forecast and Outlook By FMI
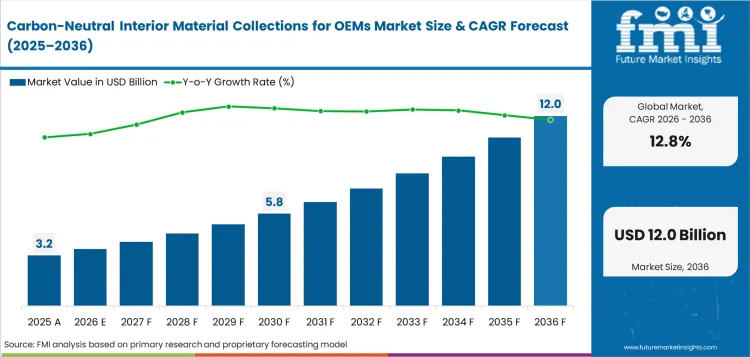
Carbon-neutral interior material collections for OEMs market was valued at USD 3.19 billion in 2025 and are projected to reach USD 3.60 billion in 2026. The market is forecast to reach USD 12.01 billion by 2036 at 12.8% CAGR. OEM line fit is projected to lead end-use demand with 68.0% share, while tier-one bundled supply is expected to hold 52.0% share by supply model in 2026.
Summary of the Carbon-Neutral Interior Material Collections for OEMs Market
- Market Snapshot
- The market is valued at USD 3.60 billion in 2026 and is forecast to reach USD 12.01 billion by 2036.
- Forecast expansion is supported by OEM sourcing rules that now ask for product carbon footprint files beside part price.
- The 2026 valuation is based on interior plastics and seating foams. Textile trim, floor modules and low-carbon coating inputs were checked separately.
- The forecast assumes that carbon-neutral collections remain a production-qualified subset of the broader interior material pool.
- The estimate was reconciled against global vehicle output of 96.4 million units in 2025 as published by the International Organization of Motor Vehicle Manufacturers.
- Demand and Growth Drivers
- OEMs are moving low-carbon cabin materials into sourcing scorecards because vehicle life cycle emissions are now part of brand planning.
- European recycled content rules are creating a direct route for recycled polypropylene, polyethylene terephthalate, and polycarbonate in cabin parts.
- EV cabin refresh cycles are raising demand for lighter trim packs that can show lower material carbon without changing safety performance.
- Tier-one suppliers are bundling material data with engineering support because OEMs need one source for tests and traceability.
- Product and Segment View
- Recycled polymers are projected to account for 46.0% share in 2026 because they fit door panels, instrument panels, and hidden structures.
- Bio-based foams are expected to hold 21.0% share in 2026 because seating programs need lower-carbon cushioning without new assembly methods.
- Seat and trim sets are forecast to account for 34.0% application share in 2026 as trim covers and cushioning carry visible carbon claims.
- OEM line fit is projected to hold 68.0% end-use share in 2026 because low-carbon claims must be designed into new vehicle programs.
- Geography and Competitive Outlook
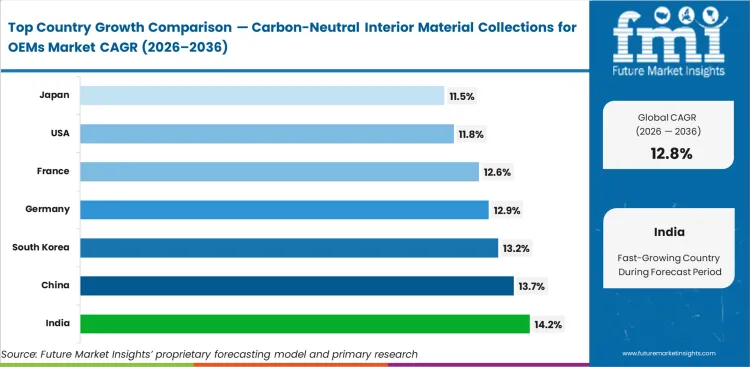
- China is projected at 13.7% CAGR through 2036 as EV scale and material sourcing depth make faster qualification possible.
- India is expected to post 14.2% CAGR through 2036 as export-focused assembly and local parts programs use lower-carbon inputs.
- FORVIA and Yanfeng shape the interior supply path. Autoneum and Adient support trim approvals. Dow and BASF support material routes.
- The competitive test is not a single material. OEMs will select suppliers that combine carbon data, part testing, and repeat feedstock supply.
- Analyst Opinion
- Nikhil Kaitwade, Principal Consultant at FMI says, “The next fight in vehicle interiors has moved beyond touch and cabin style. OEMs want proof that a trim set can cut product carbon and still pass heat, odor, abrasion, and safety tests. Suppliers with clear test data will win. They make recycled and bio-based content easier for engineering teams to approve across a full vehicle line.”
- Carbon-Neutral Interior Material Collections for OEMs Market Value Analysis
- The market is moving from concept cars into early production sourcing for seat trim, door panels, and floor systems.
- Carbon-neutral claims remain constrained by verification cost because each part needs product carbon footprint data.
- Recycled polymer content has the clearest scale route because polypropylene and polyethylene terephthalate already serve many interior parts.
- Bio-based foam and low-carbon coating demand will rise where OEMs can use existing assembly processes.
Key Takeaways, Market Size, and Forecast
- The carbon-neutral interior material collections for OEMs market was valued at USD 3.19 billion in 2025.
- By 2036, the carbon-neutral interior material collections for OEMs market is projected to reach USD 12.01 billion.
- From 2026 to 2036, the market is projected to expand at 12.8% CAGR.
- The market is projected to create an incremental opportunity of USD 8.41 billion between 2026 and 2036.
- OEM line fit is projected to account for 68.0% share of end-use demand in 2026.
- Tier-one bundled supply is expected to account for 52.0% share of supply model demand in 2026.
- India at 14.2% CAGR and China at 13.7% CAGR are among the countries with faster demand outlook.
Vehicle interiors are moving from material substitution to verified carbon evidence. Original equipment manufacturers now ask suppliers to show recycled content and product carbon footprint files. They also need odor evidence and end-of-life routes in one package. The International Organization of Motor Vehicle Manufacturers reported that global vehicle production rose from 92.7 million units in 2024 to 96.4 million units in 2025. That production base makes even small material swaps commercially meaningful. Impact-modified post-consumer recycled plastics are gaining attention because cabin plastics must pass appearance, smell, and heat testing before approval.
Regulation is moving in the same direction as OEM sourcing. The Council of the European Union adopted its position on the End-of-Life Vehicles Regulation in June 2025 with recycled plastic content targets of 15%, 20%, and 25% after entry into force. This gives interior suppliers a direct reason to prepare recycled polymer and mono-material collections. Bio-based collections also need evidence before final rule timing reaches model programs.
The value pool is concentrated in material sets that can be sold as collections rather than loose resins. A collection normally includes compound, trim, foam, adhesive, coating, and evidence files for product carbon footprint review. This structure gives Tier 1 suppliers more control over OEM approval since they can solve carbon and quality questions together. Supply evidence then supports the same approval file.
The International Energy Agency reported that electric car sales exceeded 20 million globally in 2025 and reached 25% of new car sales. Electric platforms are important since new cabins are redesigned around quietness and light weight. Brand separation then becomes part of the same sourcing choice. That makes EV programs a useful entry route for carbon-neutral interior material collections.
Carbon-Neutral Interior Material Collections for OEMs Market Definition
The carbon-neutral interior material collections for OEMs market covers verified low-carbon material sets supplied for vehicle cabin applications. Scope includes recycled polymer compounds, bio-based foams, natural fiber composites, low-carbon trim films, mono-material carpets, and product carbon footprint documentation. Revenue covers materials and collection-level supply contracts used in original equipment vehicle programs.
The market does not treat every recycled or bio-based material as carbon-neutral by default. A product enters scope only when the supplier provides carbon evidence through product carbon footprint calculation, mass balance certification, recycled content proof, or a comparable verification route. This keeps the definition tied to OEM decision needs rather than broad environmental language.
Carbon-Neutral Interior Material Collections for OEMs Market Inclusions
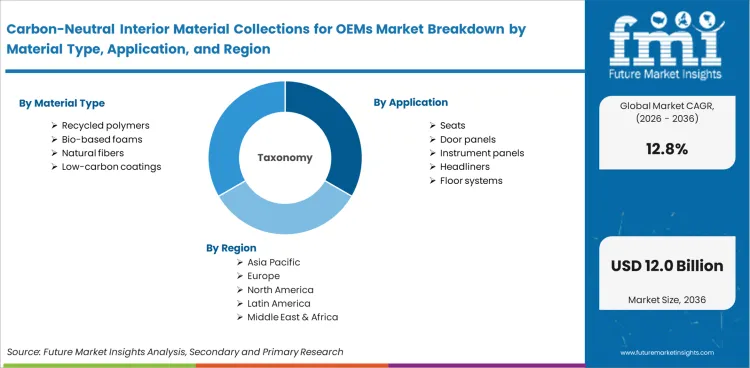
Market scope covers interior materials used by original equipment manufacturers in vehicle production. Material type includes recycled polymers, bio-based foams, natural fibers, and low-carbon coatings. Application includes seats, door panels, instrument panels, headliners, and floor systems. Vehicle program includes electric passenger vehicles, internal combustion passenger vehicles, premium programs, commercial vehicles, and robotaxi platforms. Supply model includes tier-one bundled supply, direct material supply, and joint development contracts. Certification model includes third-party life cycle assessment, mass balance certification, recycled content proof, and OEM internal validation. Processing route includes mechanical recycling, chemical recycling, bio-based feedstock, and mono-material design.
Carbon-Neutral Interior Material Collections for OEMs Market Exclusions
Scope excludes aftermarket seat covers, consumer accessories, and cabin parts sold only through retail channels. It also excludes raw recycled resin that has no vehicle interior qualification record. Carbon offset services are excluded unless they are tied directly to a verified interior material collection sold to an OEM program. Exterior plastics, battery housings, tires, glazing, and powertrain materials are excluded unless they are part of an interior collection contract. General automotive plastics are outside scope when the supplier does not provide product carbon evidence or interior part testing data.
Carbon-Neutral Interior Material Collections for OEMs Market Research Methodology
- Primary Research: FMI analysts reviewed OEM material specifications, Tier 1 supplier portfolios, compounder qualification steps, and carbon evidence needs in major vehicle producing countries.
- Desk Research: The study used public data from government institutions, trade bodies, official regulation pages, and direct company releases from active interior suppliers.
- Market sizing and forecasting: The market size was estimated through top-down checks from automotive interiors and bottom-up checks from recycled polymers, foams, textiles, and trim components.
- Data validation: Forecast checks compared vehicle output, electric vehicle program growth, recycled content regulation, company material launches, and supplier investment signals.
Why is the Carbon-Neutral Interior Material Collections for OEMs Market Growing?
- OEMs are asking interior suppliers to provide product carbon data before final material approval.
- Recycled plastic content rules are pushing cabin parts toward verified recycled polymers and mono-material formats.
- Electric vehicle programs allow faster interior material changes because many platforms are still moving through design cycles.
Carbon-neutral interior material collections are moving into sourcing discussions as OEM teams need carbon evidence at part level. The European Commission states that average carbon dioxide emissions from new passenger cars registered in Europe fell by 28% between 2019 and 2024. The same source reported zero-emission vehicles at 14.5% of new car registrations in 2024. Interior suppliers are now expected to support the same decarbonization story inside the cabin.
The limit is qualification time. Recycled plastics can show lower carbon than virgin resin. OEMs still test odor and fogging before approval. Color drift, scratch resistance and crash behavior remain separate gates. Suppliers that arrive with validated materials reduce the work for OEM engineering teams. This explains why collections carry more value than single material samples.
Market Segmentation Analysis
- Recycled polymers are projected to reach 46.0% share in 2026 because they fit high-volume molded cabin parts.
- Seat and trim sets are expected to represent 34.0% application share in 2026 as visible cabin surfaces carry brand value.
- Electric passenger vehicles are forecast to account for 39.0% vehicle program share in 2026 due to platform refresh timing.
- Third-party life cycle assessment is projected to capture 41.0% in 2026 as OEMs seek audit-ready data.
- Tier-one bundled supply is expected to hold 52.0% supply model share in 2026 because OEMs prefer tested part-level packages.
- Mechanical recycling is estimated to account for 44.0% in 2026 as it offers scale for polypropylene and polyester.
The market is divided into six primary segment groups based on material type, application, vehicle program, certification model, supply model, and processing route. These groups reflect how OEMs specify interior parts. They also show how suppliers package carbon evidence with part performance.
Insights into the Recycled Polymers Material Type Segment
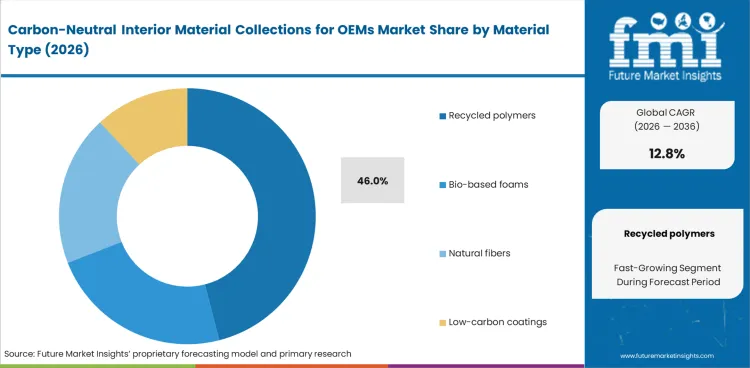
- Recycled polymers are projected to account for 46.0% share of material type demand in 2026. The share reflects the use of polypropylene/polyethylene terephthalate and polycarbonate in cabin parts.
- Recycled content is easiest to place in hidden structures first. Visible parts need tighter color and odor control. This creates a two-speed approval route for recycled polymer suppliers.
Insights into the Seat and Trim Sets Application Segment
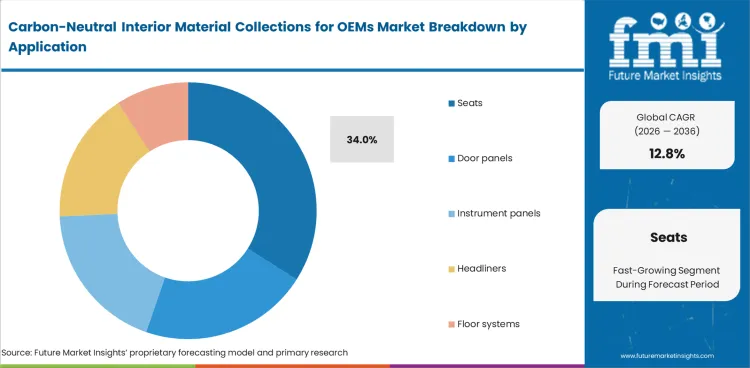
- Seat and trim sets are expected to represent 34.0% application demand in 2026. Seating surfaces, door inserts, and console trim are visible to consumers and can carry verified carbon claims. Rising demand for automotive fabric supports this outlook because textile-backed interior surfaces remain a high-value cabin material group.
- Foam and trim must be approved together in many seat programs. This makes bundled material collections more useful than one resin substitution. Suppliers win when the cushion, cover, adhesive, and carbon file are ready together.
Insights into the Electric Passenger Vehicles Program Segment
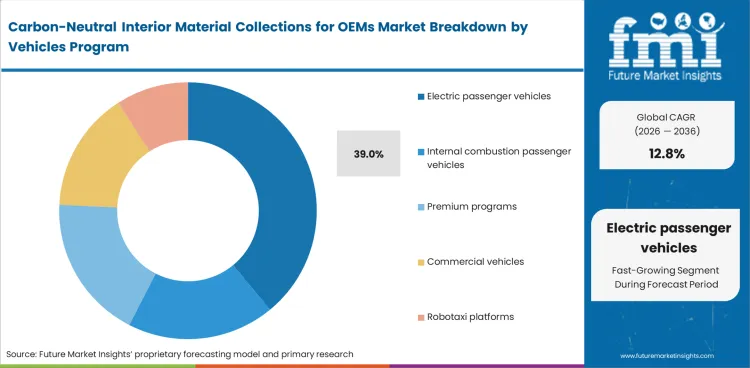
- Electric passenger vehicles are forecast to account for 39.0% in 2026. EV interiors use quiet cabin design and brand-specific surfaces to separate models. The automotive seating outlook suggests that that seat systems are one of the significant interior value pools.
- Electric platforms are not automatically low-carbon inside the cabin. OEMs must decide which material changes can pass test gates without creating new warranty risks. This slows change but raises value for pre-qualified collections.
Insights into the Third-Party LCA Certification Segment
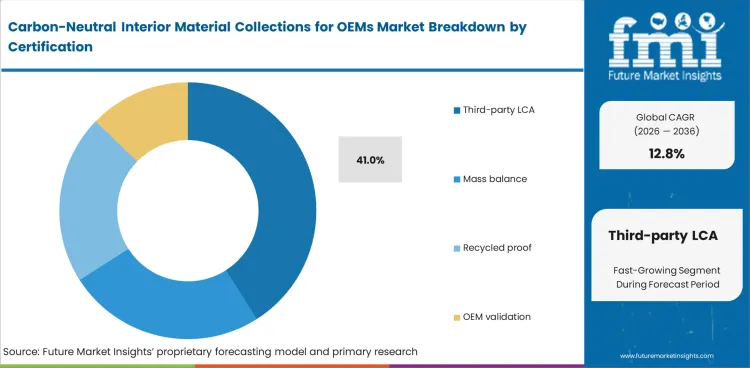
- Third-party life cycle assessment is projected to account for 41.0% in 2026. OEMs need carbon evidence that can stand inside internal reporting and external claims review. Regulation (EU) 2024/1781 also places more attention on product-level information and digital product evidence.
- Mass balance certification is expected to remain useful for foams and coatings. Recycled content proof will be stronger for polymers with clear physical feedstock routes. This makes certification choice a commercial decision as much as a technical one.
Insights into the Tier-One Bundled Supply Segment
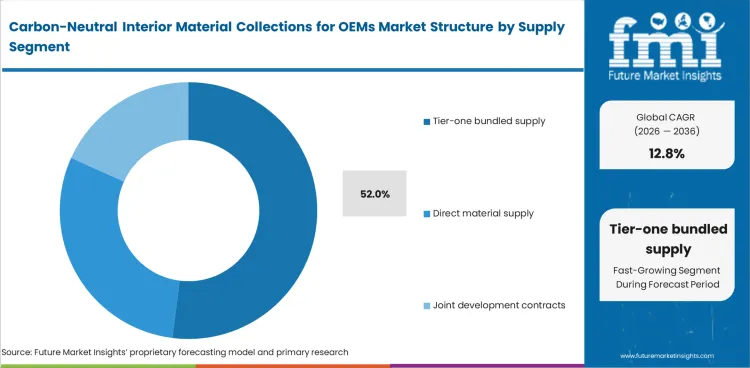
- Tier-one bundled supply is expected to account for 52.0% of supply model demand in 2026. OEMs prefer fewer approval paths when cabin material changes affect touch and safety. Smell and product carbon data add separate approval checks. The interior plastic components adoption supports the need for part-level integration.
- Material firms are important because they control resin and additive chemistry. Tier 1 suppliers convert those inputs into complete parts. The most useful collections will come from close work between both groups.
Insights into the Mechanical Recycling Processing Route Segment
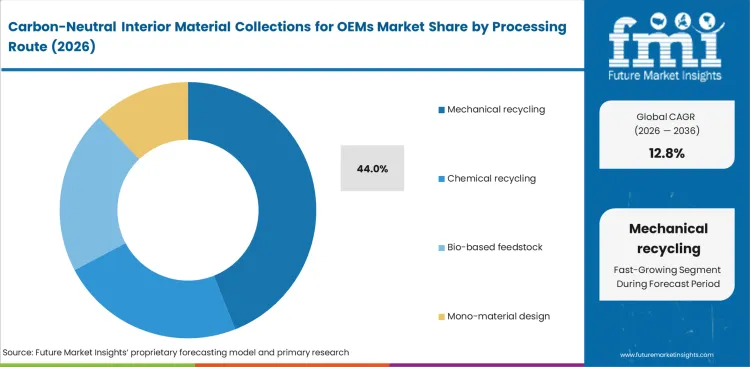
- Mechanical recycling is estimated to account for 44.0% processing route demand in 2026. It fits polypropylene and some polycarbonate routes where feedstock is clean enough for cabin specifications. The automotive plastic outlook helps show why polymer route decisions affect cabin material economics.
- Chemical recycling is likely to expand where closed-loop waste streams remain uneven. Bio-based feedstock will gain share in foams and coatings because it can reduce fossil inputs without changing factory processes.
Carbon-Neutral Interior Material Collections for OEMs Market Drivers, Restraints, and Opportunities
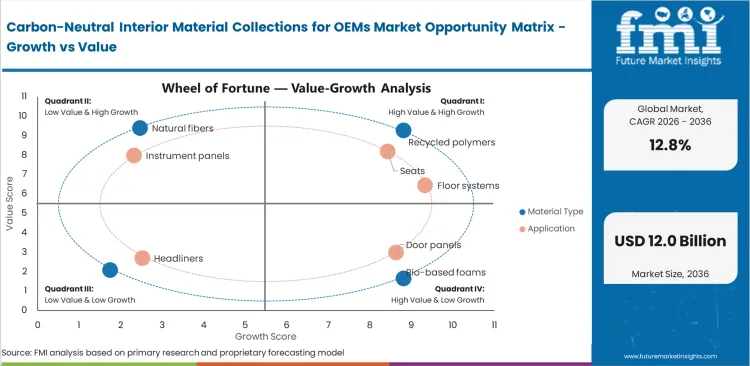
- OEM carbon scorecards are pulling product carbon footprint files into interior material approval.
- Feedstock variability is slowing recycled material approval because cabin parts must meet odor and color rules.
- Mono-material trim creates opportunity as future vehicle recycling rules reward easier material separation.
OEM carbon scorecards are becoming part of normal sourcing. The International Energy Agency reported that Europe sold 4.2 million electric cars in 2025. New electric platforms give automakers a natural point to approve low-carbon seat, trim, and floor packages. Suppliers that can serve EV and internal combustion programs with the same material family will reduce approval friction.
Feedstock Quality Limits Approval
The main restraint is input variation. Recycled polymer streams differ by source, color, additive history, and contamination level. Cabin parts expose these differences more clearly because odor, fogging, and surface appearance are tested closely. OEMs will not accept recycled content that creates quality risk after vehicle launch.
Mono-Material Trim Adds Value
An untapped opportunity for companies is present in mono-material and collection-based design. The Council of the European Union position on End-of-Life Vehicles proposes recycled plastic content targets that rise to 25% by the tenth year after entry into force. This encourages suppliers to design trim parts that are easier to separate, document, and reuse.
Bio-Based Foams Protect Process Fit
Bio-based and mass-balanced foams create another route since they can cut fossil input without changing seat production. BASF introduced biomass balance flexible polyurethane foam systems in March 2025 with potential product carbon footprint cuts up to 75% versus conventional systems. That type of drop-in route is useful when OEMs want lower carbon without seat redesign.
Analysis of Carbon-Neutral Interior Material Collections for OEMs Market by Key Countries
.webp "Top Country Growth Comparison Carbon Neutral Interior Material Collections For Oems Market Cagr (2026 2036)")
| Country | CAGR |
|---|---|
| United States | 11.8% |
| China | 13.7% |
| India | 14.2% |
| Germany | 12.9% |
| Japan | 11.5% |
| South Korea | 13.2% |
| France | 12.6% |
Source: Future Market Insights, 2026.
Carbon-Neutral Interior Material Collections for OEMs Market CAGR Analysis by Country
- India is expected to post 14.2% CAGR by 2036 as vehicle output and export programs widen local material approval needs.
- China is projected to record 13.7% CAGR by 2036 because EV scale and local polymer supply shorten qualification cycles.
- South Korea is expected to expand at 13.2% CAGR by 2036 as Hyundai, Kia, and battery-linked suppliers push cabin material redesign.
- Germany is expected to advance at 12.9% CAGR by 2036 because premium EV production increases demand for traceable interior inputs.
- The United States and Japan remain large but more measured markets, with 11.8% CAGR and 11.5% CAGR based on approval discipline.
Demand for carbon-neutral interior material collections is forecast to rise at 12.8% CAGR from 2026 to 2036. Country-level analysis covers the vehicle production hubs where OEM material approvals, EV platform cycles, and circular material rules matter most.
Demand Outlook for Carbon-Neutral Interior Material Collections for OEMs in the United States
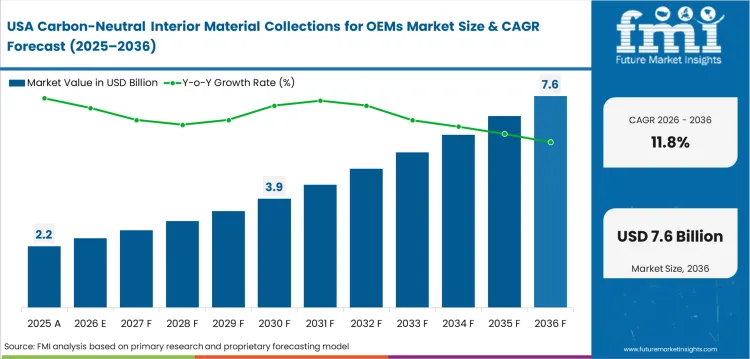
The United States has a large installed interior supply base and a more selective path for carbon-neutral material approvals. The United States is projected to record 11.8% CAGR through 2036, driven by EV programs and seating supplier carbon targets. The International Energy Agency reported around 1.5 million electric car sales in the United States in 2025. Suppliers must prove carbon value without adding cost risk to high-volume pickup and SUV programs.
- Michigan seating and trim plants will remain the first approval route for recycled foam and low-carbon cover materials.
- Tennessee and Kentucky assembly corridors need qualified materials that can support EV and internal combustion platforms together.
- California design teams will use cabin carbon claims in premium EV programs, but final approval will depend on test data.
Sales Analysis of Carbon-Neutral Interior Material Collections for OEMs in China
Chinese OEMs make material decisions through shorter model cycles than many Western manufacturers. China is expected to expand at 13.7% CAGR through 2036, supported by EV scale and local polymer compounding. The International Energy Agency reported more than 13 million electric car sales in China during 2025. Material collections that fit domestic EV launches can move from sample to program approval in China as compared to other countries with moderate growth.
- Shanghai and Jiangsu suppliers can combine recycled polymer compounding with large cabin component programs.
- Guangdong EV producers can test lower-carbon soft trim and molded parts across frequent model refreshes.
- Chongqing and Anhui plants give material firms access to rising EV and export-focused vehicle output.
Demand Outlook for Carbon-Neutral Interior Material Collections for OEMs in India
India is building a broader vehicle export base that needs cleaner material documentation for Europe and North America. The automobile sector contributes about 6% to India’s national gross domestic product according to the Press Information Bureau in March 2025. India is forecast to grow at 14.2% CAGR through 2036, driven by local sourcing and export-linked material needs.
- Gujarat and Maharashtra assembly corridors need recycled plastics that meet export program documentation needs.
- Tamil Nadu suppliers can support seat trim and floor systems for passenger cars and electric two-wheeler adjacent supply chains.
- National auto parts clusters will need simple product carbon files before low-carbon materials can scale beyond pilot programs.
Opportunity Analysis of Carbon-Neutral Interior Material Collections for OEMs in Germany
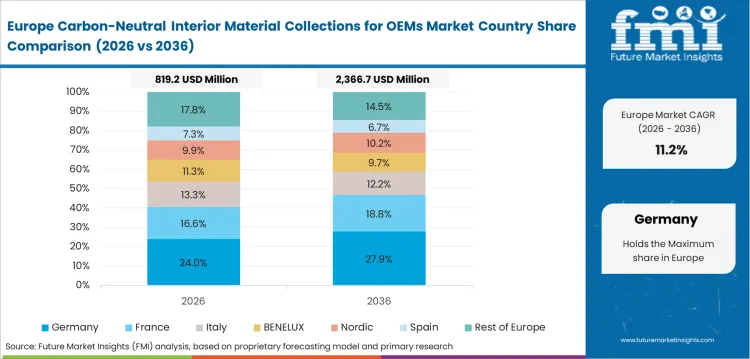
Germany is using premium vehicle engineering to pull low-carbon interiors into higher-value programs. German electric passenger car production reached 1.67 million units in 2025 according to Verband der Automobilindustrie data cited by Germany Trade and Invest. Germany is expected to advance at 12.9% CAGR through 2036, supported by EV production depth and strict material testing.
- Bavaria and Baden-Wurttemberg can use low-carbon leather alternatives and recycled textiles in premium EV cabins.
- Saxony EV plants need molded trim and acoustic materials that can pass German validation cycles.
- German Tier 1 suppliers can export qualified material collections to European and North American OEM programs.
Future Outlook for Carbon-Neutral Interior Material Collections for OEMs in Japan
Japanese OEMs usually approve new interior materials through a careful performance-first process. Japan is projected to rise at 11.5% CAGR through 2036, driven by hybrid platforms and export model requirements. Japan Automobile Manufacturers Association members reported long-running efforts to cut plant waste and improve recycling in the Motor Industry of Japan 2025 review. Suppliers must show stable quality before carbon-neutral claims influence sourcing decisions.
- Aichi-based OEM programs will use low-carbon materials only after long-cycle durability and smell testing.
- Kyushu production sites can use recycled textiles and foams where export program rules require carbon data.
- Toyota Boshoku and other interior specialists create a route for plant-derived and recyclable designs.
Sales Analysis of Carbon-Neutral Interior Material Collections for OEMs in South Korea
South Korea links cabin material demand with EV platform launches and strong local Tier 1 engineering. South Korea is forecast at 13.2% CAGR through 2036, driven by Hyundai and Kia platform refresh cycles. The International Energy Agency reported that electric car sales exceeded 20 million globally in 2025. Korean suppliers can use this electric platform shift to test lighter trim and recycled plastics
- Ulsan and Hwaseong vehicle programs create repeat demand for qualified trim materials across export models.
- Korean battery and electronics supply depth supports cabin programs with tighter traceability and material documentation.
- Suppliers that serve Hyundai and Kia globally can extend approved collections into United States and European plants.
Future Outlook for Carbon-Neutral Interior Material Collections for OEMs in France
France has a direct connection between OEM design, supplier material development, and European circularity rules. The Renault Embleme demonstrator targeted 90% lower life cycle greenhouse gas emissions than a comparable vehicle produced. France is expected to post 12.6% CAGR through 2036, supported by presence of large manufacturers and European recycled-content rules.
- Paris-area design teams can use low-carbon cabin demonstrators to move supplier concepts toward sourcing discussions.
- French OEM programs can test ocean-bound plastic compounds, mono-material carpets, and recycled trim systems together.
- Local supplier links help carbon-neutral collections become full cabin packages rather than isolated material claims.
Competitive Landscape and Strategic Positioning
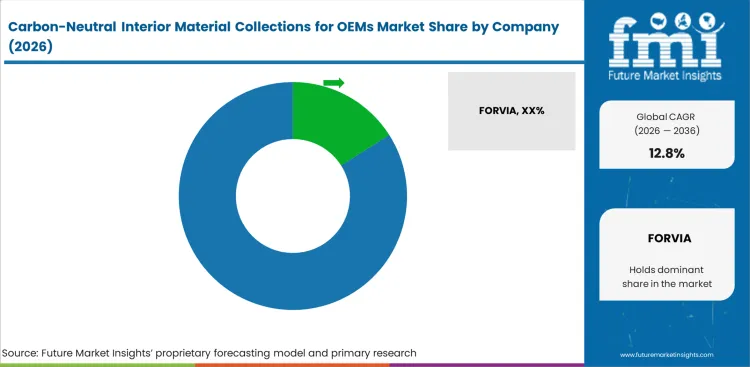
- The market is concentrated around Tier 1 suppliers that can translate material chemistry into production-ready cabin parts.
- Material firms such as Dow, BASF, Covestro, Borealis, and Trinseo shape the chemistry routes behind lower-carbon interiors.
- Interior specialists such as FORVIA, Yanfeng, Autoneum, Lear, and Adient influence approval because they own part design.
- Entry barriers include odor control and abrasion testing. Traceable feedstock, product carbon footprint evidence and OEM validation history add further gates.
The competitive landscape is concentrated among Tier 1 interior system suppliers and material companies that can combine low‑carbon chemistry with part‑level validation and carbon evidence. For instance, players such as FORVIA have moved through its MATERI’ACT unit to build low-carbon compounds, foils, and trim materials. The company introduced a cockpit concept in April 2024 that used ocean-bound plastics in four door panels and one instrument panel. The concept is important since OEMs need proof that recycled feedstock can work in visible cabin parts.
Material companies are moving from broad climate goals to automotive-grade feedstock routes. Covestro introduced 50% recycled content polycarbonate grades from end-of-life headlamps in April 2025. BASF expanded biomass-balanced products in May 2025 and reported around 8 million kilograms of carbon dioxide reduction for these products in 2024. These launches show why chemistry suppliers remain central to OEM interior collections.
Key Companies in the Carbon-Neutral Interior Material Collections for OEMs Market
Competition is best understood by role because part suppliers, polymer producers, foam makers, and trim specialists solve different approval problems.
- Interior System Leaders: FORVIA, Yanfeng, Lear, Adient, Autoneum, and Toyota Boshoku hold strong positions because they connect materials with complete cabin parts.
- Material Chemistry Providers: Dow, BASF, Covestro, Borealis, Trinseo, and Asahi Kasei support recycled polymer, foam, coating, and mass balance routes.
- Textile and Trim Specialists: Sage Automotive Interiors, Aunde Group, and Seiren support surface appearance, low-odor textiles, recycled yarns, and color consistency.
Competitive Benchmarking: Carbon-Neutral Interior Material Collections for OEMs Market
| Company | Interior System Depth | Carbon Evidence Depth | Material Route Breadth | Geographic Footprint |
|---|---|---|---|---|
| FORVIA | High | Strong | Strong | Global with European material development and MATERI’ACT support |
| Yanfeng | High | Strong | Strong | China and Europe centered with global OEM interior reach |
| Autoneum | Medium | Strong | Strong | Global acoustic and trim footprint across light and commercial vehicles |
| Adient | High | Medium | Medium | Global seating footprint with strong OEM platform access |
| Lear | High | Medium | Medium | Global seating and trim reach with recycled textile capability |
| Dow | Medium | Strong | Strong | Global polyurethane and circular foam chemistry capability |
| BASF | Medium | Strong | Strong | Global foam, coating, and mass balance supply routes |
| Covestro | Medium | Strong | Strong | Global polycarbonate and engineering plastics presence |
| Borealis | Low | Medium | Strong | Europe centered recycled polypropylene compound capability |
| Trinseo | Low | Medium | Medium | Specialty material supply linked with circular interior programs |
Source: Future Market Insights competitive analysis, 2026. Ratings reflect relative positioning based on interior system depth, carbon evidence depth, material route breadth, and geographic reach.
Key Developments in Carbon-Neutral Interior Material Collections for OEMs Market
- In March 2024, Yanfeng introduced the Reco Seat concept with up to 40% lower product carbon emissions than conventional seating. The concept used recycled foam, thermoplastic foam, recycled PET, and recycled steel to show part-level carbon reduction.
- In March 2025, BASF introduced biomass balance flexible polyurethane foam systems in North America. The company stated potential product carbon footprint reductions of up to 75% compared with conventional flexible polyurethane foam systems.
- In April 2025, Covestro introduced TÜV Rheinland-certified polycarbonate grades made from end-of-life headlamps. The grades contain 50% recycled content and are being validated by Volkswagen and NIO.
- In May 2025, BASF Coatings expanded biomass-balanced products and reported around 8 million kilograms of carbon dioxide reduction in 2024 for the product range.
- In September 2025, Autoneum said it processes more than 30,000 tons of recycled PET annually. The same release said Flexi-Light PET, Di-Light, and N-Join1 carpet contain over 90% recycled material.
Key Players in the Carbon-Neutral Interior Material Collections for OEMs Market
Global Interior and Seating Suppliers:
- FORVIA
- Yanfeng
- Lear Corporation
- Adient
- Autoneum
- Toyota Boshoku Corporation
- Sage Automotive Interiors
Material and Chemistry Suppliers:
- Dow Inc.
- BASF SE
- Covestro AG
- Borealis AG
- Trinseo PLC
- Asahi Kasei Corporation
- Aunde Group SE
Report Scope and Coverage
| Parameter | Details |
|---|---|
| Quantitative Units | USD 3.60 billion to USD 12.01 billion, at 12.8% CAGR |
| Market Definition | Verified low-carbon interior material collections supplied for OEM vehicle programs |
| Material Type | Recycled polymers, Bio-based foams, Natural fibers, Low-carbon coatings |
| Application | Seats, Door panels, Instrument panels, Headliners, Floor systems |
| Vehicle Program | Electric passenger vehicles, Internal combustion passenger vehicles, Premium programs, Commercial vehicles, Robotaxi platforms |
| Certification Model | Third-party LCA, Mass balance, Recycled proof, OEM validation |
| Supply Model | Tier-one bundled supply, Direct material supply, Joint development contracts |
| Processing Route | Mechanical recycling, Chemical recycling, Bio-based feedstock, Mono-material design |
| Regions Covered | North America, Latin America, Western Europe, Eastern Europe, East Asia, South Asia and Pacific, Middle East and Africa |
| Countries Covered | United States, China, India, Germany, Japan, South Korea, France |
| Key Companies Profiled | FORVIA, Yanfeng, Lear, Adient, Autoneum, Toyota Boshoku, Dow, BASF, Covestro, Borealis |
| Forecast Period | 2026 to 2036 |
| Approach | Hybrid top-down and bottom-up model using vehicle output, interior material shares, company releases, regulation checks, and supplier validation |
Source: Future Market Insights, 2026.
Carbon-Neutral Interior Material Collections for OEMs Market Breakdown by Material Type, Application, Vehicle Program, Certification Model, Supply Model, Processing Route, and Region
Carbon-Neutral Interior Material Collections for OEMs Market Segmented by Material Type:
- Recycled polymers
- Bio-based foams
- Natural fibers
- Low-carbon coatings
Carbon-Neutral Interior Material Collections for OEMs Market Segmented by Application:
- Seats
- Door panels
- Instrument panels
- Headliners
- Floor systems
Carbon-Neutral Interior Material Collections for OEMs Market Segmented by Vehicle Program:
- Electric passenger vehicles
- Internal combustion passenger vehicles
- Premium programs
- Commercial vehicles
- Robotaxi platforms
Carbon-Neutral Interior Material Collections for OEMs Market Segmented by Certification Model:
- Third-party LCA
- Mass balance
- Recycled proof
- OEM validation
Carbon-Neutral Interior Material Collections for OEMs Market Segmented by Supply Model:
- Tier-one bundled supply
- Direct material supply
- Joint development contracts
Carbon-Neutral Interior Material Collections for OEMs Market Segmented by Processing Route:
- Mechanical recycling
- Chemical recycling
- Bio-based feedstock
- Mono-material design
Carbon-Neutral Interior Material Collections for OEMs Market by Region:Region:
- North America
- United States
- Canada
- Europe
- Germany
- United Kingdom
- France
- Italy
- Spain
- Asia Pacific
- China
- Japan
- South Korea
- Taiwan
- Singapore
- Latin America
- Brazil
- Mexico
- Argentina
- Middle East & Africa
- GCC Countries
- South Africa
- Israel
Research Sources and Bibliography
- International Organization of Motor Vehicle Manufacturers. (2026, April 23). Auto industry growth shifted east in 2025 amid global repositioning.
- International Energy Agency. (2026, May 20). Global EV Outlook 2026: Trends in electric cars.
- European Commission. (2026). Cars and vans: Road transport decarbonisation.
- Council of the European Union. (2025, June 17). Circular economy: Council adopts position on the recycling of vehicles at the end of their life.
- European Union. (2024, June 13). Regulation (EU) 2024/1781 establishing a framework for the setting of ecodesign requirements for sustainable products.
- FORVIA. (2024, April 10). MATERI’ACT introduces a sustainable car interior featuring ocean bound plastics.
- Dow Inc. (2024, November 27). Dow, JLR and Adient develop industry first breakthrough for circularity in automotive seating.
- Yanfeng International Automotive Technology Co., Ltd. (2024, March 12). Yanfeng presents a new seat concept that reduces product carbon footprint.
- Yanfeng International Automotive Technology Co., Ltd. (2024, May 16). Yanfeng and Trinseo collaborate to accelerate recycling readiness.
- Autoneum Holding AG. (2024, December 13). Extension of sustainable polyester-based product portfolio for commercial vehicles.
- Autoneum Holding AG. (2024, December 19). On the road to net zero: Autoneum further optimizes environmental performance of sustainable Pure technologies for Renault Embleme.
- Autoneum Holding AG. (2025, September 3). Autoneum at IAA Mobility 2025: Trends and materials.
- Covestro AG. (2025, April 15). Covestro contributes to automotive circularity with materials recycled from end-of-life headlamps.
- Covestro AG. (2024, November 11). Covestro deepens collaboration with Ausell to advance end-of-life automotive plastics recycling.
- Adient plc. (2025, January 29). Adient releases its 2024 Sustainability Report.
- Yanfeng International Automotive Technology Co., Ltd. (2025, July 25). Yanfeng releases 2024 ESG report highlighting sustainability achievements.
- BASF SE. (2025, May 8). BASF Coatings expands business with biomass-balanced products.
- BASF Corporation. (2025, March 27). BASF introduces biomass balance flexible polyurethane foam systems for the North American furniture industry.
- Borealis AG. (2024, June 20). Borealis introduces glass-fiber reinforced polypropylene with 65% post-consumer recycled content for automotive applications.
- Press Information Bureau, Government of India. (2025, March 25). Revolutionizing mobility: The Make in India auto story.
- Germany Trade and Invest. (2026, February 17). Germany is world’s second-largest EV maker.
- Japan Automobile Manufacturers Association. (2025, September 26). The motor industry of Japan 2025.
The bibliography uses public institutions, trade bodies, direct company releases, and official technical pages relevant to vehicle interiors, carbon evidence, recycled content, and OEM material approval.
This Report Answers
- What is the current and future size of the carbon-neutral interior material collections for OEMs market?
- How fast is the carbon-neutral interior material collections for OEMs market projected to expand between 2026 and 2036?
- Which material type is projected to lead demand by 2026?
- Which application is expected to account for the largest share in 2026?
- Why are recycled polymers and bio-based foams important for OEM interior programs?
- How do product carbon footprint files affect OEM material approval?
- Which countries are projected to record faster expansion during the forecast period?
- Who are the main companies active in carbon-neutral interior material collections?
- How does FMI define the carbon-neutral interior material collections for OEMs market scope?
- How does FMI estimate and validate the forecast?
Frequently Asked Questions
What is the global market demand for Carbon-Neutral Interior Material Collections for OEMs in 2026?
In 2026, the market is projected at USD 3.60 billion as OEMs expand verified low-carbon material sourcing for vehicle interiors.
How big will the Carbon-Neutral Interior Material Collections for OEMs Market be in 2036?
By 2036, the market is projected to reach USD 12.01 billion as recycled and bio-based cabin materials enter more vehicle programs.
How much is demand for Carbon-Neutral Interior Material Collections for OEMs expected to expand between 2026 and 2036?
Demand is projected to expand at 12.8% CAGR between 2026 and 2036 as OEMs require stronger part-level carbon evidence.
Which material type is expected to lead the Carbon-Neutral Interior Material Collections for OEMs Market by 2026?
Recycled polymers are projected to lead material type demand with 46.0% share in 2026 because molded cabin parts use large polymer volumes.
Which application is expected to lead Carbon-Neutral Interior Material Collections for OEMs demand in 2026?
Seat and trim sets are expected to lead application demand with 34.0% share in 2026 due to visible cabin carbon claims.
Which country is forecast to grow fastest in the Carbon-Neutral Interior Material Collections for OEMs Market?
India is expected to post 14.2% CAGR through 2036 as local sourcing and export programs require stronger material documentation.
What does the Carbon-Neutral Interior Material Collections for OEMs Market include?
The market includes recycled polymers, bio-based foams, natural fibers, low-carbon coatings, and evidence files supplied for OEM interior programs.
How does FMI estimate the Carbon-Neutral Interior Material Collections for OEMs Market forecast?
FMI uses vehicle output, interior material demand, supplier releases, regulation checks, and carbon documentation requirements to validate the forecast.
Why do OEMs need carbon-neutral interior material collections?
OEMs need these collections because part-level carbon files help connect material choices with vehicle life cycle emission targets.
Preview the report firsthand - request a free sample
Get SampleGet the brochure for pricing and purchase details.
Get PDFTable of Content
- Key Takeaways
- Market Size and CAGR
- Top Growth Driver
- Fastest Growing Segment
- Leading Region
- Key Companies
- Emerging Opportunities
- Executive Summary
- Global Market Outlook
- Demand-side Trends
- Supply-side Trends
- Technology Roadmap Analysis
- Analysis and Recommendations
- Analyst Perspective (What is happening? Why now? What should investors know?)
- Key Questions Answered
- How large is the market?
- What is the CAGR?
- What are key trends?
- Which region dominates?
- Who are the leaders?
- Market Overview
- Market Coverage / Taxonomy
- Market Definition / Scope / Limitations
- Research Methodology
- Chapter Orientation
- Analytical Lens and Working Hypotheses
- Market Structure, Signals, and Trend Drivers
- Benchmarking and Cross-market Comparability
- Market Sizing, Forecasting, and Opportunity Mapping
- Research Design and Evidence Framework
- Desk Research Programme (Secondary Evidence)
- Expert Input and Fieldwork (Primary Evidence)
- Tooling, Models, and Reference Databases
- Data Engineering and Model Build
- Quality Assurance and Audit Trail
- Market Background
- Market Dynamics (Drivers, Restraints, Opportunity, Trends)
- Scenario Forecast (Optimistic, Likely, Conservative)
- Impact Analysis
- AI Impact
- Sustainability Impact
- Regulatory Impact
- Technology Impact
- Consumer / Buyer Analysis
- Purchase Drivers
- Adoption Barriers
- Buyer Journey
- Opportunity Map Analysis
- Product Life Cycle Analysis
- Supply Chain Analysis
- Investment Feasibility Matrix
- Value Chain Analysis
- PESTLE and Porter's Analysis
- Regulatory Landscape
- Regional Parent Market Outlook
- Production and Consumption Statistics
- Import and Export Statistics
- Global Market Analysis and Forecast, 2021 to 2036
- Historical Market Size Value (USD Billion) & Volume (Unit) Analysis, 2021 to 2025
- Current and Future Market Size Value (USD Billion) & Volume (Unit) Projections, 2026 to 2036
- Y-o-Y Growth Trend Analysis
- Absolute $ Opportunity Analysis
- Global Market Pricing Analysis, 2021 to 2036
- Global Market Analysis and Forecast, By Material Type, 2021 to 2036
- Introduction / Key Findings
- Historical Market Size Value (USD Billion) & Volume (Unit) Analysis By Material Type, 2021 to 2025
- Current and Future Market Size Value (USD Billion) & Volume (Unit) Analysis and Forecast By Material Type, 2026 to 2036
- Recycled polymers
- Bio-based foams
- Natural fibers
- Low-carbon coatings
- Recycled polymers
- Y-o-Y Growth Trend Analysis By Material Type, 2021 to 2025
- Absolute $ Opportunity Analysis By Material Type, 2026 to 2036
- Global Market Analysis and Forecast, By Application, 2021 to 2036
- Introduction / Key Findings
- Historical Market Size Value (USD Billion) & Volume (Unit) Analysis By Application, 2021 to 2025
- Current and Future Market Size Value (USD Billion) & Volume (Unit) Analysis and Forecast By Application, 2026 to 2036
- Seats
- Door panels
- Instrument panels
- Headliners
- Floor systems
- Seats
- Y-o-Y Growth Trend Analysis By Application, 2021 to 2025
- Absolute $ Opportunity Analysis By Application, 2026 to 2036
- Global Market Analysis and Forecast, By Vehicle Program, 2021 to 2036
- Introduction / Key Findings
- Historical Market Size Value (USD Billion) & Volume (Unit) Analysis By Vehicle Program, 2021 to 2025
- Current and Future Market Size Value (USD Billion) & Volume (Unit) Analysis and Forecast By Vehicle Program, 2026 to 2036
- Electric passenger vehicles
- Internal combustion passenger vehicles
- Premium programs
- Commercial vehicles
- Robotaxi platforms
- Electric passenger vehicles
- Y-o-Y Growth Trend Analysis By Vehicle Program, 2021 to 2025
- Absolute $ Opportunity Analysis By Vehicle Program, 2026 to 2036
- Global Market Analysis and Forecast, By Certification Model, 2021 to 2036
- Introduction / Key Findings
- Historical Market Size Value (USD Billion) & Volume (Unit) Analysis By Certification Model, 2021 to 2025
- Current and Future Market Size Value (USD Billion) & Volume (Unit) Analysis and Forecast By Certification Model, 2026 to 2036
- Third-party LCA
- Mass balance
- Recycled proof
- OEM validation
- Third-party LCA
- Y-o-Y Growth Trend Analysis By Certification Model, 2021 to 2025
- Absolute $ Opportunity Analysis By Certification Model, 2026 to 2036
- Global Market Analysis and Forecast, By Supply Model, 2021 to 2036
- Introduction / Key Findings
- Historical Market Size Value (USD Billion) & Volume (Unit) Analysis By Supply Model, 2021 to 2025
- Current and Future Market Size Value (USD Billion) & Volume (Unit) Analysis and Forecast By Supply Model, 2026 to 2036
- Tier-one bundled supply
- Direct material supply
- Joint development contracts
- Tier-one bundled supply
- Y-o-Y Growth Trend Analysis By Supply Model, 2021 to 2025
- Absolute $ Opportunity Analysis By Supply Model, 2026 to 2036
- Global Market Analysis and Forecast, By Processing Route
- Introduction / Key Findings
- Historical Market Size Value (USD Billion) & Volume (Unit) Analysis By Processing Route, 2021 to 2025
- Current and Future Market Size Value (USD Billion) & Volume (Unit) Analysis and Forecast By Processing Route, 2026 to 2036
- Mechanical recycling
- Chemical recycling
- Bio-based feedstock
- Mono-material design
- Mechanical recycling
- Y-o-Y Growth Trend Analysis By Processing Route, 2021 to 2025
- Absolute $ Opportunity Analysis By Processing Route, 2026 to 2036
- Global Market Analysis and Forecast, By Region, 2021 to 2036
- Introduction
- Historical Market Size Value (USD Billion) & Volume (Unit) Analysis By Region, 2021 to 2025
- Current Market Size Value (USD Billion) & Volume (Unit) Analysis and Forecast By Region, 2026 to 2036
- North America
- Latin America
- Western Europe
- Eastern Europe
- East Asia
- South Asia and Pacific
- Middle East & Africa
- Market Attractiveness Analysis By Region
- North America Market Analysis and Forecast, By Country, 2021 to 2036
- Historical Market Size Value (USD Billion) & Volume (Unit) Trend Analysis By Market Taxonomy, 2021 to 2025
- Market Size Value (USD Billion) & Volume (Unit) Forecast By Market Taxonomy, 2026 to 2036
- By Country
- USA
- Canada
- Mexico
- By Material Type
- By Application
- By Vehicle Program
- By Certification Model
- By Supply Model
- By Processing Route
- By Country
- Market Attractiveness Analysis
- By Country
- By Material Type
- By Application
- By Vehicle Program
- By Certification Model
- By Supply Model
- By Processing Route
- Key Takeaways
- Latin America Market Analysis and Forecast, By Country
- Historical Market Size Value (USD Billion) & Volume (Unit) Trend Analysis By Market Taxonomy, 2021 to 2025
- Market Size Value (USD Billion) & Volume (Unit) Forecast By Market Taxonomy, 2026 to 2036
- By Country
- Brazil
- Chile
- Rest of Latin America
- By Material Type
- By Application
- By Vehicle Program
- By Certification Model
- By Supply Model
- By Processing Route
- By Country
- Market Attractiveness Analysis
- By Country
- By Material Type
- By Application
- By Vehicle Program
- By Certification Model
- By Supply Model
- By Processing Route
- Key Takeaways
- Western Europe Market Analysis and Forecast, By Country
- Historical Market Size Value (USD Billion) & Volume (Unit) Trend Analysis By Market Taxonomy, 2021 to 2025
- Market Size Value (USD Billion) & Volume (Unit) Forecast By Market Taxonomy, 2026 to 2036
- By Country
- Germany
- UK
- Italy
- Spain
- France
- Nordic
- BENELUX
- Rest of Western Europe
- By Material Type
- By Application
- By Vehicle Program
- By Certification Model
- By Supply Model
- By Processing Route
- By Country
- Market Attractiveness Analysis
- By Country
- By Material Type
- By Application
- By Vehicle Program
- By Certification Model
- By Supply Model
- By Processing Route
- Key Takeaways
- Eastern Europe Market Analysis and Forecast, By Country
- Historical Market Size Value (USD Billion) & Volume (Unit) Trend Analysis By Market Taxonomy, 2021 to 2025
- Market Size Value (USD Billion) & Volume (Unit) Forecast By Market Taxonomy, 2026 to 2036
- By Country
- Russia
- Poland
- Hungary
- Balkan & Baltic
- Rest of Eastern Europe
- By Material Type
- By Application
- By Vehicle Program
- By Certification Model
- By Supply Model
- By Processing Route
- By Country
- Market Attractiveness Analysis
- By Country
- By Material Type
- By Application
- By Vehicle Program
- By Certification Model
- By Supply Model
- By Processing Route
- Key Takeaways
- East Asia Market Analysis and Forecast, By Country
- Historical Market Size Value (USD Billion) & Volume (Unit) Trend Analysis By Market Taxonomy, 2021 to 2025
- Market Size Value (USD Billion) & Volume (Unit) Forecast By Market Taxonomy, 2026 to 2036
- By Country
- China
- Japan
- South Korea
- By Material Type
- By Application
- By Vehicle Program
- By Certification Model
- By Supply Model
- By Processing Route
- By Country
- Market Attractiveness Analysis
- By Country
- By Material Type
- By Application
- By Vehicle Program
- By Certification Model
- By Supply Model
- By Processing Route
- Key Takeaways
- South Asia and Pacific Market Analysis and Forecast, By Country
- Historical Market Size Value (USD Billion) & Volume (Unit) Trend Analysis By Market Taxonomy, 2021 to 2025
- Market Size Value (USD Billion) & Volume (Unit) Forecast By Market Taxonomy, 2026 to 2036
- By Country
- India
- ASEAN
- Australia & New Zealand
- Rest of South Asia and Pacific
- By Material Type
- By Application
- By Vehicle Program
- By Certification Model
- By Supply Model
- By Processing Route
- By Country
- Market Attractiveness Analysis
- By Country
- By Material Type
- By Application
- By Vehicle Program
- By Certification Model
- By Supply Model
- By Processing Route
- Key Takeaways
- Middle East & Africa Market Analysis and Forecast, By Country
- Historical Market Size Value (USD Billion) & Volume (Unit) Trend Analysis By Market Taxonomy, 2021 to 2025
- Market Size Value (USD Billion) & Volume (Unit) Forecast By Market Taxonomy, 2026 to 2036
- By Country
- Kingdom of Saudi Arabia
- Other GCC Countries
- Türkiye
- South Africa
- Other African Union
- Rest of Middle East & Africa
- By Material Type
- By Application
- By Vehicle Program
- By Certification Model
- By Supply Model
- By Processing Route
- By Country
- Market Attractiveness Analysis
- By Country
- By Material Type
- By Application
- By Vehicle Program
- By Certification Model
- By Supply Model
- By Processing Route
- Key Takeaways
- Key Countries Market Analysis
- USA
- Pricing Analysis
- Market Share Analysis, 2025
- By Material Type
- By Application
- By Vehicle Program
- By Certification Model
- By Supply Model
- By Processing Route
- Canada
- Pricing Analysis
- Market Share Analysis, 2025
- By Material Type
- By Application
- By Vehicle Program
- By Certification Model
- By Supply Model
- By Processing Route
- Mexico
- Pricing Analysis
- Market Share Analysis, 2025
- By Material Type
- By Application
- By Vehicle Program
- By Certification Model
- By Supply Model
- By Processing Route
- Brazil
- Pricing Analysis
- Market Share Analysis, 2025
- By Material Type
- By Application
- By Vehicle Program
- By Certification Model
- By Supply Model
- By Processing Route
- Chile
- Pricing Analysis
- Market Share Analysis, 2025
- By Material Type
- By Application
- By Vehicle Program
- By Certification Model
- By Supply Model
- By Processing Route
- Germany
- Pricing Analysis
- Market Share Analysis, 2025
- By Material Type
- By Application
- By Vehicle Program
- By Certification Model
- By Supply Model
- By Processing Route
- UK
- Pricing Analysis
- Market Share Analysis, 2025
- By Material Type
- By Application
- By Vehicle Program
- By Certification Model
- By Supply Model
- By Processing Route
- Italy
- Pricing Analysis
- Market Share Analysis, 2025
- By Material Type
- By Application
- By Vehicle Program
- By Certification Model
- By Supply Model
- By Processing Route
- Spain
- Pricing Analysis
- Market Share Analysis, 2025
- By Material Type
- By Application
- By Vehicle Program
- By Certification Model
- By Supply Model
- By Processing Route
- France
- Pricing Analysis
- Market Share Analysis, 2025
- By Material Type
- By Application
- By Vehicle Program
- By Certification Model
- By Supply Model
- By Processing Route
- India
- Pricing Analysis
- Market Share Analysis, 2025
- By Material Type
- By Application
- By Vehicle Program
- By Certification Model
- By Supply Model
- By Processing Route
- ASEAN
- Pricing Analysis
- Market Share Analysis, 2025
- By Material Type
- By Application
- By Vehicle Program
- By Certification Model
- By Supply Model
- By Processing Route
- Australia & New Zealand
- Pricing Analysis
- Market Share Analysis, 2025
- By Material Type
- By Application
- By Vehicle Program
- By Certification Model
- By Supply Model
- By Processing Route
- China
- Pricing Analysis
- Market Share Analysis, 2025
- By Material Type
- By Application
- By Vehicle Program
- By Certification Model
- By Supply Model
- By Processing Route
- Japan
- Pricing Analysis
- Market Share Analysis, 2025
- By Material Type
- By Application
- By Vehicle Program
- By Certification Model
- By Supply Model
- By Processing Route
- South Korea
- Pricing Analysis
- Market Share Analysis, 2025
- By Material Type
- By Application
- By Vehicle Program
- By Certification Model
- By Supply Model
- By Processing Route
- Russia
- Pricing Analysis
- Market Share Analysis, 2025
- By Material Type
- By Application
- By Vehicle Program
- By Certification Model
- By Supply Model
- By Processing Route
- Poland
- Pricing Analysis
- Market Share Analysis, 2025
- By Material Type
- By Application
- By Vehicle Program
- By Certification Model
- By Supply Model
- By Processing Route
- Hungary
- Pricing Analysis
- Market Share Analysis, 2025
- By Material Type
- By Application
- By Vehicle Program
- By Certification Model
- By Supply Model
- By Processing Route
- Kingdom of Saudi Arabia
- Pricing Analysis
- Market Share Analysis, 2025
- By Material Type
- By Application
- By Vehicle Program
- By Certification Model
- By Supply Model
- By Processing Route
- Türkiye
- Pricing Analysis
- Market Share Analysis, 2025
- By Material Type
- By Application
- By Vehicle Program
- By Certification Model
- By Supply Model
- By Processing Route
- South Africa
- Pricing Analysis
- Market Share Analysis, 2025
- By Material Type
- By Application
- By Vehicle Program
- By Certification Model
- By Supply Model
- By Processing Route
- USA
- Market Structure Analysis
- Competition Dashboard
- Competition Benchmarking
- Market Share Analysis of Top Players
- By Regional
- By Material Type
- By Application
- By Vehicle Program
- By Certification Model
- By Supply Model
- By Processing Route
- Emerging Startups
- Innovation Benchmarking
- Competition Analysis
- Competition Deep Dive
- FORVIA
- Overview
- Product Portfolio
- Profitability by Market Segments (Product/Region/Sales Channel)
- Sales Footprint
- Strategy Overview
- Marketing Strategy
- Product Strategy
- Channel Strategy
- Yanfeng
- Lear Corporation
- Adient
- Autoneum
- Toyota Boshoku Corporation
- Sage Automotive Interiors
- Dow Inc.
- BASF SE
- Covestro AG
- Borealis AG
- Trinseo PLC
- Asahi Kasei Corporation
- Aunde Group SE
- FORVIA
- Case Studies
- Success Stories
- Recent Developments
- Competition Deep Dive
- Assumptions & Acronyms Used


