The cargo vans market is projected to grow from USD 116.7 billion in 2025 to USD 223.3 billion in 2035, reflecting a CAGR of 6.7%. This growth represents an absolute dollar opportunity of USD 106.6 billion over the decade. Annual increments show steady expansion, starting from USD 116.7 billion in 2025, reaching USD 132.9 billion in 2028, USD 161.4 billion in 2031, and progressing to USD 209.2 billion by 2034. The consistent growth highlights strong market potential, providing manufacturers and suppliers with a predictable revenue trajectory.
Strategic planning around production and sales can leverage these yearly increases to maximize returns. The absolute dollar opportunity highlights the substantial market potential for cargo vans over the next decade. Incremental growth from USD 116.7 billion in 2025 to USD 223.3 billion in 2035 emphasizes a cumulative increase of USD 106.6 billion. Key years, such as 2029 with USD 141.8 billion and 2033 with USD 183.8 billion, mark periods of accelerated adoption. This trend presents manufacturers with opportunities to expand their fleets, enhance distribution networks, and meet the growing demand. The predictable growth pattern allows stakeholders to plan investments and capitalize on the expanding market value efficiently.
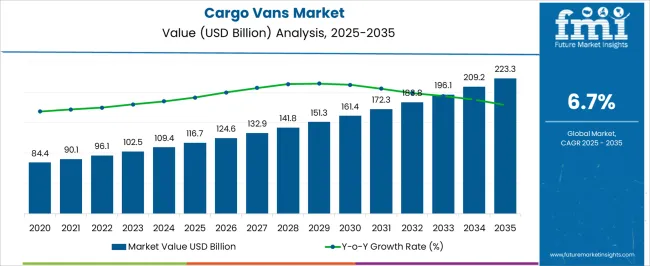
| Metric | Value |
|---|---|
| Cargo Vans Market Estimated Value in (2025 E) | USD 116.7 billion |
| Cargo Vans Market Forecast Value in (2035 F) | USD 223.3 billion |
| Forecast CAGR (2025 to 2035) | 6.7% |
The cargo vans market is part of the broader commercial vehicle market, which includes light commercial vehicles (LCVs), medium commercial vehicles (MCVs), and heavy commercial vehicles (HCVs). The overall commercial vehicle market is expected to grow steadily over the next decade, with cargo vans accounting for a significant share. In 2025, cargo vans represent roughly 28% of the total commercial vehicle market, and by 2035, their share is projected to rise slightly due to higher demand for last-mile delivery and fleet expansion. The parent market is estimated to grow from around USD 416 billion in 2025 to over USD 720 billion in 2035, with cargo vans contributing an absolute growth of USD 106.6 billion within this period.
Within the parent market, light commercial vehicles, including pickups and minibuses, account for approximately 45% of the total value, while medium and heavy commercial vehicles comprise 27% and 25%, respectively. Cargo vans’ strong growth at a CAGR of 6.7% from USD 116.7 billion in 2025 to USD 223.3 billion in 2035 demonstrates their increasing importance in the overall commercial vehicle landscape. This segment accounts for roughly 15% of the total incremental growth in the commercial vehicle market over the decade. Manufacturers can leverage this growth to expand production, optimize distribution, and capture a larger portion of the parent market.
The cargo vans market is witnessing steady expansion, driven by the rising demand for efficient goods transportation solutions across urban and regional routes. Growth is being supported by the expansion of e-commerce, last-mile delivery networks, and logistics services, which are increasing the need for versatile and reliable light commercial vehicles. Manufacturers are introducing improved designs with enhanced load capacity, fuel efficiency, and safety features to cater to evolving customer requirements.
The market is also benefiting from fleet modernization initiatives by logistics operators aiming to reduce operational costs and improve performance. Stringent emission regulations in various regions are prompting the development of advanced propulsion technologies, further influencing purchasing decisions.
In addition, the adaptability of cargo vans to multiple industries, including retail, courier services, and industrial supply chains, is reinforcing market resilience. As demand for time-sensitive deliveries and efficient distribution networks grows, the cargo vans market is expected to maintain its upward trajectory, supported by innovations in vehicle design, connectivity, and load management solutions.
The cargo vans market is segmented by propulsion, tonnage capacity, end use, and geographic regions. By propulsion, cargo vans market is divided into ICE and Electric. In terms of tonnage capacity, cargo vans market is classified into 2 to 3 tons, Below 2 tons, and Above 3 tons. Based on end use, cargo vans market is segmented into Commercial and Personal. Regionally, the cargo vans industry is classified into North America, Latin America, Western Europe, Eastern Europe, Balkan & Baltic Countries, Russia & Belarus, Central Asia, East Asia, South Asia & Pacific, and the Middle East & Africa.
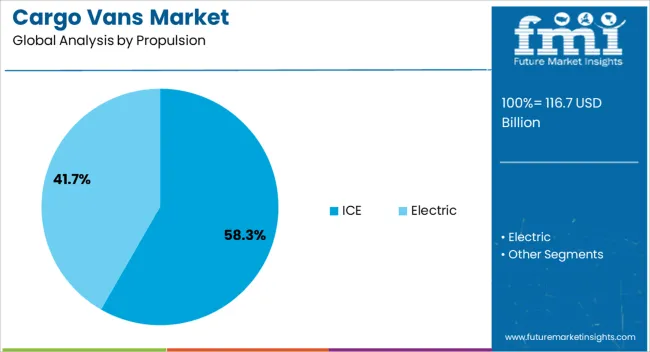
The internal combustion engine propulsion segment is projected to account for 58.3% of the cargo vans market revenue share in 2025, making it the leading propulsion type. This dominance is being supported by the well-established infrastructure for fueling, longer driving ranges, and proven performance in varied operating conditions.
ICE-powered cargo vans continue to be favored by fleet operators due to their reliability, ability to handle heavy payloads, and ease of maintenance compared to emerging propulsion technologies. The lower upfront cost of ICE models relative to electric alternatives is also contributing to higher adoption, particularly in regions where electrification infrastructure is still developing.
Manufacturers are improving fuel efficiency and reducing emissions through advanced engine technologies to meet evolving environmental standards, ensuring the continued relevance of ICE models The segment’s adaptability for both long-haul and urban delivery operations further strengthens its market position, and ongoing enhancements in drivetrain performance are expected to sustain its leadership in the years ahead.
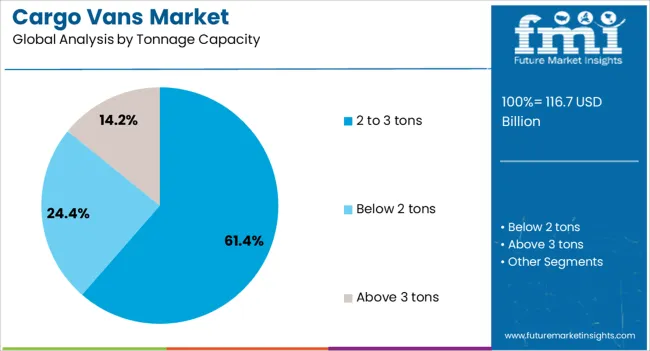
The 2 to 3 tons tonnage capacity segment is anticipated to hold 61.4% of the cargo vans market revenue share in 2025, making it the dominant capacity category. This leadership is being driven by the segment’s optimal balance between load-carrying capacity and maneuverability, which is ideal for urban and regional delivery applications. Vehicles in this range are capable of transporting substantial cargo volumes without sacrificing fuel efficiency or accessibility in congested city environments.
The segment is widely favored by logistics companies, retail distributors, and small to medium-sized enterprises seeking cost-effective transportation solutions. Demand is being reinforced by the growing e-commerce sector, where mid-capacity cargo vans are essential for timely and flexible delivery services.
Manufacturers are enhancing models within this tonnage range by integrating advanced telematics, driver-assist technologies, and improved ergonomics to maximize operational productivity The versatility of these vehicles across multiple industries, combined with their efficiency in high-frequency delivery cycles, continues to position the segment as the preferred choice for a broad spectrum of commercial applications.
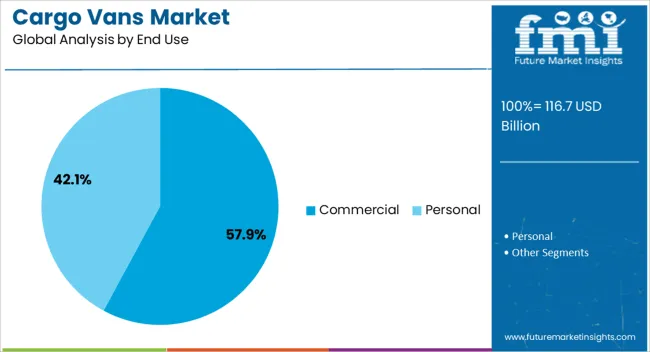
The commercial end use segment is expected to represent 57.9% of the cargo vans market revenue share in 2025, solidifying its position as the leading application area. Its dominance is being reinforced by the broad utilization of cargo vans in logistics, retail distribution, construction, and service-based industries. Businesses rely on these vehicles for their flexibility, ability to handle diverse cargo types, and suitability for both short-haul and long-distance routes.
The segment’s growth is being fueled by the rising need for efficient last-mile delivery networks, particularly in urban centers with high consumer demand. Fleet operators are increasingly adopting commercial cargo vans due to their capacity to integrate with telematics systems, enabling real-time tracking and route optimization.
Manufacturers are catering to this segment with model variants that offer customizable interiors, enhanced payload capabilities, and improved fuel economy to reduce the total cost of ownership. As commerce becomes increasingly time-sensitive and customer expectations for rapid delivery intensify, the commercial segment is expected to remain the largest revenue contributor in the cargo vans market.
The cargo vans market is expanding due to rising demand for last-mile delivery, e-commerce logistics, and small business transport solutions. North America and Europe lead adoption with technologically advanced, fuel-efficient vans featuring connectivity and safety systems. Asia-Pacific shows rapid growth driven by urbanization, growing retail and courier networks, and small-scale logistics operations. Manufacturers differentiate through payload capacity, drivetrains, and fleet management integration. Regional differences in infrastructure, fuel prices, and regulatory emission standards strongly influence adoption, operational efficiency, and competitive positioning globally.
Adoption of cargo vans is fueled by the surge in e-commerce and the need for reliable last-mile delivery solutions. North America and Europe focus on high-efficiency, connected vans to support fast delivery networks and integrated fleet management. Asia-Pacific markets prioritize cost-effective vans for dense urban deliveries, small businesses, and courier services. Differences in delivery density, urban infrastructure, and operational distance influence van size, payload capacity, and route planning. Leading manufacturers offer electric or hybrid vans with telematics for route optimization, while regional producers provide affordable, conventional vans suitable for emerging logistics markets. E-commerce demand contrasts shape adoption, delivery efficiency, and competitiveness in global cargo van markets.
Payload capacity, fuel efficiency, and operational performance are critical factors for cargo van adoption. North America and Europe emphasize vans with high payload limits, low fuel consumption, and aerodynamic designs to optimize delivery efficiency and reduce operational costs. Asia-Pacific markets adopt smaller payload vans suited for urban streets and short-range deliveries while maintaining affordability. Differences in weight regulations, route patterns, and energy costs affect vehicle design, engine selection, and adoption strategy. Leading suppliers provide high-capacity, low-emission vans with advanced drivetrain technology, while regional players focus on compact, practical designs. Payload and efficiency contrasts shape adoption, operational reliability, and competitiveness globally.
Transition to electric and hybrid cargo vans drives adoption, especially in regions with strict emission norms. North America and Europe prioritize electric vans to meet zero-emission targets and reduce fuel costs in urban delivery fleets. Asia-Pacific markets adopt hybrid or electric models where government incentives exist but still rely on conventional diesel vans in cost-sensitive areas. Differences in charging infrastructure, energy pricing, and fleet operational cycles influence adoption pace and total cost of ownership. Leading manufacturers offer long-range electric vans with fast charging and fleet management integration, while regional players provide hybrid or conventional alternatives. Drivetrain contrasts shape adoption, sustainability alignment, and market competitiveness globally.
Emission regulations, safety standards, and fleet compliance requirements significantly impact the adoption of cargo vans. North America and Europe enforce strict Euro 6, EPA, and safety certifications, pushing manufacturers toward low-emission, technologically advanced vans. Asia-Pacific regulations vary; developed regions adopt international norms, while emerging markets prioritize cost-effective compliance. Differences in emissions limits, safety testing, and certification requirements affect vehicle selection, fleet upgrades, and adoption speed. Leading suppliers offer certified, compliant vans with integrated safety and telematics systems, while regional manufacturers concentrate on producing practical, locally compliant models. Regulatory contrasts shape adoption, fleet modernization, and competitiveness globally.
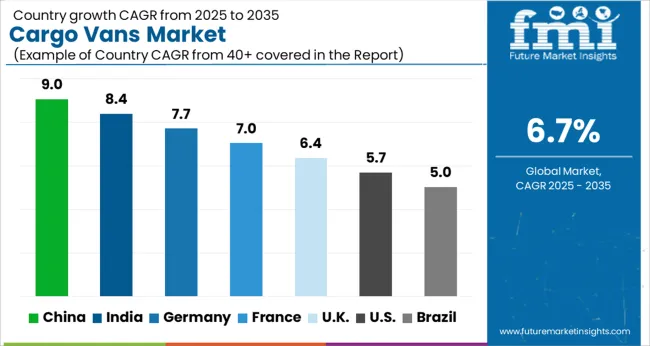
| Country | CAGR |
|---|---|
| China | 9.0% |
| India | 8.4% |
| Germany | 7.7% |
| France | 7.0% |
| UK | 6.4% |
| USA | 5.7% |
| Brazil | 5.0% |
The global cargo vans market is projected to grow at a 6.7% CAGR through 2035, driven by demand in logistics, delivery services, and commercial transportation. Among BRICS nations, China led with 9.0% growth as large-scale manufacturing and deployment across urban and regional transport networks were undertaken, while India at 8.4% expanded production and fleet utilization to meet increasing commercial mobility needs. In the OECD region, Germany at 7.7% maintained steady adoption under stringent safety and operational regulations, while the United Kingdom at 6.4% integrated cargo vans into urban and industrial distribution systems. The USA, growing at 5.7%, supported consistent deployment across commercial transportation and logistics sectors in compliance with federal and state-level vehicle regulations. This report includes insights on 40+ countries; the top countries are shown here for reference.
The cargo vans market in China is projected to grow at a CAGR of 9.0%, driven by rising demand for logistics, e commerce deliveries, and small business transport solutions. Adoption is being encouraged by vans that offer high fuel efficiency, load capacity, and operational reliability. Manufacturers are being urged to supply advanced, cost effective, and durable models. Distribution through fleet operators, rental services, and commercial dealerships is being strengthened. Research in electric and hybrid powertrains, safety features, and cargo optimization is being conducted. Increasing urban deliveries, growth in e commerce, and expanding small and medium enterprises are considered key factors driving the cargo vans market in China.
In India, the cargo vans market is expected to grow at a CAGR of 8.4%, supported by adoption in courier services, retail logistics, and commercial transport. Emphasis is being placed on vans that provide fuel efficiency, safety, and cost effectiveness for urban and regional operations. Local manufacturers are being encouraged to expand production and offer models suited to Indian road conditions. Distribution through commercial dealerships, fleet services, and online vehicle platforms is being widened. Awareness programs highlighting fuel savings and vehicle reliability are being promoted. Rapid growth of e commerce, increasing logistics requirements, and expanding micro and small businesses are recognized as primary drivers of the cargo vans market in India.
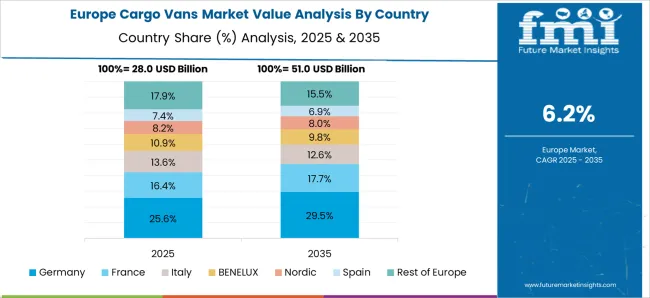
Germany is witnessing steady growth in the cargo vans market at a CAGR of 7.7%, driven by demand for commercial transport, logistics, and last mile delivery applications. Adoption is being encouraged by vans that offer strong durability, load capacity, and compliance with European emission standards. Manufacturers are being urged to provide advanced, reliable, and environmentally friendly models. Distribution through commercial dealerships, fleet operators, and rental services is being optimized. Research in electric drivetrains, lightweight materials, and safety enhancements is being pursued. Increasing e commerce deliveries, urban logistics requirements, and regulatory incentives for low emission vehicles are considered key factors driving the cargo vans market in Germany.
The cargo vans market in the United Kingdom is projected to grow at a CAGR of 6.4%, supported by demand from logistics companies, retail deliveries, and service industries. Adoption is being emphasized for vans that provide operational reliability, efficiency, and load capacity for urban and regional routes. Manufacturers are being encouraged to supply durable, fuel efficient, and versatile models. Distribution through fleet operators, rental services, and commercial dealerships is being strengthened. Promotional campaigns and demonstrations are being conducted to increase awareness of electric and hybrid options. Growth of e commerce, urban delivery requirements, and focus on low emission vehicles are recognized as major contributors to the cargo vans market in the United Kingdom.
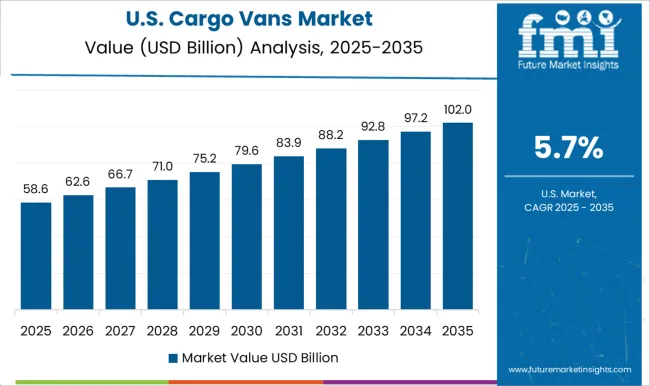
The cargo vans market in the United States is projected to grow at a CAGR of 5.7%, driven by demand from logistics, service industries, and last mile delivery operations. Adoption is being encouraged by vans that provide high payload capacity, reliability, and fuel efficiency. Manufacturers are being urged to develop advanced, versatile, and durable models. Distribution through fleet operators, commercial dealerships, and rental services is being maintained. Research in alternative powertrains, vehicle telematics, and load optimization is being pursued. Increasing e commerce activity, urban delivery demands, and regulatory incentives for low emission commercial vehicles are considered key drivers of the cargo vans market in the United States.
The cargo vans market is dominated by several well-established global manufacturers who supply vehicles designed for commercial logistics, transportation, and last-mile delivery solutions. Major suppliers include Ford, General Motors, Mercedes-Benz, Volkswagen, Stellantis, Toyota, Hyundai, Nissan, Renault, Isuzu, and Kia. These companies offer a diverse range of cargo vans that cater to various payload capacities, fuel types, and operational needs, supporting industries such as e-commerce, retail, and the service sector. Market growth is driven by the increasing demand for efficient urban delivery solutions and the rise of e-commerce logistics. Suppliers like Ford, General Motors, and Mercedes-Benz focus on developing vans with higher payload capacities, advanced safety features, and fuel-efficient powertrains. Volkswagen, Stellantis, Toyota, and Hyundai enhance their offerings with versatile models that suit both commercial fleets and small business operations, ensuring reliability and operational efficiency. Innovation and sustainability are key factors shaping competition in the cargo vans market. Companies invest heavily in electric and hybrid cargo vans to meet tightening emissions regulations and the growing demand for eco-friendly transportation. Nissan, Renault, Isuzu, and Kia have introduced electric and low-emission models to cater to urban delivery needs, while traditional combustion-engine vans continue to serve long-distance transport requirements. Strategic partnerships, product innovation, and expanding service networks enable these suppliers to remain competitive and responsive to evolving customer needs, ensuring the market continues to grow globally.
| Item | Value |
|---|---|
| Quantitative Units | USD 116.7 Billion |
| Propulsion | ICE and Electric |
| Tonnage Capacity | 2 to 3 tons, Below 2 tons, and Above 3 tons |
| End Use | Commercial and Personal |
| Regions Covered | North America, Europe, Asia-Pacific, Latin America, Middle East & Africa |
| Country Covered | United States, Canada, Germany, France, United Kingdom, China, Japan, India, Brazil, South Africa |
| Key Companies Profiled | Ford, General Motors, Mercedes-Benz, Volkswagen, Stellantis, Toyota, Hyundai, Nissan, Renault, Isuzu, and Kia |
| Additional Attributes | Dollar sales vary by vehicle type, including light, medium, and heavy-duty cargo vans; by fuel type, spanning gasoline, diesel, and electric; by application, such as last-mile delivery, logistics, commercial transport, and e-commerce; by end-use, covering logistics companies, small businesses, and fleet operators; by region, led by North America, Europe, and Asia-Pacific. Growth is driven by rising e-commerce, urban delivery demand, and electrification trends. |
The global cargo vans market is estimated to be valued at USD 116.7 billion in 2025.
The market size for the cargo vans market is projected to reach USD 223.3 billion by 2035.
The cargo vans market is expected to grow at a 6.7% CAGR between 2025 and 2035.
The key product types in cargo vans market are ice, electric, _battery electric vehicle, _hybrid electric vehicle and _plug-in hybrid electric vehicle.
In terms of tonnage capacity, 2 to 3 tons segment to command 61.4% share in the cargo vans market in 2025.


Our Research Products

The "Full Research Suite" delivers actionable market intel, deep dives on markets or technologies, so clients act faster, cut risk, and unlock growth.

The Leaderboard benchmarks and ranks top vendors, classifying them as Established Leaders, Leading Challengers, or Disruptors & Challengers.

Locates where complements amplify value and substitutes erode it, forecasting net impact by horizon

We deliver granular, decision-grade intel: market sizing, 5-year forecasts, pricing, adoption, usage, revenue, and operational KPIs—plus competitor tracking, regulation, and value chains—across 60 countries broadly.

Spot the shifts before they hit your P&L. We track inflection points, adoption curves, pricing moves, and ecosystem plays to show where demand is heading, why it is changing, and what to do next across high-growth markets and disruptive tech

Real-time reads of user behavior. We track shifting priorities, perceptions of today’s and next-gen services, and provider experience, then pace how fast tech moves from trial to adoption, blending buyer, consumer, and channel inputs with social signals (#WhySwitch, #UX).

Partner with our analyst team to build a custom report designed around your business priorities. From analysing market trends to assessing competitors or crafting bespoke datasets, we tailor insights to your needs.
Supplier Intelligence
Discovery & Profiling
Capacity & Footprint
Performance & Risk
Compliance & Governance
Commercial Readiness
Who Supplies Whom
Scorecards & Shortlists
Playbooks & Docs
Category Intelligence
Definition & Scope
Demand & Use Cases
Cost Drivers
Market Structure
Supply Chain Map
Trade & Policy
Operating Norms
Deliverables
Buyer Intelligence
Account Basics
Spend & Scope
Procurement Model
Vendor Requirements
Terms & Policies
Entry Strategy
Pain Points & Triggers
Outputs
Pricing Analysis
Benchmarks
Trends
Should-Cost
Indexation
Landed Cost
Commercial Terms
Deliverables
Brand Analysis
Positioning & Value Prop
Share & Presence
Customer Evidence
Go-to-Market
Digital & Reputation
Compliance & Trust
KPIs & Gaps
Outputs
Full Research Suite comprises of:
Market outlook & trends analysis
Interviews & case studies
Strategic recommendations
Vendor profiles & capabilities analysis
5-year forecasts
8 regions and 60+ country-level data splits
Market segment data splits
12 months of continuous data updates
DELIVERED AS:
PDF EXCEL ONLINE
Cargo Shipping Market Size and Share Forecast Outlook 2025 to 2035
Cargo Inspection Market Size and Share Forecast Outlook 2025 to 2035
Cargo Bike Tire Market Growth – Trends & Forecast 2025-2035
Cargo Bike Market Growth - Trends & Forecast 2024 to 2034
Air Cargo Market Analysis - Size, Share, and Forecast Outlook 2025 to 2035
Vehicle Cargo Box Market Size and Share Forecast Outlook 2025 to 2035
Electric Cargo Bike Market Size and Share Forecast Outlook 2025 to 2035
Aircraft Cargo Containers Market Size and Share Forecast Outlook 2025 to 2035
Aircraft Cargo Handling Equipment Market
Aircraft Cargo Winches Market
Trailer & Cargo Container Tracking Market Size and Share Forecast Outlook 2025 to 2035
Electric 3-wheeler Cargo Bikes Market Size and Share Forecast Outlook 2025 to 2035
Vans Market Size and Share Forecast Outlook 2025 to 2035
Caravans Market Size and Share Forecast Outlook 2025 to 2035
Cube Vans Market Size and Share Forecast Outlook 2025 to 2035
Mini Vans Market
Electric Vans Market Size and Share Forecast Outlook 2025 to 2035
Refrigerated Vans Market Growth - Trends & Forecast 2025 to 2035

Thank you!
You will receive an email from our Business Development Manager. Please be sure to check your SPAM/JUNK folder too.
Chat With
MaRIA