Electric Vans Market Size and Share Forecast Outlook 2025 to 2035

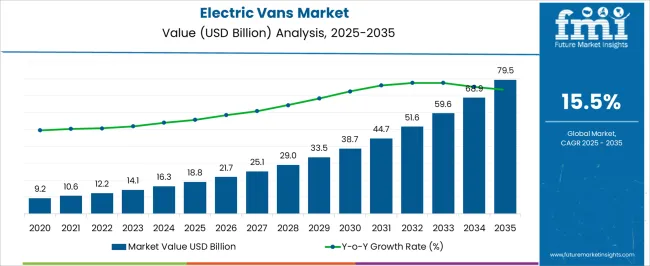
The electric vans market is estimated to be valued at USD 18.8 billion in 2025 and is projected to reach USD 79.5 billion by 2035, registering a compound annual growth rate (CAGR) of 15.5% over the forecast period. The primary cost components in the value chain are the battery pack, electric drivetrain, vehicle chassis, and electronic control systems. Battery packs represent the largest share of production costs, accounting for a significant proportion of the total value due to the high expense of lithium-ion cells and associated thermal management systems.

Economies of scale in battery manufacturing and improvements in energy density contribute to gradual cost reductions, supporting market expansion from USD 18.8 billion in 2025 to USD 33.5 billion by 2029. Electric drivetrains, including motors and power electronics, constitute the second-largest cost element. Technological enhancements in motor efficiency and inverter design lower operational costs and enhance vehicle performance, enabling incremental market growth over the forecast period. Chassis and vehicle assembly costs remain relatively stable, while software integration for fleet management and route optimization adds a growing proportion to total expenditures. The downstream value chain involves distribution, after-sales service, and charging infrastructure deployment.

Service and maintenance networks, along with fleet electrification partnerships, contribute to incremental value capture, particularly in logistics and commercial applications. By 2035, these combined cost and value-chain dynamics underpin a market size of USD 79.5 billion, reflecting both technological optimization and strategic supply-chain management as critical factors driving profitability and adoption across global regions.
Quick Stats for Electric Vans Market

  • Electric Vans Market Value (2025): USD 18.8 billion
  • Electric Vans Market Forecast Value (2035): USD 79.5 billion
  • Electric Vans Market Forecast CAGR: 15.5%
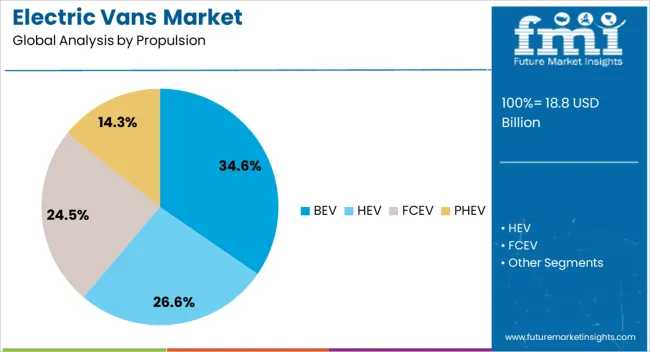
  • Leading Segment in Electric Vans Market in 2025: BEV (34.6%)
  • Key Growth Regions in Electric Vans Market: North America, Asia-Pacific, Europe
  • Top Key Players in Electric Vans Market: Volkswagen, Mercedes-Benz Group, TOYOTA MOTOR, Renault, Nissan Motor, Stellantis, Rivian Automotive, Arrival, Canoo, Bollinger Motors

Electric Vans Market Market Value Analysis

Electric Vans Market Key Takeaways

Metric Value
Electric Vans Market Estimated Value in (2025 E) USD 18.8 billion
Electric Vans Market Forecast Value in (2035 F) USD 79.5 billion
Forecast CAGR (2025 to 2035) 15.5%

The electric vans market represents a specialized segment within the global commercial electric vehicle industry, emphasizing sustainability, efficiency, and last-mile delivery solutions. Within the broader electric vehicle sector, it accounts for about 6.3%, driven by rising demand from urban logistics, e-commerce, and fleet operators. In the commercial vehicle and light-duty transport segment, its share is approximately 5.8%, reflecting adoption for goods transport, service vehicles, and municipal operations.

Across the urban mobility and last-mile delivery market, it holds around 5.0%, supporting reduced emissions and operational cost optimization. Within the electric drivetrain and battery technology sector, it represents 4.5%, highlighting integration of high-efficiency motors, regenerative braking, and smart energy management. In the fleet management and commercial transportation solutions category, the market contributes about 3.9%, emphasizing connectivity, telematics, and route optimization for operators. Recent developments in the market have focused on battery efficiency, range extension, and fleet integration. Innovations include high-capacity lithium-ion and solid-state batteries, lightweight chassis, and energy recovery systems to enhance driving range and payload efficiency.

Key players are collaborating with logistics companies, fleet operators, and charging infrastructure providers to accelerate adoption and reduce operational costs. Adoption of modular vehicle platforms, telematics-enabled fleet management, and fast-charging solutions is gaining traction to improve utilization and operational efficiency. The incentives, government policies, and urban emission regulations are driving investment in electric vans for both public and private sector fleets.

Why is the Electric Vans Market Growing?

The electric vans market is witnessing accelerated expansion, supported by the global push toward decarbonization and the widespread electrification of urban and regional transport fleets. Growing regulatory mandates targeting emissions reductions and the phasing out of internal combustion engine vehicles are encouraging fleet operators to adopt zero-emission alternatives. Technological advancements in battery energy density, coupled with declining battery costs, are making electric vans increasingly viable across various applications.

Infrastructure investments in fast-charging networks and government-backed incentives for commercial electric vehicle adoption are reinforcing market growth. Fleet operators in logistics, e-commerce, and municipal services are recognizing the total cost of ownership benefits of electric vans, especially in urban environments with high stop-and-go usage.

OEMs are also expanding their model range and production capacity to meet rising demand across light and medium-duty segments. As clean transportation becomes a global priority and electrification strategies gain momentum, electric vans are expected to become a cornerstone of last-mile and regional delivery solutions, paving the way for continued market expansion through the next decade.

Segmental Analysis

The electric vans market is segmented by propulsion, range, vehicle type, battery type, and geographic regions. By propulsion, electric vans market is divided into BEV, HEV, FCEV, and PHEV. In terms of range, electric vans market is classified into Above 200 miles, Upto 100 miles, and 100 to 200 miles. Based on vehicle type, electric vans market is segmented into Commercial vehicle and Passenger vehicle.

By battery type, electric vans market is segmented into Lithium Ion, Sealed Lead Acid, and Nickel Metal Hydride (NiMH). Regionally, the electric vans industry is classified into North America, Latin America, Western Europe, Eastern Europe, Balkan & Baltic Countries, Russia & Belarus, Central Asia, East Asia, South Asia & Pacific, and the Middle East & Africa.
Insights into the BEV Propulsion Segment

Electric Vans Market Analysis By Propulsion

The battery electric vehicle propulsion segment is projected to account for 34.6% of the electric vans market revenue share in 2025, making it the leading propulsion type. This dominance is being driven by growing demand for fully zero-emission vehicles, supported by increasingly stringent emission standards across key regions such as Europe, North America, and parts of Asia. The absence of an internal combustion engine in BEVs simplifies vehicle architecture, reducing mechanical complexity and operational maintenance costs.

Fleet operators are prioritizing BEVs for their long-term cost savings, supported by lower fueling expenses and minimal servicing requirements. Governments and local municipalities are offering incentives, subsidies, and access to zero-emission zones, further increasing the attractiveness of BEV adoption.

Enhanced battery technologies and improvements in charging infrastructure have addressed earlier concerns related to range and downtime. As commercial and utility fleets align their operations with net-zero targets, the BEV segment is anticipated to experience consistent growth, benefiting from favorable policies and the growing preference for clean transportation solutions in high-utilization urban and regional delivery environments.
Insights into the Above 200 Miles Range Segment

Electric Vans Market Analysis By Range

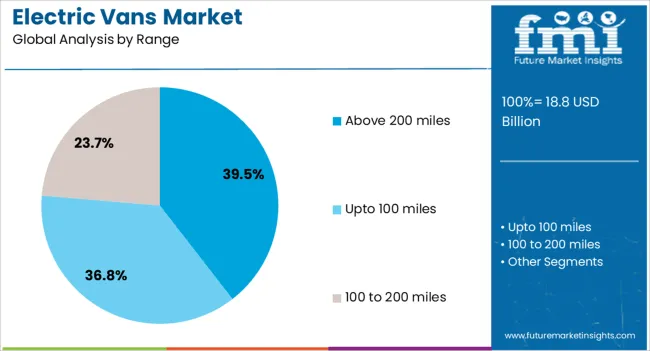
The above 200 miles range segment is anticipated to contribute 39.5% of the electric vans market revenue share in 2025, making it the most preferred range category. This leadership is being supported by improvements in lithium-ion and solid-state battery technologies, which have significantly increased energy density and allowed for longer driving ranges without compromising payload capacity. Fleet managers and logistics operators are increasingly favoring vehicles that can cover extended routes on a single charge, reducing reliance on frequent charging stops and maximizing daily operational efficiency.

The ability to service suburban and intercity delivery zones with a single full charge is driving preference for this range category. Technological developments in powertrain efficiency, regenerative braking systems, and thermal management solutions are further enhancing range performance.

As e-commerce expands and demand for reliable last-mile and regional delivery increases, electric vans capable of traveling over 200 miles are being seen as more versatile and cost-efficient options. The segment’s continued growth is expected to be supported by strategic fleet electrification plans across various industries.
Insights into the Commercial Vehicle Type Segment

Electric Vans Market Analysis By Vehicle Type

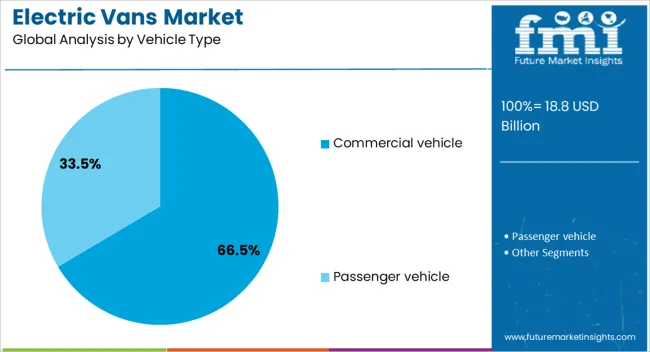
The commercial vehicle segment is expected to account for 66.5% of the electric vans market revenue share in 2025, establishing itself as the dominant vehicle type. This segment’s leadership is being driven by increasing electrification of delivery fleets, transportation services, and utility vehicles in response to environmental regulations and rising fuel costs. Businesses operating in logistics, courier services, and municipal fleets are increasingly shifting toward electric commercial vans to reduce emissions and improve operational efficiency.

The availability of various load capacities, adaptable chassis configurations, and extended driving ranges is supporting deployment across diverse commercial applications. Additionally, government procurement programs and public-private partnerships focused on clean fleet transitions are reinforcing adoption.

The total cost of ownership benefits, especially when combined with subsidies and lower maintenance expenses, are further motivating fleet operators to transition to electric models. As global cities continue to implement low-emission zones and encourage sustainable urban transport, the demand for electric commercial vans is expected to rise steadily, positioning this segment for sustained dominance in the market.

What are the Drivers, Restraints, and Key Trends of the Electric Vans Market?

The electric vans market has experienced substantial growth driven by the increasing demand for low-emission commercial vehicles, urban delivery solutions, and fleet electrification initiatives. Electric vans provide zero tailpipe emissions, lower operational costs, and reduced maintenance compared to conventional diesel and gasoline-powered vehicles. Governments worldwide are promoting electric commercial fleets through incentives, tax rebates, and urban access regulations.

The rise of eCommerce, last-mile delivery services, and cold chain logistics has intensified demand for electric vans capable of reliable, high-frequency operation. Technological advancements in battery energy density, motor efficiency, and vehicle telematics have enhanced range, payload capacity, and fleet management capabilities. However, high upfront costs, charging infrastructure limitations, and battery degradation remain challenges, encouraging manufacturers to develop cost-effective solutions, modular designs, and efficient energy storage systems.

Government Incentives and Regulatory Push Drive Adoption

The adoption of electric vans is strongly influenced by government policies, incentives, and emission regulations. Urban low-emission zones, subsidies for electric fleet purchases, and tax benefits reduce the total cost of ownership for businesses. Many municipalities mandate stricter emission standards for commercial fleets, encouraging fleet operators to transition from diesel-powered vans. Funding for charging infrastructure expansion further supports market penetration. Commercial operators leverage these regulatory frameworks to lower operational expenses and improve corporate sustainability profiles. Additionally, regulatory emphasis on greenhouse gas reduction and air quality improvement has prompted collaborations between vehicle manufacturers, logistics companies, and governments to accelerate the adoption of electric vans for urban deliveries, last-mile logistics, and service fleets.

Advancements in Battery and Charging Technology

Battery and charging technology developments are central to the performance and appeal of electric vans. High-energy-density lithium-ion and solid-state batteries allow extended driving ranges while maintaining payload capacity. Fast-charging solutions reduce downtime and enable continuous fleet operation. Battery management systems and regenerative braking technology enhance efficiency and extend service life. Manufacturers are also exploring modular battery designs for easier replacement and upgrade. These technological improvements support longer delivery routes, urban logistics, and specialized applications such as refrigerated transport. Combined with telematics and route optimization software, battery innovations have enhanced operational efficiency, reliability, and overall lifecycle performance, making electric vans viable alternatives to traditional internal combustion vehicles in commercial fleets.

E-commerce and Last-Mile Delivery Surge

The expansion of e-commerce has significantly increased demand for electric vans in last-mile delivery operations. Rapid urbanization and changing consumer shopping patterns require efficient, environmentally friendly delivery solutions. Electric vans provide quiet operation and zero emissions, enabling access to urban centers with strict environmental regulations. Fleet operators benefit from lower fuel and maintenance costs, as well as government incentives supporting electrification. Specialized configurations, including cargo optimization, refrigerated units, and lightweight materials, enhance utility for diverse delivery applications. Logistics companies are deploying electric vans to optimize route efficiency, reduce carbon footprint, and improve sustainability reporting. This trend is expected to sustain market momentum across multiple urban and regional logistics networks.

Infrastructure and Cost Challenges Limit Expansion

Despite promising growth, the electric vans market faces challenges related to high upfront costs, limited charging infrastructure, and battery lifespan concerns. Acquisition costs remain higher than conventional vehicles, deterring some fleet operators. Uneven charging network distribution can limit route flexibility, particularly for long-haul operations. Battery degradation over time affects range and replacement costs, impacting the total cost of ownership. Manufacturers and policymakers are addressing these constraints through investment in fast-charging networks, battery leasing models, and modular designs that facilitate upgrades and replacements. Education and awareness initiatives regarding operational cost savings, environmental benefits, and performance reliability are essential to accelerate adoption and overcome infrastructural limitations.
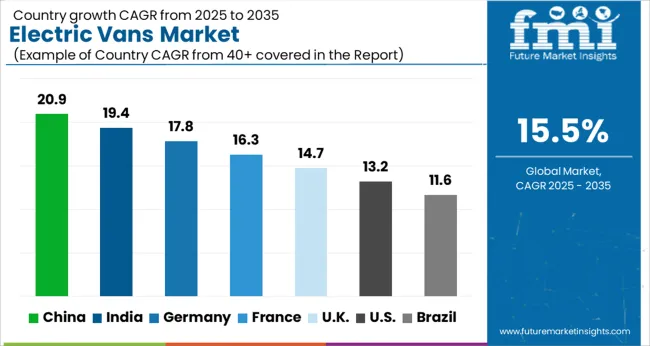
Analysis of Electric Vans Market By Key Countries

Electric Vans Market Cagr Analysis By Country

Country CAGR
China 20.9%
India 19.4%
Germany 17.8%
France 16.3%
UK 14.7%
USA 13.2%
Brazil 11.6%

The market is projected to grow at a CAGR of 15.5% from 2025 to 2035. Germany reached 17.8%, supported by rising adoption of electric commercial vehicles and infrastructure expansion. China led with 20.9%, driven by extensive manufacturing capabilities and government incentives for zero-emission transport. India recorded 19.4%, reflecting growing urban logistics electrification and domestic EV production. The United Kingdom reached 14.7%, supported by fleet modernization initiatives and charging infrastructure development. The United States recorded 13.2%, reflecting steady integration of electric vans in commercial fleets. These regions are actively scaling, engineering, and innovating in the market. This report includes insights on 40+ countries; the top markets are shown here for reference.

Expansion Outlook of Electric Vans Market in China

China is projected to grow at a CAGR of 20.9%, driven by the rapid adoption of commercial electric fleets for last-mile delivery, logistics, and urban transportation. Adoption is reinforced by government subsidies, favorable policies for new energy vehicles, and expansion of charging infrastructure in urban centers. Domestic manufacturers focus on high-capacity battery systems, energy efficiency, and connectivity features to optimize fleet operations. Integration with telematics and route management software enhances operational efficiency and reduces total cost of ownership.

  • China deployed over 60,000 electric vans in commercial and logistics sectors in 2023.
  • Companies such as BYD, SAIC Motor, and Maxus expanded production of electric vans with long range and high payload capacity.
  • Urban delivery and last-mile logistics contributed to nearly 55% of total adoption.

Market Dynamics of Electric Vans in India

India is expected to grow at a CAGR of 19.4%, supported by increasing e-commerce and urban delivery services, government incentives for electric commercial vehicles, and expanding charging networks. Adoption is reinforced by demand for low operating cost, zero-emission, and high-efficiency vans for last-mile logistics. Manufacturers are introducing electric vans with improved battery life, cargo space, and telematics integration to attract fleet operators and SMEs.
  • India deployed over 15,000 electric vans in 2023, primarily for urban logistics and courier services.
  • Companies such as Mahindra Electric, Tata Motors, and Ashok Leyland launched high capacity and energy efficient electric vans.
  • Last-mile delivery and e-commerce logistics accounted for nearly 60% of adoption.

Growth Analysis of Electric Vans Market in Germany

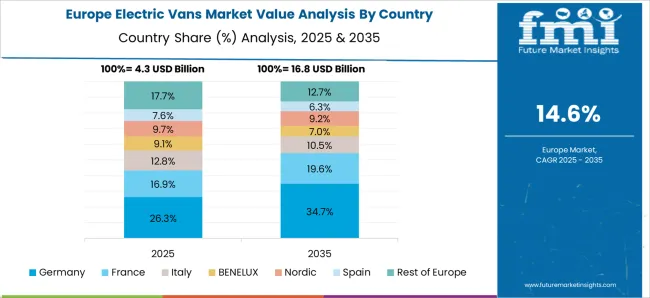
Electric Vans Market Europe Country Market Share Analysis, 2025 & 2035

Germany is forecast to grow at a CAGR of 17.8%, driven by stringent emissions regulations, demand for sustainable commercial fleets, and rising e-commerce delivery volumes. Adoption is reinforced by electric vans offering high payload capacity, long range, and advanced telematics. Fleet operators and logistics companies prioritize operational efficiency, reduced fuel costs, and compliance with EU low emission zones.

  • Germany deployed over 12,000 electric vans in 2023, primarily for commercial and urban delivery operations.
  • Companies such as Volkswagen, Mercedes-Benz, and MAN introduced electric vans with modular cargo solutions and extended battery range.
  • Urban logistics and delivery accounted for nearly 50% of adoption.

Future Outlook of Electric Vans Market in the United Kingdom

The United Kingdom is projected to grow at a CAGR of 14.7%, supported by increasing demand for electric commercial vehicles, government incentives, and emissions regulations. Adoption is reinforced by fleet operators prioritizing zero emission solutions for urban deliveries and light transport. Manufacturers emphasize high energy density batteries, payload optimization, and integration with fleet management systems to improve efficiency and reliability.
  • The UK deployed over 8,500 electric vans in 2023 across logistics and service sectors.
  • Companies such as Arrival, Ford UK, and Nissan introduced energy efficient and connected electric vans.
  • Urban delivery and service fleets contributed to nearly 55% of adoption.

Market Trends of Electric Vans in the United States

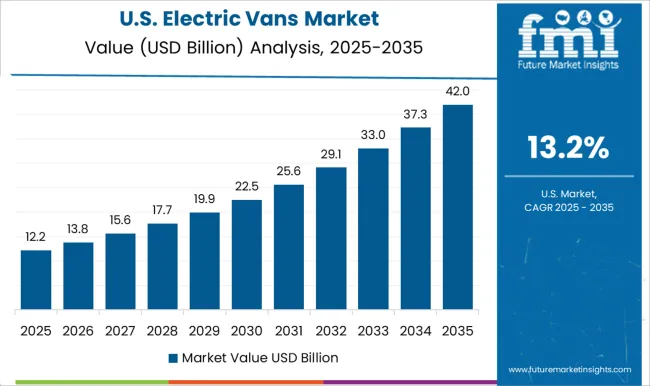
Electric Vans Market Country Value Analysis

The United States is projected to grow at a CAGR of 13.2%, driven by adoption of electric commercial vehicles in logistics, courier services, and utility operations. Demand is reinforced by rising fuel costs, environmental regulations, and expansion of electric charging infrastructure. Manufacturers focus on energy efficient battery packs, telematics integration, and payload optimization for fleet operators. Growth is supported by increasing partnerships between EV manufacturers and delivery service providers.
  • The US deployed over 25,000 electric vans in 2023, primarily for commercial delivery and utility fleets.
  • Companies such as Ford, Rivian, and Workhorse introduced electric vans with extended range and telematics solutions.
  • Last-mile logistics and utility service applications represented nearly 60% of adoption.

Competitive Landscape of Electric Vans Market

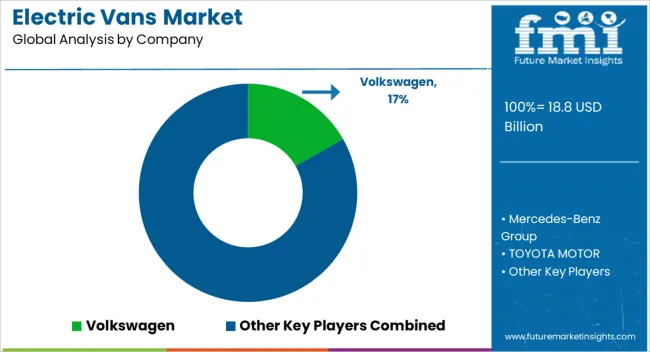
Electric Vans Market Analysis By Company

The market features a mix of established automotive giants, regional manufacturers, and innovative EV startups, focusing on commercial, logistics, and urban transport solutions. Global legacy automakers include Volkswagen, Mercedes-Benz Group, Toyota Motor, Nissan Motor, Renault, Stellantis, Ford, General Motors, Hyundai, and Kia, offering a range of electric vans with high reliability, brand recognition, and global service networks.

These players emphasize battery efficiency, range, connectivity, and fleet management solutions. EV-focused newcomers and innovators such as Rivian Automotive, Arrival, Canoo, Bollinger Motors, Workhorse Group, Xos Trucks, Lordstown Motors, BYD, Maxus (SAIC Motor), and Dongfeng Motor provide modular designs, lightweight platforms, and advanced electric drivetrains targeted at urban delivery, last-mile logistics, and specialty commercial transport.

Tier-2 regional manufacturers and OEM collaborators include Mahindra Electric, Changan Automobile, Foton Motor, BAIC Motor, JAC Motors, Fuso (Daimler Truck), Groupe PSA Vans, and Nikola Corporation, supporting market penetration in Asia, Europe, and North America. Competition is shaped by battery technology, payload capacity, charging infrastructure, total cost of ownership, and fleet connectivity solutions, making both traditional automakers and EV startups critical in driving adoption and innovation.

Key Players in the Electric Vans Market

  • Volkswagen
  • Mercedes-Benz Group
  • TOYOTA MOTOR
  • Renault
  • Nissan Motor
  • Stellantis
  • Rivian Automotive
  • Arrival
  • Canoo
  • Bollinger Motors

Scope of the Report

Item Value
Quantitative Units USD 18.8 Billion
Propulsion BEV, HEV, FCEV, and PHEV
Range Above 200 miles, Upto 100 miles, and 100 to 200 miles
Vehicle Type Commercial vehicle and Passenger vehicle
Battery Type Lithium Ion, Sealed Lead Acid, and Nickel Metal Hydride (NiMH)
Regions Covered North America, Europe, Asia-Pacific, Latin America, Middle East & Africa
Country Covered United States, Canada, Germany, France, United Kingdom, China, Japan, India, Brazil, South Africa
Key Companies Profiled Volkswagen, Mercedes-Benz Group, TOYOTA MOTOR, Renault, Nissan Motor, Stellantis, Rivian Automotive, Arrival, Canoo, and Bollinger Motors
Additional Attributes Dollar sales by van type and application, demand dynamics across last-mile delivery, passenger transport, and commercial fleets, regional trends in electric mobility adoption, innovation in battery efficiency, load capacity, and connectivity, environmental impact of reduced emissions and energy consumption, and emerging use cases in urban logistics, shared mobility, and sustainable fleet operations.

Electric Vans Market by Segments

Propulsion:

  • BEV
  • HEV
  • FCEV
  • PHEV

Range:

  • Above 200 miles
  • Upto 100 miles
  • 100 to 200 miles

Vehicle Type:

  • Commercial vehicle
  • Passenger vehicle

Battery Type:

  • Lithium Ion
  • Sealed Lead Acid
  • Nickel Metal Hydride (NiMH)

Region:

  • North America
    • USA
    • Canada
    • Mexico
  • Latin America
    • Brazil
    • Chile
    • Rest of Latin America
  • Western Europe
    • Germany
    • UK
    • Italy
    • Spain
    • France
    • Nordic
    • BENELUX
    • Rest of Western Europe
  • Eastern Europe
    • Russia
    • Poland
    • Hungary
    • Balkan & Baltic
    • Rest of Eastern Europe
  • East Asia
    • China
    • Japan
    • South Korea
  • South Asia and Pacific
    • India
    • ASEAN
    • Australia & New Zealand
    • Rest of South Asia and Pacific
  • Middle East & Africa
    • Kingdom of Saudi Arabia
    • Other GCC Countries
    • Turkiye
    • South Africa
    • Other African Union
    • Rest of Middle East & Africa

Table of Content

  1. Executive Summary
    • Global Market Outlook
    • Demand-side Trends
    • Supply-side Trends
    • Technology Roadmap Analysis
    • Analysis and Recommendations
  2. Market Overview
    • Market Coverage / Taxonomy
    • Market Definition / Scope / Limitations
  3. Market Background
    • Market Dynamics
      • Drivers
      • Restraints
      • Opportunity
      • Trends
    • Scenario Forecast
      • Demand in Optimistic Scenario
      • Demand in Likely Scenario
      • Demand in Conservative Scenario
    • Opportunity Map Analysis
    • Product Life Cycle Analysis
    • Supply Chain Analysis
    • Investment Feasibility Matrix
    • Value Chain Analysis
    • PESTLE and Porter’s Analysis
    • Regulatory Landscape
    • Regional Parent Market Outlook
    • Production and Consumption Statistics
    • Import and Export Statistics
  4. Global Electric Vans Market Analysis 2020-2024 and Forecast, 2025-2035
    • Historical Market Size Value (USD Mn) Analysis, 2020-2024
    • Current and Future Market Size Value (USD Mn) Projections, 2025-2035
      • Y-o-Y Growth Trend Analysis
      • Absolute $ Opportunity Analysis
  5. Global Electric Vans Market Pricing Analysis 2020-2024 and Forecast 2025-2035
  6. Global Electric Vans Market Analysis 2020-2024 and Forecast 2025-2035, By Propulsion
    • Introduction / Key Findings
    • Historical Market Size Value (USD Mn) Analysis By Propulsion , 2020-2024
    • Current and Future Market Size Value (USD Mn) Analysis and Forecast By Propulsion , 2025-2035
      • BEV
      • HEV
      • FCEV
      • PHEV
    • Y-o-Y Growth Trend Analysis By Propulsion , 2020-2024
    • Absolute $ Opportunity Analysis By Propulsion , 2025-2035
  7. Global Electric Vans Market Analysis 2020-2024 and Forecast 2025-2035, By Range
    • Introduction / Key Findings
    • Historical Market Size Value (USD Mn) Analysis By Range, 2020-2024
    • Current and Future Market Size Value (USD Mn) Analysis and Forecast By Range, 2025-2035
      • Above 200 miles
      • Upto 100 miles
      • 100 to 200 miles
    • Y-o-Y Growth Trend Analysis By Range, 2020-2024
    • Absolute $ Opportunity Analysis By Range, 2025-2035
  8. Global Electric Vans Market Analysis 2020-2024 and Forecast 2025-2035, By Vehicle Type
    • Introduction / Key Findings
    • Historical Market Size Value (USD Mn) Analysis By Vehicle Type, 2020-2024
    • Current and Future Market Size Value (USD Mn) Analysis and Forecast By Vehicle Type, 2025-2035
      • Commercial vehicle
      • Passenger vehicle
    • Y-o-Y Growth Trend Analysis By Vehicle Type, 2020-2024
    • Absolute $ Opportunity Analysis By Vehicle Type, 2025-2035
  9. Global Electric Vans Market Analysis 2020-2024 and Forecast 2025-2035, By Battery Type
    • Introduction / Key Findings
    • Historical Market Size Value (USD Mn) Analysis By Battery Type, 2020-2024
    • Current and Future Market Size Value (USD Mn) Analysis and Forecast By Battery Type, 2025-2035
      • Lithium Ion
      • Sealed Lead Acid
      • Nickel Metal Hydride (NiMH)
    • Y-o-Y Growth Trend Analysis By Battery Type, 2020-2024
    • Absolute $ Opportunity Analysis By Battery Type, 2025-2035
  10. Global Electric Vans Market Analysis 2020-2024 and Forecast 2025-2035, By Region
    • Introduction
    • Historical Market Size Value (USD Mn) Analysis By Region, 2020-2024
    • Current Market Size Value (USD Mn) Analysis and Forecast By Region, 2025-2035
      • North America
      • Latin America
      • Western Europe
      • Eastern Europe
      • East Asia
      • South Asia and Pacific
      • Middle East & Africa
    • Market Attractiveness Analysis By Region
  11. North America Electric Vans Market Analysis 2020-2024 and Forecast 2025-2035, By Country
    • Historical Market Size Value (USD Mn) Trend Analysis By Market Taxonomy, 2020-2024
    • Market Size Value (USD Mn) Forecast By Market Taxonomy, 2025-2035
      • By Country
        • USA
        • Canada
        • Mexico
      • By Propulsion
      • By Range
      • By Vehicle Type
      • By Battery Type
    • Market Attractiveness Analysis
      • By Country
      • By Propulsion
      • By Range
      • By Vehicle Type
      • By Battery Type
    • Key Takeaways
  12. Latin America Electric Vans Market Analysis 2020-2024 and Forecast 2025-2035, By Country
    • Historical Market Size Value (USD Mn) Trend Analysis By Market Taxonomy, 2020-2024
    • Market Size Value (USD Mn) Forecast By Market Taxonomy, 2025-2035
      • By Country
        • Brazil
        • Chile
        • Rest of Latin America
      • By Propulsion
      • By Range
      • By Vehicle Type
      • By Battery Type
    • Market Attractiveness Analysis
      • By Country
      • By Propulsion
      • By Range
      • By Vehicle Type
      • By Battery Type
    • Key Takeaways
  13. Western Europe Electric Vans Market Analysis 2020-2024 and Forecast 2025-2035, By Country
    • Historical Market Size Value (USD Mn) Trend Analysis By Market Taxonomy, 2020-2024
    • Market Size Value (USD Mn) Forecast By Market Taxonomy, 2025-2035
      • By Country
        • Germany
        • UK
        • Italy
        • Spain
        • France
        • Nordic
        • BENELUX
        • Rest of Western Europe
      • By Propulsion
      • By Range
      • By Vehicle Type
      • By Battery Type
    • Market Attractiveness Analysis
      • By Country
      • By Propulsion
      • By Range
      • By Vehicle Type
      • By Battery Type
    • Key Takeaways
  14. Eastern Europe Electric Vans Market Analysis 2020-2024 and Forecast 2025-2035, By Country
    • Historical Market Size Value (USD Mn) Trend Analysis By Market Taxonomy, 2020-2024
    • Market Size Value (USD Mn) Forecast By Market Taxonomy, 2025-2035
      • By Country
        • Russia
        • Poland
        • Hungary
        • Balkan & Baltic
        • Rest of Eastern Europe
      • By Propulsion
      • By Range
      • By Vehicle Type
      • By Battery Type
    • Market Attractiveness Analysis
      • By Country
      • By Propulsion
      • By Range
      • By Vehicle Type
      • By Battery Type
    • Key Takeaways
  15. East Asia Electric Vans Market Analysis 2020-2024 and Forecast 2025-2035, By Country
    • Historical Market Size Value (USD Mn) Trend Analysis By Market Taxonomy, 2020-2024
    • Market Size Value (USD Mn) Forecast By Market Taxonomy, 2025-2035
      • By Country
        • China
        • Japan
        • South Korea
      • By Propulsion
      • By Range
      • By Vehicle Type
      • By Battery Type
    • Market Attractiveness Analysis
      • By Country
      • By Propulsion
      • By Range
      • By Vehicle Type
      • By Battery Type
    • Key Takeaways
  16. South Asia and Pacific Electric Vans Market Analysis 2020-2024 and Forecast 2025-2035, By Country
    • Historical Market Size Value (USD Mn) Trend Analysis By Market Taxonomy, 2020-2024
    • Market Size Value (USD Mn) Forecast By Market Taxonomy, 2025-2035
      • By Country
        • India
        • ASEAN
        • Australia & New Zealand
        • Rest of South Asia and Pacific
      • By Propulsion
      • By Range
      • By Vehicle Type
      • By Battery Type
    • Market Attractiveness Analysis
      • By Country
      • By Propulsion
      • By Range
      • By Vehicle Type
      • By Battery Type
    • Key Takeaways
  17. Middle East & Africa Electric Vans Market Analysis 2020-2024 and Forecast 2025-2035, By Country
    • Historical Market Size Value (USD Mn) Trend Analysis By Market Taxonomy, 2020-2024
    • Market Size Value (USD Mn) Forecast By Market Taxonomy, 2025-2035
      • By Country
        • Kingdom of Saudi Arabia
        • Other GCC Countries
        • Turkiye
        • South Africa
        • Other African Union
        • Rest of Middle East & Africa
      • By Propulsion
      • By Range
      • By Vehicle Type
      • By Battery Type
    • Market Attractiveness Analysis
      • By Country
      • By Propulsion
      • By Range
      • By Vehicle Type
      • By Battery Type
    • Key Takeaways
  18. Key Countries Electric Vans Market Analysis
    • USA
      • Pricing Analysis
      • Market Share Analysis, 2024
        • By Propulsion
        • By Range
        • By Vehicle Type
        • By Battery Type
    • Canada
      • Pricing Analysis
      • Market Share Analysis, 2024
        • By Propulsion
        • By Range
        • By Vehicle Type
        • By Battery Type
    • Mexico
      • Pricing Analysis
      • Market Share Analysis, 2024
        • By Propulsion
        • By Range
        • By Vehicle Type
        • By Battery Type
    • Brazil
      • Pricing Analysis
      • Market Share Analysis, 2024
        • By Propulsion
        • By Range
        • By Vehicle Type
        • By Battery Type
    • Chile
      • Pricing Analysis
      • Market Share Analysis, 2024
        • By Propulsion
        • By Range
        • By Vehicle Type
        • By Battery Type
    • Germany
      • Pricing Analysis
      • Market Share Analysis, 2024
        • By Propulsion
        • By Range
        • By Vehicle Type
        • By Battery Type
    • UK
      • Pricing Analysis
      • Market Share Analysis, 2024
        • By Propulsion
        • By Range
        • By Vehicle Type
        • By Battery Type
    • Italy
      • Pricing Analysis
      • Market Share Analysis, 2024
        • By Propulsion
        • By Range
        • By Vehicle Type
        • By Battery Type
    • Spain
      • Pricing Analysis
      • Market Share Analysis, 2024
        • By Propulsion
        • By Range
        • By Vehicle Type
        • By Battery Type
    • France
      • Pricing Analysis
      • Market Share Analysis, 2024
        • By Propulsion
        • By Range
        • By Vehicle Type
        • By Battery Type
    • India
      • Pricing Analysis
      • Market Share Analysis, 2024
        • By Propulsion
        • By Range
        • By Vehicle Type
        • By Battery Type
    • ASEAN
      • Pricing Analysis
      • Market Share Analysis, 2024
        • By Propulsion
        • By Range
        • By Vehicle Type
        • By Battery Type
    • Australia & New Zealand
      • Pricing Analysis
      • Market Share Analysis, 2024
        • By Propulsion
        • By Range
        • By Vehicle Type
        • By Battery Type
    • China
      • Pricing Analysis
      • Market Share Analysis, 2024
        • By Propulsion
        • By Range
        • By Vehicle Type
        • By Battery Type
    • Japan
      • Pricing Analysis
      • Market Share Analysis, 2024
        • By Propulsion
        • By Range
        • By Vehicle Type
        • By Battery Type
    • South Korea
      • Pricing Analysis
      • Market Share Analysis, 2024
        • By Propulsion
        • By Range
        • By Vehicle Type
        • By Battery Type
    • Russia
      • Pricing Analysis
      • Market Share Analysis, 2024
        • By Propulsion
        • By Range
        • By Vehicle Type
        • By Battery Type
    • Poland
      • Pricing Analysis
      • Market Share Analysis, 2024
        • By Propulsion
        • By Range
        • By Vehicle Type
        • By Battery Type
    • Hungary
      • Pricing Analysis
      • Market Share Analysis, 2024
        • By Propulsion
        • By Range
        • By Vehicle Type
        • By Battery Type
    • Kingdom of Saudi Arabia
      • Pricing Analysis
      • Market Share Analysis, 2024
        • By Propulsion
        • By Range
        • By Vehicle Type
        • By Battery Type
    • Turkiye
      • Pricing Analysis
      • Market Share Analysis, 2024
        • By Propulsion
        • By Range
        • By Vehicle Type
        • By Battery Type
    • South Africa
      • Pricing Analysis
      • Market Share Analysis, 2024
        • By Propulsion
        • By Range
        • By Vehicle Type
        • By Battery Type
  19. Market Structure Analysis
    • Competition Dashboard
    • Competition Benchmarking
    • Market Share Analysis of Top Players
      • By Regional
      • By Propulsion
      • By Range
      • By Vehicle Type
      • By Battery Type
  20. Competition Analysis
    • Competition Deep Dive
      • Volkswagen
        • Overview
        • Product Portfolio
        • Profitability by Market Segments (Product/Age /Sales Channel/Region)
        • Sales Footprint
        • Strategy Overview
          • Marketing Strategy
          • Product Strategy
          • Channel Strategy
      • Mercedes-Benz Group
      • TOYOTA MOTOR
      • Renault
      • Nissan Motor
      • Stellantis
      • Rivian Automotive
      • Arrival
      • Canoo
      • Bollinger Motors
  21. Assumptions & Acronyms Used
  22. Research Methodology

List of Tables

  • Table 1: Global Electric Vans Market Value (USD Mn) Forecast by Region, 2020-2035
  • Table 2: Global Electric Vans Market Value (USD Mn) Forecast by Propulsion , 2020-2035
  • Table 3: Global Electric Vans Market Value (USD Mn) Forecast by Range, 2020-2035
  • Table 4: Global Electric Vans Market Value (USD Mn) Forecast by Vehicle Type, 2020-2035
  • Table 5: Global Electric Vans Market Value (USD Mn) Forecast by Battery Type, 2020-2035
  • Table 6: North America Electric Vans Market Value (USD Mn) Forecast by Country, 2020-2035
  • Table 7: North America Electric Vans Market Value (USD Mn) Forecast by Propulsion , 2020-2035
  • Table 8: North America Electric Vans Market Value (USD Mn) Forecast by Range, 2020-2035
  • Table 9: North America Electric Vans Market Value (USD Mn) Forecast by Vehicle Type, 2020-2035
  • Table 10: North America Electric Vans Market Value (USD Mn) Forecast by Battery Type, 2020-2035
  • Table 11: Latin America Electric Vans Market Value (USD Mn) Forecast by Country, 2020-2035
  • Table 12: Latin America Electric Vans Market Value (USD Mn) Forecast by Propulsion , 2020-2035
  • Table 13: Latin America Electric Vans Market Value (USD Mn) Forecast by Range, 2020-2035
  • Table 14: Latin America Electric Vans Market Value (USD Mn) Forecast by Vehicle Type, 2020-2035
  • Table 15: Latin America Electric Vans Market Value (USD Mn) Forecast by Battery Type, 2020-2035
  • Table 16: Western Europe Electric Vans Market Value (USD Mn) Forecast by Country, 2020-2035
  • Table 17: Western Europe Electric Vans Market Value (USD Mn) Forecast by Propulsion , 2020-2035
  • Table 18: Western Europe Electric Vans Market Value (USD Mn) Forecast by Range, 2020-2035
  • Table 19: Western Europe Electric Vans Market Value (USD Mn) Forecast by Vehicle Type, 2020-2035
  • Table 20: Western Europe Electric Vans Market Value (USD Mn) Forecast by Battery Type, 2020-2035
  • Table 21: Eastern Europe Electric Vans Market Value (USD Mn) Forecast by Country, 2020-2035
  • Table 22: Eastern Europe Electric Vans Market Value (USD Mn) Forecast by Propulsion , 2020-2035
  • Table 23: Eastern Europe Electric Vans Market Value (USD Mn) Forecast by Range, 2020-2035
  • Table 24: Eastern Europe Electric Vans Market Value (USD Mn) Forecast by Vehicle Type, 2020-2035
  • Table 25: Eastern Europe Electric Vans Market Value (USD Mn) Forecast by Battery Type, 2020-2035
  • Table 26: East Asia Electric Vans Market Value (USD Mn) Forecast by Country, 2020-2035
  • Table 27: East Asia Electric Vans Market Value (USD Mn) Forecast by Propulsion , 2020-2035
  • Table 28: East Asia Electric Vans Market Value (USD Mn) Forecast by Range, 2020-2035
  • Table 29: East Asia Electric Vans Market Value (USD Mn) Forecast by Vehicle Type, 2020-2035
  • Table 30: East Asia Electric Vans Market Value (USD Mn) Forecast by Battery Type, 2020-2035
  • Table 31: South Asia and Pacific Electric Vans Market Value (USD Mn) Forecast by Country, 2020-2035
  • Table 32: South Asia and Pacific Electric Vans Market Value (USD Mn) Forecast by Propulsion , 2020-2035
  • Table 33: South Asia and Pacific Electric Vans Market Value (USD Mn) Forecast by Range, 2020-2035
  • Table 34: South Asia and Pacific Electric Vans Market Value (USD Mn) Forecast by Vehicle Type, 2020-2035
  • Table 35: South Asia and Pacific Electric Vans Market Value (USD Mn) Forecast by Battery Type, 2020-2035
  • Table 36: Middle East & Africa Electric Vans Market Value (USD Mn) Forecast by Country, 2020-2035
  • Table 37: Middle East & Africa Electric Vans Market Value (USD Mn) Forecast by Propulsion , 2020-2035
  • Table 38: Middle East & Africa Electric Vans Market Value (USD Mn) Forecast by Range, 2020-2035
  • Table 39: Middle East & Africa Electric Vans Market Value (USD Mn) Forecast by Vehicle Type, 2020-2035
  • Table 40: Middle East & Africa Electric Vans Market Value (USD Mn) Forecast by Battery Type, 2020-2035

List of Figures

  • Figure 1: Global Electric Vans Market Pricing Analysis
  • Figure 2: Global Electric Vans Market Value (USD Mn) Forecast 2020–2035
  • Figure 3: Global Electric Vans Market Value Share and BPS Analysis by Propulsion , 2025 and 2035
  • Figure 4: Global Electric Vans Market Y-o-Y Growth Comparison by Propulsion , 2025–2035
  • Figure 5: Global Electric Vans Market Attractiveness Analysis by Propulsion
  • Figure 6: Global Electric Vans Market Value Share and BPS Analysis by Range, 2025 and 2035
  • Figure 7: Global Electric Vans Market Y-o-Y Growth Comparison by Range, 2025–2035
  • Figure 8: Global Electric Vans Market Attractiveness Analysis by Range
  • Figure 9: Global Electric Vans Market Value Share and BPS Analysis by Vehicle Type, 2025 and 2035
  • Figure 10: Global Electric Vans Market Y-o-Y Growth Comparison by Vehicle Type, 2025–2035
  • Figure 11: Global Electric Vans Market Attractiveness Analysis by Vehicle Type
  • Figure 12: Global Electric Vans Market Value Share and BPS Analysis by Battery Type, 2025 and 2035
  • Figure 13: Global Electric Vans Market Y-o-Y Growth Comparison by Battery Type, 2025–2035
  • Figure 14: Global Electric Vans Market Attractiveness Analysis by Battery Type
  • Figure 15: Global Electric Vans Market Value (USD Mn) Share and BPS Analysis by Region, 2025 and 2035
  • Figure 16: Global Electric Vans Market Y-o-Y Growth Comparison by Region, 2025–2035
  • Figure 17: Global Electric Vans Market Attractiveness Analysis by Region
  • Figure 18: North America Electric Vans Market Incremental Dollar Opportunity, 2025–2035
  • Figure 19: Latin America Electric Vans Market Incremental Dollar Opportunity, 2025–2035
  • Figure 20: Western Europe Electric Vans Market Incremental Dollar Opportunity, 2025–2035
  • Figure 21: Eastern Europe Electric Vans Market Incremental Dollar Opportunity, 2025–2035
  • Figure 22: East Asia Electric Vans Market Incremental Dollar Opportunity, 2025–2035
  • Figure 23: South Asia and Pacific Electric Vans Market Incremental Dollar Opportunity, 2025–2035
  • Figure 24: Middle East & Africa Electric Vans Market Incremental Dollar Opportunity, 2025–2035
  • Figure 25: North America Electric Vans Market Value Share and BPS Analysis by Country, 2025 and 2035
  • Figure 26: North America Electric Vans Market Value Share and BPS Analysis by Propulsion , 2025 and 2035
  • Figure 27: North America Electric Vans Market Y-o-Y Growth Comparison by Propulsion , 2025–2035
  • Figure 28: North America Electric Vans Market Attractiveness Analysis by Propulsion
  • Figure 29: North America Electric Vans Market Value Share and BPS Analysis by Range, 2025 and 2035
  • Figure 30: North America Electric Vans Market Y-o-Y Growth Comparison by Range, 2025–2035
  • Figure 31: North America Electric Vans Market Attractiveness Analysis by Range
  • Figure 32: North America Electric Vans Market Value Share and BPS Analysis by Vehicle Type, 2025 and 2035
  • Figure 33: North America Electric Vans Market Y-o-Y Growth Comparison by Vehicle Type, 2025–2035
  • Figure 34: North America Electric Vans Market Attractiveness Analysis by Vehicle Type
  • Figure 35: North America Electric Vans Market Value Share and BPS Analysis by Battery Type, 2025 and 2035
  • Figure 36: North America Electric Vans Market Y-o-Y Growth Comparison by Battery Type, 2025–2035
  • Figure 37: North America Electric Vans Market Attractiveness Analysis by Battery Type
  • Figure 38: Latin America Electric Vans Market Value Share and BPS Analysis by Country, 2025 and 2035
  • Figure 39: Latin America Electric Vans Market Value Share and BPS Analysis by Propulsion , 2025 and 2035
  • Figure 40: Latin America Electric Vans Market Y-o-Y Growth Comparison by Propulsion , 2025–2035
  • Figure 41: Latin America Electric Vans Market Attractiveness Analysis by Propulsion
  • Figure 42: Latin America Electric Vans Market Value Share and BPS Analysis by Range, 2025 and 2035
  • Figure 43: Latin America Electric Vans Market Y-o-Y Growth Comparison by Range, 2025–2035
  • Figure 44: Latin America Electric Vans Market Attractiveness Analysis by Range
  • Figure 45: Latin America Electric Vans Market Value Share and BPS Analysis by Vehicle Type, 2025 and 2035
  • Figure 46: Latin America Electric Vans Market Y-o-Y Growth Comparison by Vehicle Type, 2025–2035
  • Figure 47: Latin America Electric Vans Market Attractiveness Analysis by Vehicle Type
  • Figure 48: Latin America Electric Vans Market Value Share and BPS Analysis by Battery Type, 2025 and 2035
  • Figure 49: Latin America Electric Vans Market Y-o-Y Growth Comparison by Battery Type, 2025–2035
  • Figure 50: Latin America Electric Vans Market Attractiveness Analysis by Battery Type
  • Figure 51: Western Europe Electric Vans Market Value Share and BPS Analysis by Country, 2025 and 2035
  • Figure 52: Western Europe Electric Vans Market Value Share and BPS Analysis by Propulsion , 2025 and 2035
  • Figure 53: Western Europe Electric Vans Market Y-o-Y Growth Comparison by Propulsion , 2025–2035
  • Figure 54: Western Europe Electric Vans Market Attractiveness Analysis by Propulsion
  • Figure 55: Western Europe Electric Vans Market Value Share and BPS Analysis by Range, 2025 and 2035
  • Figure 56: Western Europe Electric Vans Market Y-o-Y Growth Comparison by Range, 2025–2035
  • Figure 57: Western Europe Electric Vans Market Attractiveness Analysis by Range
  • Figure 58: Western Europe Electric Vans Market Value Share and BPS Analysis by Vehicle Type, 2025 and 2035
  • Figure 59: Western Europe Electric Vans Market Y-o-Y Growth Comparison by Vehicle Type, 2025–2035
  • Figure 60: Western Europe Electric Vans Market Attractiveness Analysis by Vehicle Type
  • Figure 61: Western Europe Electric Vans Market Value Share and BPS Analysis by Battery Type, 2025 and 2035
  • Figure 62: Western Europe Electric Vans Market Y-o-Y Growth Comparison by Battery Type, 2025–2035
  • Figure 63: Western Europe Electric Vans Market Attractiveness Analysis by Battery Type
  • Figure 64: Eastern Europe Electric Vans Market Value Share and BPS Analysis by Country, 2025 and 2035
  • Figure 65: Eastern Europe Electric Vans Market Value Share and BPS Analysis by Propulsion , 2025 and 2035
  • Figure 66: Eastern Europe Electric Vans Market Y-o-Y Growth Comparison by Propulsion , 2025–2035
  • Figure 67: Eastern Europe Electric Vans Market Attractiveness Analysis by Propulsion
  • Figure 68: Eastern Europe Electric Vans Market Value Share and BPS Analysis by Range, 2025 and 2035
  • Figure 69: Eastern Europe Electric Vans Market Y-o-Y Growth Comparison by Range, 2025–2035
  • Figure 70: Eastern Europe Electric Vans Market Attractiveness Analysis by Range
  • Figure 71: Eastern Europe Electric Vans Market Value Share and BPS Analysis by Vehicle Type, 2025 and 2035
  • Figure 72: Eastern Europe Electric Vans Market Y-o-Y Growth Comparison by Vehicle Type, 2025–2035
  • Figure 73: Eastern Europe Electric Vans Market Attractiveness Analysis by Vehicle Type
  • Figure 74: Eastern Europe Electric Vans Market Value Share and BPS Analysis by Battery Type, 2025 and 2035
  • Figure 75: Eastern Europe Electric Vans Market Y-o-Y Growth Comparison by Battery Type, 2025–2035
  • Figure 76: Eastern Europe Electric Vans Market Attractiveness Analysis by Battery Type
  • Figure 77: East Asia Electric Vans Market Value Share and BPS Analysis by Country, 2025 and 2035
  • Figure 78: East Asia Electric Vans Market Value Share and BPS Analysis by Propulsion , 2025 and 2035
  • Figure 79: East Asia Electric Vans Market Y-o-Y Growth Comparison by Propulsion , 2025–2035
  • Figure 80: East Asia Electric Vans Market Attractiveness Analysis by Propulsion
  • Figure 81: East Asia Electric Vans Market Value Share and BPS Analysis by Range, 2025 and 2035
  • Figure 82: East Asia Electric Vans Market Y-o-Y Growth Comparison by Range, 2025–2035
  • Figure 83: East Asia Electric Vans Market Attractiveness Analysis by Range
  • Figure 84: East Asia Electric Vans Market Value Share and BPS Analysis by Vehicle Type, 2025 and 2035
  • Figure 85: East Asia Electric Vans Market Y-o-Y Growth Comparison by Vehicle Type, 2025–2035
  • Figure 86: East Asia Electric Vans Market Attractiveness Analysis by Vehicle Type
  • Figure 87: East Asia Electric Vans Market Value Share and BPS Analysis by Battery Type, 2025 and 2035
  • Figure 88: East Asia Electric Vans Market Y-o-Y Growth Comparison by Battery Type, 2025–2035
  • Figure 89: East Asia Electric Vans Market Attractiveness Analysis by Battery Type
  • Figure 90: South Asia and Pacific Electric Vans Market Value Share and BPS Analysis by Country, 2025 and 2035
  • Figure 91: South Asia and Pacific Electric Vans Market Value Share and BPS Analysis by Propulsion , 2025 and 2035
  • Figure 92: South Asia and Pacific Electric Vans Market Y-o-Y Growth Comparison by Propulsion , 2025–2035
  • Figure 93: South Asia and Pacific Electric Vans Market Attractiveness Analysis by Propulsion
  • Figure 94: South Asia and Pacific Electric Vans Market Value Share and BPS Analysis by Range, 2025 and 2035
  • Figure 95: South Asia and Pacific Electric Vans Market Y-o-Y Growth Comparison by Range, 2025–2035
  • Figure 96: South Asia and Pacific Electric Vans Market Attractiveness Analysis by Range
  • Figure 97: South Asia and Pacific Electric Vans Market Value Share and BPS Analysis by Vehicle Type, 2025 and 2035
  • Figure 98: South Asia and Pacific Electric Vans Market Y-o-Y Growth Comparison by Vehicle Type, 2025–2035
  • Figure 99: South Asia and Pacific Electric Vans Market Attractiveness Analysis by Vehicle Type
  • Figure 100: South Asia and Pacific Electric Vans Market Value Share and BPS Analysis by Battery Type, 2025 and 2035
  • Figure 101: South Asia and Pacific Electric Vans Market Y-o-Y Growth Comparison by Battery Type, 2025–2035
  • Figure 102: South Asia and Pacific Electric Vans Market Attractiveness Analysis by Battery Type
  • Figure 103: Middle East & Africa Electric Vans Market Value Share and BPS Analysis by Country, 2025 and 2035
  • Figure 104: Middle East & Africa Electric Vans Market Value Share and BPS Analysis by Propulsion , 2025 and 2035
  • Figure 105: Middle East & Africa Electric Vans Market Y-o-Y Growth Comparison by Propulsion , 2025–2035
  • Figure 106: Middle East & Africa Electric Vans Market Attractiveness Analysis by Propulsion
  • Figure 107: Middle East & Africa Electric Vans Market Value Share and BPS Analysis by Range, 2025 and 2035
  • Figure 108: Middle East & Africa Electric Vans Market Y-o-Y Growth Comparison by Range, 2025–2035
  • Figure 109: Middle East & Africa Electric Vans Market Attractiveness Analysis by Range
  • Figure 110: Middle East & Africa Electric Vans Market Value Share and BPS Analysis by Vehicle Type, 2025 and 2035
  • Figure 111: Middle East & Africa Electric Vans Market Y-o-Y Growth Comparison by Vehicle Type, 2025–2035
  • Figure 112: Middle East & Africa Electric Vans Market Attractiveness Analysis by Vehicle Type
  • Figure 113: Middle East & Africa Electric Vans Market Value Share and BPS Analysis by Battery Type, 2025 and 2035
  • Figure 114: Middle East & Africa Electric Vans Market Y-o-Y Growth Comparison by Battery Type, 2025–2035
  • Figure 115: Middle East & Africa Electric Vans Market Attractiveness Analysis by Battery Type
  • Figure 116: Global Electric Vans Market – Tier Structure Analysis
  • Figure 117: Global Electric Vans Market – Company Share Analysis

Frequently Asked Questions

How big is the electric vans market in 2025?

The global electric vans market is estimated to be valued at USD 18.8 billion in 2025.

What will be the size of electric vans market in 2035?

The market size for the electric vans market is projected to reach USD 79.5 billion by 2035.

How much will be the electric vans market growth between 2025 and 2035?

The electric vans market is expected to grow at a 15.5% CAGR between 2025 and 2035.

What are the key product types in the electric vans market?

The key product types in electric vans market are BEV, HEV, FCEV and PHEV.

Which range segment to contribute significant share in the electric vans market in 2025?

In terms of range, above 200 miles segment to command 39.5% share in the electric vans market in 2025.

Explore Similar Insights

Future Market Insights

Electric Vans Market

Chat With

MaRIA

Hi There, I am MaRIA, Your Market Research Intelligence Assistant. How may I help you?