

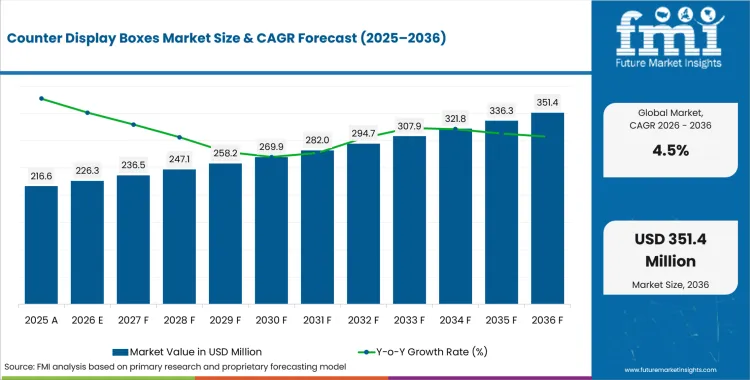
- Market Size (2026)
- USD 226.3 Mn
- Forecast (2036)
- USD 351.4 Mn
- CAGR (2026 to 2036)
- 4.5%
How big is Counter Display Boxes Market in 2026?
USD 226.3 million in 2026 and USD 351.4 million by 2036 at a 4.5% CAGR.
Demand for counter display boxes is projected to expand at 4.5% CAGR between 2026 and 2036, increasing valuation from USD 226.3 million to USD 351.4 million. Demand is attributable to high-turnover retail and foodservice environments where packaged snacks, confectionery, and convenience items compete for point-of-sale visibility. USDA Economic Research Service documented in July 2025 that food-away-from-home sales increased in all 50 states during 2024. The broad expansion in foodservice activity increases product movement through convenience/ takeaway and impulse-purchase channels where countertop merchandising remains common. Counter display box orders therefore benefit from recurring product launches and replenishment cycles rather than foodservice growth alone.
Country qualification paths differ because packaging rules enter force on different legal timetables. The European Commission confirmed in February 2025 that the Packaging and Packaging Waste Regulation had entered into force on February 11. Germany and France therefore move under a shared EU framework, whereas UK restaurant packaging follows a separate national route. For counter display boxes, these legal differences change material claims and recovery instructions before restaurant groups approve one format in several countries.
Key Takeaways of Counter Display Boxes Market
- Prepared-food and off-premise service sustain repeat box purchases because every takeaway meal requires qualified containment before handoff.
- Standard formats are estimated to hold 38.0% of format type demand in 2026, owing to approval speed.
- Paperboard is projected to represent 33.0% of material demand in 2026, supported by printable fiber structures.
- Standard meal sizes are forecast to hold 41.0% of format size demand in 2026, attributable to common meal portions.
- Material switching slows if menu tests expose weak grease resistance or disposal claims that conflict with local recovery routes.
- Some of the key players in this market include Dart Container, Graphic Packaging, Duni Group, Huhtamaki, Detmold Group, Novolex, Sabert, and Faerch.
Analyst Perspective
"Counter display boxes earn repeat business after one footprint controls heat and leakage without slowing restaurant packing. Commercial value depends on fewer stocked dimensions and disposal claims matching each account’s recovery route."
- Nandini Roy Choudhury, Principal Consultant, Future Market Insights
How is the Counter Display Boxes Market segmented?
The market is segmented by format type, material, format size, end use and sales channel.
Format type covers standard, recyclable-optimized, premium and custom-engineered structures, and material covers paperboard, molded fiber, rPET or PP, compostable polymers and aluminium. Format size covers standard meal, single-serve and family or catering packs, and end use covers QSR chains, delivery platforms, coffee or beverage service, institutional catering and retail deli. Sales channels include broadline distributors, direct chain contracts, packaging distributors and online ordering within the report scope. These axes separate disposable food containers by operating use and purchasing route instead of downstream food revenue.
What makes Standard formats central to the Format type category?
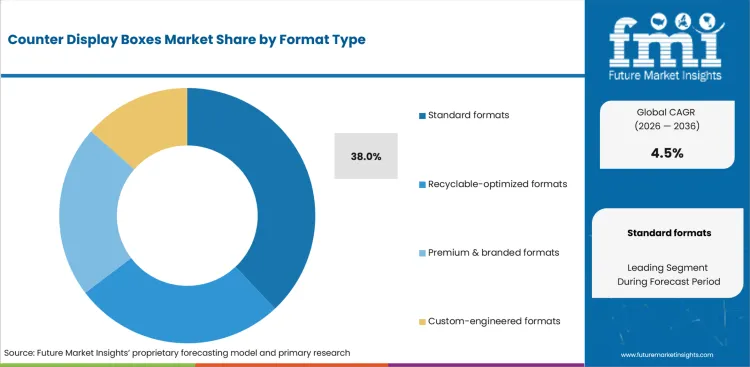
Standard formats shorten qualification because restaurant groups adopt existing footprints without funding new tooling for each menu change. Broadline distributors stock fewer takeaway container sizes after those footprints receive approval for multi-outlet accounts.
- Standard formats are estimated to hold 38.0% of format type demand in 2026, owing to quicker qualification and fewer stocked dimensions for repeat meal programs.
- Duni Group launched redesigned Octaview packaging in December 2025 with 11 formats for cold dishes. Its leak-proof stackable design shows how standard dimensions preserve restaurant handling speed during material changes.
Why does Paperboard lead the Material category?
Paperboard gives groups a printable fiber structure that handles grease and moisture on familiar converting equipment. It also fits paperboard packaging programs where graphics and food protection require one qualification route.
- By material, paperboard is projected to represent 33.0% in 2026 because converters can pair print surfaces with grease and moisture barriers in familiar converting lines.
- Huhtamaki launched ProDairy in February 2025 with less than 10% plastic in recyclable single-coated paper cups. Although ProDairy is a cup rather than a meal box, its sealing work shows how fiber-based packaging can reduce polymer content without losing food-contact performance.
How does Standard meal shape the Format size category?
Standard meal formats fit common lunch and dinner orders without excessive unused volume during service. Their dimensions also match rigid food packaging handling systems used at counters and in delivery bags.
- Standard meal sizes are forecast to hold 41.0% of format size demand in 2026, attributable to common lunch and dinner portions that fit counter and delivery workflows.
- Faerch confirmed in April 2025 that Cyclos-HTP rated MAPET II trays 98%-99% recyclable for their route. The result covers trays instead of clamshell packaging format, but it shows the validation required before rigid packs carry recycling claims.
What supports QSR chains in the End Use category?
QSR chains purchase packaging against centralized menu specifications that must perform at high line speeds in many outlets. One approved food packaging format generates repeat orders if factories and distributors reproduce the same performance at each restaurant location.
- QSR chains are projected to account for 33.0% of end use demand in 2026, tied to centralized specifications that repeat through high-volume restaurant networks.
- Graphic Packaging’s February 2025 annual filing identifies QSR customers for its Americas paperboard packaging operations. The customer exposure explains why chain converters need repeat manufacturing control after national menu qualification.
What are the drivers, restraints and opportunities in the Counter Display Boxes Market?
Prepared-food throughput raises repeat box consumption while qualification and recovery constraints slow material switching. Fiber and recyclable formats offer revenue where performance evidence supports local disposal claims.
- Driver: Off-premise prepared-food service ties packaging consumption directly to repeat meal throughput at counters and delivery handoff points.
- Restraint: Material changes increase qualification time if grease resistance, heat performance or disposal claims fail within restaurant networks.
- Opportunity: Manufacturers can win replacement programs by pairing simpler material structures with verified meal performance and reliable regional replenishment.
Prepared-Food Throughput Sustains Repeat Orders
Prepared-food volume converts directly into orders because every off-premise meal requires a container before handoff. The USA Census Bureau reported in June 2026 that food services and drinking places sales were 2.7% above May 2025. Higher service volumes increase repeat orders for boxes that control leakage without slowing counter routines. Restaurant groups qualify each format against menu moisture and delivery time before distributor orders become routine.
Qualification and Recovery Rules Slow Material Switching
Material substitution slows once a box reaches menu testing because disposal claims alone do not prove operating fit. The USA Environmental Protection Agency noted in January 2026 that one recyclable foodservice certification category had zero certified products. Operators screen compostable plastic packaging against local collection before paying higher unit costs for restaurant accounts. A pack loses value if the account cannot route it into the claimed recovery stream.
Fiber Formats Can Simplify Restaurant Specifications
Fiber conversion offers revenue where restaurants want simpler disposal instructions without sacrificing meal protection during service. In April 2025 Eco-Products and DNO Produce introduced a molded-fiber produce cup sealed with plant-based lidding film for school nutrition programs. Manufacturers serving molded fiber pulp packaging can apply that design logic where menu temperature and local collection support repeat purchasing.
Which country CAGRs are profiled in the Counter Display Boxes Market?
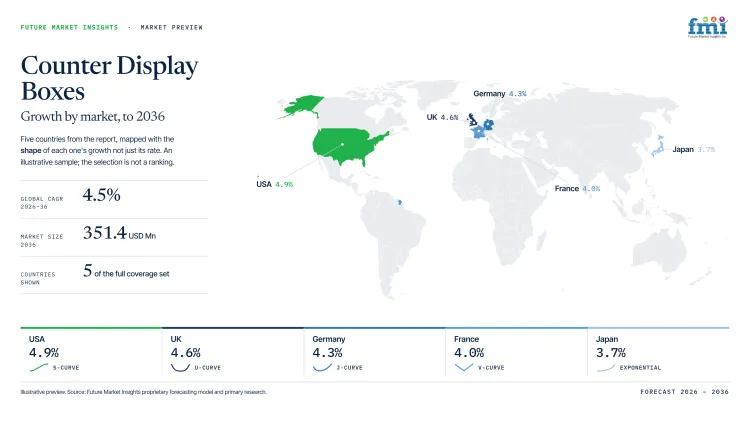
| Country | CAGR |
|---|---|
| Saudi Arabia | 5.8% |
| UAE | 5.5% |
| South Korea | 5.2% |
| USA | 4.9% |
| UK | 4.6% |
| Germany | 4.3% |
| France | 4.0% |
| Japan | 3.7% |
How do country-level CAGRs compare in the Counter Display Boxes Market?
The CAGRs span 2.1 percentage points from Saudi Arabia at 5.8% to Japan at 3.7%. Saudi Arabia, UAE and South Korea form the upper group, whereas USA and UK occupy the middle band. Germany, France and Japan grow more slowly because mature recovery and reuse rules make material changes more selective.
- Saudi Arabia ranks first because hospitality capacity increases the number of outlets requiring foodservice packaging replenishment.
- UAE growth follows Dubai’s staged removal of single-use plastic formats from restaurant and takeaway service.
- South Korea’s position follows reuse-policy trials that place return handling inside franchise foodservice routines today.
- USA growth at 4.9% follows QSR scale, though local recovery differences complicate national disposal claims.
- UK demand is filtered through producer-responsibility costs and established paper recovery routes for foodservice packaging.
- Germany’s mature dual-system recycling network favors formats with clear material separation and documented takeaway use.
- France retains takeaway-box demand because on-premise reuse rules narrow the occasions that permit disposable serviceware.
- Japan’s municipal sorting system slows material changes by requiring identification for separate plastic and paper recovery.
Similar CAGRs present different entry conditions because each country places qualification costs at different operating points.
Country-wise Analysis
- Saudi Arabia’s hospitality pipeline is widening the number of venues that need reliable prepared-food packaging for daily service. The General Authority for Statistics documented in January 2026 that licensed tourism hospitality facilities reached 5,622 in Q3 2025 and rose 40.6% year over year. Counter display box demand in Saudi Arabia is forecast to expand at 5.8% CAGR from 2026 to 2036, tied to expanding hospitality capacity and distributor replenishment. High ambient temperatures raise grease and closure requirements for takeaway formats, and restaurant groups need consistent case supply between major cities. Manufacturers entering the market need local distribution plus heat-tested formats that can serve repeat national restaurant accounts reliably at scale.
- Dubai’s staged single-use rules are forcing restaurant groups to replace familiar plastic formats on a fixed timetable. Dubai Municipality confirmed in December 2025 that the 2025 restriction covered Styrofoam food containers before the final phase began in January 2026. Approved alternatives must preserve heat retention and packing speed during substitution programs, and emirate-level implementation differences complicate specifications for chains serving several locations. Counter display box sales in the UAE are estimated to advance at 5.5% CAGR over the assessment period owing to faster material transition. Manufacturers gain an advantage by pairing documented material claims with distributor stock for menu trials.
- South Korean restaurant groups test reuse and recovery rules against high-throughput takeaway routines in dense urban markets. Counter display box demand in South Korea is projected to record 5.2% CAGR during the forecast period, reflecting continued policy attention to foodservice waste. The national environment ministry stated in December 2025 that the disposable-cup deposit program had 33.1% store participation and a 52.5% return rate by November. Large franchise networks scale qualified formats quickly despite labor and return-system administration costs for reusable models. Packaging producers can differentiate with clear disposal instructions and container formats that preserve counter speed during peak meals at scale.
- National restaurant networks give the USA an installed base for standardized meal packaging and distributor replenishment. USDA Economic Research Service data published in July 2025 show total per-capita food spending increased 3.2% during 2024. Counter display box demand in the USA is forecast to rise at 4.9% CAGR by 2036, driven by repeat off-premise meals and QSR specifications. Broadline distribution reaches independent outlets and multi-state chains without separate sourcing programs, and manufacturers must match disposal claims to each account’s local collection route. Municipal recovery systems differ between cities and can change acceptance for coated paper or rigid formats in practice.
- UK packaging decisions account for producer-responsibility costs and the recovery route available after food service. The Department for Environment Food & Rural Affairs reported in July 2025 that paper and cardboard packaging recycling reached 74.3% in 2024. Paperboard producers can use an established fiber recovery route during qualification, but food contamination and mixed coatings can narrow recycling acceptance for packs. Counter display box demand in the UK is projected to grow at 4.6% CAGR between 2026 and 2036, attributable to material replacement and takeaway use. Commercial offers need clear material composition and distributor coverage that reaches national restaurant accounts with dependable service.
- Germany’s packaging system places material separation and reusable alternatives inside takeaway operating decisions for national restaurant chains. Demand for counter display boxes in Germany is estimated to expand at 4.3% CAGR over the forecast period, supported by packaging rules and food consumption. The German Environment Agency reported in January 2026 that roughly 5.5 million tonnes of dual-system packaging waste were recycled during 2024. Germany’s dual-system volume gives paper and cardboard formats a mature sorting route for national restaurant packaging. Reuse obligations divert on-premise occasions from disposable serviceware, so packaging producers need takeaway applications with recovery evidence that fits dual-system requirements.
- French foodservice operators face rules that favor reusable tableware for on-premise meals but retain single-use needs in takeaway service. Insee published in June 2026 that restaurant and accommodation spending remained more than 20% above its 2019 level. France is anticipated to post 4.0% CAGR for counter display boxes through 2036, aided by takeaway workflows inside a tighter single-use boundary. Restaurant spending at that level gives meal-box manufacturers a service base without implying that every dining occasion requires disposable packaging. National policy raises scrutiny of end-of-life claims during qualification. Manufacturers with menu performance data can compete more effectively than portfolios lacking a disposal route.
- Japanese foodservice packaging operates inside a municipal sorting system that separates material streams more precisely than export programs assume. Japan’s environment ministry reported in March 2026 that 82.4% of municipalities planned separate collection for plastic packaging in fiscal 2026. Paper packaging was listed at 51.9%, pointing to another local recovery route for fiber formats. Counter display box demand in Japan is projected to expand at 3.7% CAGR over the assessment period, influenced by convenience-food demand and disposal expectations. Municipal differences prevent a national disposal message for restaurant chains using the same pack. Packaging manufacturers entering Japan need material identification that fits sorting practice without slowing service.
Who are the notable companies in the Counter Display Boxes Market?
Dart Container, Graphic Packaging, Duni Group, Huhtamaki, Detmold Group, Novolex, Sabert, and Faerch serve the market.
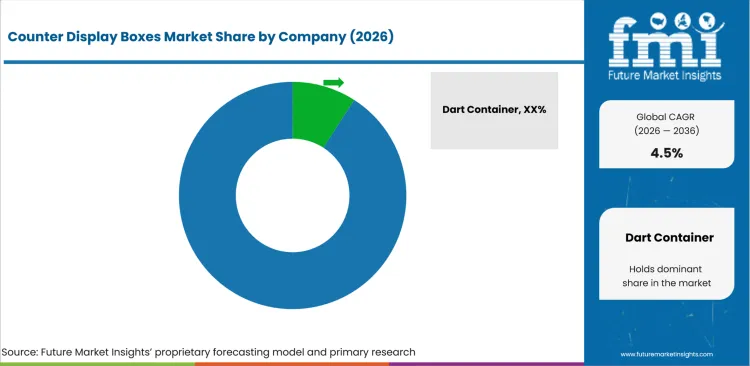
Large restaurant accounts separate competitors by material breadth, repeat line performance and regional supply depth during qualification. Fiber-led converters focus on print and barrier engineering, whereas rigid specialists compete on recycled-content evidence and sorting compatibility. Multi-substrate manufacturers can shift qualified accounts between recyclable packaging routes without rebuilding the commercial relationship.
- Multi-substrate platforms: Dart Container, Novolex and Sabert cover restaurant packaging through several verified material routes.
- Fiber-led converters: Graphic Packaging, Huhtamaki and Detmold Group concentrate on paperboard or molded-fiber foodservice formats.
- Restaurant systems and rigid specialists: Duni Group and Faerch serve takeaway programs with sealing systems or recycled trays.
Competitive Benchmarking: Counter Display Boxes Market
| Company | Fiber & Paperboard Meal-Box Depth | Rigid Recyclable Plastic Options | Chain-Scale Customization & Supply | Geographic Reach |
|---|---|---|---|---|
| Dart Container | Medium | High | High | North America with selected international foodservice programs |
| Graphic Packaging | High | Low | High | Global |
| Duni Group | High | Medium | Medium | Europe, Oceania and selected international markets |
| Huhtamaki | High | Medium | High | Global |
| Detmold Group | High | Low | High | Australia, Asia and North America |
| Novolex | High | High | High | North America and Europe |
| Sabert | High | High | High | North America, Europe and Asia |
| Faerch | Low | High | High | Europe and selected international food markets |
Scoring basis: High fiber depth requires several documented fiber routes. Medium requires one substantial route and Low identifies a non-fiber position. High rigid depth requires several recyclable rigid formats. Medium marks narrower coverage and Low marks a material focus. High chain-scale supply requires large-account customization plus multi-site manufacturing or distribution. Medium marks narrower regional service, with geographic reach based on verified operating coverage.
Key Developments in the Counter Display Boxes Market
- In October 2025, Graphic Packaging produced the first commercial-grade paperboard at its Waco facility and increased North American recycled-board capacity.
- In June 2025, Duni Group acquired 80% of LinePack Oy and expanded into automated food-packaging equipment with installation and maintenance.
- In April 2025, Novolex completed its Pactiv Evergreen combination and placed two large food-packaging manufacturing networks under common ownership.
Key Players in the Counter Display Boxes Market
Multi-Substrate Foodservice Platforms
- Dart Container
- Novolex
- Sabert
Fiber-Led Foodservice Converters
- Graphic Packaging
- Huhtamaki
- Detmold Group
Restaurant Systems and Rigid Packaging Specialists
- Duni Group
- Faerch
Counter Display Boxes Market - Report Scope
| Coverage field | Report scope |
|---|---|
| Market breakdown | By format type, material, format size, end use, sales channel and region. |
| Quantitative Units | USD Million. |
| Market Definition | Revenue from counter display boxes and meal-container formats sold within the defined segmentation. Food and beverage revenue is excluded together with adjacent packaging categories outside the specified box and container scope. |
| Regions Covered | North America, Latin America, Europe, East Asia, South Asia and Pacific, and Middle East and Africa. |
| Countries Covered | USA, Germany, France, UK, Japan, South Korea, Saudi Arabia, UAE and more than twenty-five additional countries in the full report. |
| Key Companies Profiled | Dart Container, Graphic Packaging, Duni Group, Huhtamaki, Detmold Group, Novolex, Sabert, Faerch. |
| Forecast Period | 2026 to 2036. |
| Approach | Primary and secondary research with market triangulation. |
Counter Display Boxes Market - Research Methodology
| Method | Approach |
|---|---|
| Primary Research | FMI analysts gathered input from manufacturers, service providers, technology developers, distributors, end users, procurement teams, and subject-matter experts. Interviews examined purchasing decisions, product or service evaluation, adoption barriers, approval requirements, pricing considerations, and expectations for technical or commercial support. Respondents were also asked what evidence is required before a trial, pilot, or initial order develops into regular purchasing. |
| Desk Research | Desk research covered government statistics, regulatory publications, trade data, industry associations, technical literature, standards, company filings, product information, and official corporate announcements. Sources were reviewed for relevance, publication date, geographic coverage, and consistency with the defined market scope. Claims relating to performance, applications, approvals, capacity, investment, and commercial activity were retained only when supported by credible public evidence. |
| Market Sizing and Forecasting | The market model combined the baseline value with historical performance, segment structure, pricing and volume indicators, adoption levels, company participation, and country-level demand conditions. Forecast assumptions considered economic activity, investment trends, regulatory developments, technology adoption, purchasing cycles, supply availability, and barriers to wider market use. Segment and regional estimates were reconciled before the final market total was calculated. |
| Data Validation | Estimates were checked against multiple independent indicators, including public data, company activity, trade patterns, industry developments, and findings from primary interviews. Validation also tested whether products, services, applications, and company revenues fell within the defined market boundaries. Adjacent categories, unsupported claims, overlapping revenues, and activities without direct market relevance were excluded to reduce double counting and maintain consistency across segments and countries. |
Counter Display Boxes Market by Segments
Counter Display Boxes Market segmented by Format Type:
- Standard formats
- Recyclable-optimized formats
- Premium & branded formats
- Custom-engineered formats
Counter Display Boxes Market segmented by Material:
- Paperboard
- Molded fiber & bagasse
- rPET & PP
- Compostable polymers
- Aluminium
Counter Display Boxes Market segmented by Format Size:
- Standard meal
- Single-serve
- Family & catering
Counter Display Boxes Market segmented by End Use:
- QSR chains
- Delivery platforms
- Coffee & beverage
- Institutional catering
- Retail deli
Counter Display Boxes Market segmented by Sales Channel:
- Broadline foodservice distributors
- Direct chain contracts
- Packaging distributors
- Online
Counter Display Boxes Market by Region:
- North America
- United States
- Canada
- Latin America
- Brazil
- Mexico
- Argentina
- Chile
- Western Europe
- Germany
- France
- United Kingdom
- Italy
- Spain
- Benelux
- Nordics
- Eastern Europe
- Poland
- Czech Republic
- Romania
- Hungary
- East Asia
- China
- Japan
- South Korea
- South Asia and Pacific
- India
- ASEAN
- Australia and New Zealand
- Middle East and Africa
- GCC Countries
- South Africa
- Türkiye
- Israel
Research Sources and Bibliography
- USA Department of Agriculture, Economic Research Service (2025, July 9). State-level changes in food sales varied in 2024.
- European Commission, Directorate-General for Environment (2025, February 11).New rules enter into force for a more sustainable and competitive packaging economy.
- Dubai Municipality (2025, December 24). Dubai to enforce final phase of single-use plastic ban from 2026.
- Duni Group (2025, December 8). Duni Group Launches New Packaging Series with Enhanced Performance and Reduced Climate Impact.
- Huhtamaki (2025, February 28). Huhtamaki launches recyclable single coated paper cups for yogurt and dairy.
- Faerch (2025, April 23). Faerch achieves independent recyclability certification for MAPET II trays, paving the way for a full circularity in packaging.
- Graphic Packaging Holding Company (2025, February 12). Annual report pursuant to Section 13 and 15(d).
- USA Census Bureau (2026, June 17). Advance Monthly Sales for Retail and Food Services.
- USA Environmental Protection Agency (2026, January 5). Cafeteria and Food Services Model Contract Language.
- Novolex (2025, May 1). Eco-Products and DNO Produce Help Bring Environmental Sustainability to K-12 School Cafeterias.
- German Environment Agency (2026, January 27). Facts against myths: Packaging waste recycling in Germany is working.
- Insee (2026, June 16). Household Consumption in 2025.
- Department for Environment, Food & Rural Affairs (2025, July 23). UK statistics on waste.
- Ministry of the Environment, Government of Japan (2026, March 31). 容器包装リサイクル法に基づく令和8年度以降の分別収集見込量の集計結果について.
- Ministry of Climate, Energy and Environment, Republic of Korea (2025, December 22). (설명) '컵따로 계산제'는 컵값을 더 내는 것이 아니라, 이미 내고 있던 컵값을 별도 표시하는 것임.
- General Authority for Statistics, Saudi Arabia (2026, January 8). GASTAT: Publishes Tourism Establishments Statistics for Q3 of 2025.
- Graphic Packaging International (2025, November 5). Graphic Packaging’s Waco Recycled Paperboard Facility Launches.
- Duni Group (2025, June 3). Duni Group Acquires Majority Stake in LinePack Oy.
- Pactiv Evergreen Inc. (2025, April 1). 8-K.
- Dart Container (2025, June 5). Score! Dart Reusables in Play at Pro Soccer Venue.
- Graphic Packaging International (2025, May 14). Graphic Packaging Launches New Portfolio of Paperboard Sushi Packaging To Support Regulatory Compliance of European Foodservice Operators.
- Duni Group (2025, November 25). Duni Group and Duniform Take the Next Step in Reducing Food Waste.
- Huhtamaki (2025, July 16). Huhtamaki launches new compostable ice cream cups.
- Detmold Group (2026, July 20). Detpak Is Now Manufacturing in the United States.
- Novolex (2025, May 29). Eco-Products Named an Official Zero Waste Partner of the San Francisco Giants.
- Sabert Corporation (2025, June 2). Sabert Invests in the Future of Food Packaging with Innovative, Domestically Produced Solutions Featured at the 2025 IDDBA Show.
- Faerch (2026, April 9). Faerch and Norfersk scale 70% tray-to-tray recycled PET meat trays using CIRPET+.
- Duni Group (2025, August 19). Duni Group launches Relevo reusable system in Sweden.
This bibliography is provided for reader reference and is not exhaustive. The full report contains the complete reference list and detailed citations
This Report Answers
- What are the global Counter Display Boxes market values in 2026 and 2036?
- What factors sustain repeat demand and recurring orders for counter display boxes across retail environments?
- Why do standard-format counter display boxes hold the largest share of the format type segment?
- Why does paperboard account for the leading share of material demand in the market?
- Which operational, cost, and sustainability factors slow the substitution of conventional display box materials?
- How are the leading companies positioned within the global Counter Display Boxes market?
Frequently Asked Questions
How big is the counter display boxes market in 2026?
The counter display boxes market is valued at USD 226.3 million in 2026 and is projected to reach USD 351.4 million by 2036. Prepared-food throughput sustains repeat orders because every off-premise meal requires a qualified container before restaurant handoff.
What is the CAGR of the counter display boxes market from 2026 to 2036?
The counter display boxes market is projected to grow at a CAGR of 4.5% between 2026 and 2036. Repeat takeaway use and material replacement after local rule changes sustain the forecast during the assessment period.
Which format type leads the counter display boxes market?
The standard formats segment is expected to hold 38.0% of format type demand in 2026 because existing footprints shorten qualification work. Restaurant groups also reduce stocked dimensions by using familiar formats for repeat meal programs and distributor inventories.
Which countries are projected to record the highest growth in the counter display boxes market?
Saudi Arabia is projected to grow at 5.8% CAGR, followed by UAE at 5.5% and South Korea at 5.2% through 2036. Hospitality expansion and plastic-reduction rules increase replacement activity by forcing faster packaging decisions in the higher-growth markets.
Which companies are active in the counter display boxes market?
Key companies operating in the market include Dart Container, Graphic Packaging, Duni Group, Huhtamaki, Detmold Group, Novolex, Sabert, and Faerch. These companies compete on material breadth and chain-scale supply plus specialized paperboard or rigid packaging expertise.
Preview the report firsthand - request a free sample
Get SampleGet the brochure for pricing and purchase details.
Get PDFTable of Content
- Key Takeaways
- Market Size and CAGR
- Top Growth Driver
- Fastest Growing Segment
- Leading Region
- Key Companies
- Emerging Opportunities
- Executive Summary
- Global Market Outlook
- Demand-side Trends
- Supply-side Trends
- Technology Roadmap Analysis
- Analysis and Recommendations
- Analyst Perspective (What is happening? Why now? What should investors know?)
- Key Questions Answered
- How large is the market?
- What is the CAGR?
- What are key trends?
- Which region dominates?
- Who are the leaders?
- Market Overview
- Market Coverage / Taxonomy
- Market Definition / Scope / Limitations
- Research Methodology
- Chapter Orientation
- Analytical Lens and Working Hypotheses
- Market Structure, Signals, and Trend Drivers
- Benchmarking and Cross-market Comparability
- Market Sizing, Forecasting, and Opportunity Mapping
- Research Design and Evidence Framework
- Desk Research Programme (Secondary Evidence)
- Expert Input and Fieldwork (Primary Evidence)
- Tooling, Models, and Reference Databases
- Data Engineering and Model Build
- Quality Assurance and Audit Trail
- Market Background
- Market Dynamics (Drivers, Restraints, Opportunity, Trends)
- Scenario Forecast (Optimistic, Likely, Conservative)
- Impact Analysis
- AI Impact
- Sustainability Impact
- Regulatory Impact
- Technology Impact
- Consumer / Buyer Analysis
- Purchase Drivers
- Adoption Barriers
- Buyer Journey
- Opportunity Map Analysis
- Product Life Cycle Analysis
- Supply Chain Analysis
- Investment Feasibility Matrix
- Value Chain Analysis
- PESTLE and Porter's Analysis
- Regulatory Landscape
- Regional Parent Market Outlook
- Production and Consumption Statistics
- Import and Export Statistics
- Global Market Analysis and Forecast, 2021 to 2036
- Historical Market Size Value (USD Million) Analysis, 2021 to 2025
- Current and Future Market Size Value (USD Million) Projections, 2026 to 2036
- Y-o-Y Growth Trend Analysis
- Absolute $ Opportunity Analysis
- Global Market Pricing Analysis, 2021 to 2036
- Global Market Analysis and Forecast, By Format Type, 2021 to 2036
- Introduction / Key Findings
- Historical Market Size Value (USD Million) Analysis By Format Type, 2021 to 2025
- Current and Future Market Size Value (USD Million) Analysis and Forecast By Format Type, 2026 to 2036
- Standard formats
- Recyclable-optimized formats
- Premium & branded formats
- Custom-engineered formats
- Standard formats
- Y-o-Y Growth Trend Analysis By Format Type, 2021 to 2025
- Absolute $ Opportunity Analysis By Format Type, 2026 to 2036
- Global Market Analysis and Forecast, By Material, 2021 to 2036
- Introduction / Key Findings
- Historical Market Size Value (USD Million) Analysis By Material, 2021 to 2025
- Current and Future Market Size Value (USD Million) Analysis and Forecast By Material, 2026 to 2036
- Paperboard
- Molded fiber & bagasse
- rPET & PP
- Compostable polymers
- Aluminium
- Paperboard
- Y-o-Y Growth Trend Analysis By Material, 2021 to 2025
- Absolute $ Opportunity Analysis By Material, 2026 to 2036
- Global Market Analysis and Forecast, By Format Size, 2021 to 2036
- Introduction / Key Findings
- Historical Market Size Value (USD Million) Analysis By Format Size, 2021 to 2025
- Current and Future Market Size Value (USD Million) Analysis and Forecast By Format Size, 2026 to 2036
- Standard meal
- Single-serve
- Family & catering
- Standard meal
- Y-o-Y Growth Trend Analysis By Format Size, 2021 to 2025
- Absolute $ Opportunity Analysis By Format Size, 2026 to 2036
- Global Market Analysis and Forecast, By End Use, 2021 to 2036
- Introduction / Key Findings
- Historical Market Size Value (USD Million) Analysis By End Use, 2021 to 2025
- Current and Future Market Size Value (USD Million) Analysis and Forecast By End Use, 2026 to 2036
- QSR chains
- Delivery platforms
- Coffee & beverage
- Institutional catering
- Retail deli
- QSR chains
- Y-o-Y Growth Trend Analysis By End Use, 2021 to 2025
- Absolute $ Opportunity Analysis By End Use, 2026 to 2036
- Global Market Analysis and Forecast, By Sales Channel, 2021 to 2036
- Introduction / Key Findings
- Historical Market Size Value (USD Million) Analysis By Sales Channel, 2021 to 2025
- Current and Future Market Size Value (USD Million) Analysis and Forecast By Sales Channel, 2026 to 2036
- Broadline foodservice distributors
- Direct chain contracts
- Packaging distributors
- Online
- Broadline foodservice distributors
- Y-o-Y Growth Trend Analysis By Sales Channel, 2021 to 2025
- Absolute $ Opportunity Analysis By Sales Channel, 2026 to 2036
- Global Market Analysis and Forecast, By Region, 2021 to 2036
- Introduction
- Historical Market Size Value (USD Million) Analysis By Region, 2021 to 2025
- Current Market Size Value (USD Million) Analysis and Forecast By Region, 2026 to 2036
- North America
- Latin America
- Western Europe
- Eastern Europe
- East Asia
- South Asia and Pacific
- Middle East & Africa
- Market Attractiveness Analysis By Region
- North America Market Analysis and Forecast, By Country, 2021 to 2036
- Historical Market Size Value (USD Million) Trend Analysis By Market Taxonomy, 2021 to 2025
- Market Size Value (USD Million) Forecast By Market Taxonomy, 2026 to 2036
- By Country
- USA
- Canada
- By Format Type
- By Material
- By Format Size
- By End Use
- By Sales Channel
- By Country
- Market Attractiveness Analysis
- By Country
- By Format Type
- By Material
- By Format Size
- By End Use
- By Sales Channel
- Key Takeaways
- Latin America Market Analysis and Forecast, By Country
- Historical Market Size Value (USD Million) Trend Analysis By Market Taxonomy, 2021 to 2025
- Market Size Value (USD Million) Forecast By Market Taxonomy, 2026 to 2036
- By Country
- Brazil
- Mexico
- Chile
- Rest of Latin America
- By Format Type
- By Material
- By Format Size
- By End Use
- By Sales Channel
- By Country
- Market Attractiveness Analysis
- By Country
- By Format Type
- By Material
- By Format Size
- By End Use
- By Sales Channel
- Key Takeaways
- Western Europe Market Analysis and Forecast, By Country
- Historical Market Size Value (USD Million) Trend Analysis By Market Taxonomy, 2021 to 2025
- Market Size Value (USD Million) Forecast By Market Taxonomy, 2026 to 2036
- By Country
- Germany
- UK
- Italy
- Spain
- France
- Nordic
- BENELUX
- Rest of Western Europe
- By Format Type
- By Material
- By Format Size
- By End Use
- By Sales Channel
- By Country
- Market Attractiveness Analysis
- By Country
- By Format Type
- By Material
- By Format Size
- By End Use
- By Sales Channel
- Key Takeaways
- Eastern Europe Market Analysis and Forecast, By Country
- Historical Market Size Value (USD Million) Trend Analysis By Market Taxonomy, 2021 to 2025
- Market Size Value (USD Million) Forecast By Market Taxonomy, 2026 to 2036
- By Country
- Russia
- Poland
- Hungary
- Balkan & Baltic
- Rest of Eastern Europe
- By Format Type
- By Material
- By Format Size
- By End Use
- By Sales Channel
- By Country
- Market Attractiveness Analysis
- By Country
- By Format Type
- By Material
- By Format Size
- By End Use
- By Sales Channel
- Key Takeaways
- East Asia Market Analysis and Forecast, By Country
- Historical Market Size Value (USD Million) Trend Analysis By Market Taxonomy, 2021 to 2025
- Market Size Value (USD Million) Forecast By Market Taxonomy, 2026 to 2036
- By Country
- China
- Japan
- South Korea
- By Format Type
- By Material
- By Format Size
- By End Use
- By Sales Channel
- By Country
- Market Attractiveness Analysis
- By Country
- By Format Type
- By Material
- By Format Size
- By End Use
- By Sales Channel
- Key Takeaways
- South Asia and Pacific Market Analysis and Forecast, By Country
- Historical Market Size Value (USD Million) Trend Analysis By Market Taxonomy, 2021 to 2025
- Market Size Value (USD Million) Forecast By Market Taxonomy, 2026 to 2036
- By Country
- India
- ASEAN
- Australia & New Zealand
- Rest of South Asia and Pacific
- By Format Type
- By Material
- By Format Size
- By End Use
- By Sales Channel
- By Country
- Market Attractiveness Analysis
- By Country
- By Format Type
- By Material
- By Format Size
- By End Use
- By Sales Channel
- Key Takeaways
- Middle East & Africa Market Analysis and Forecast, By Country
- Historical Market Size Value (USD Million) Trend Analysis By Market Taxonomy, 2021 to 2025
- Market Size Value (USD Million) Forecast By Market Taxonomy, 2026 to 2036
- By Country
- Kingdom of Saudi Arabia
- Other GCC Countries
- Türkiye
- South Africa
- Other African Union
- Rest of Middle East & Africa
- By Format Type
- By Material
- By Format Size
- By End Use
- By Sales Channel
- By Country
- Market Attractiveness Analysis
- By Country
- By Format Type
- By Material
- By Format Size
- By End Use
- By Sales Channel
- Key Takeaways
- Key Countries Market Analysis
- USA
- Pricing Analysis
- Market Share Analysis, 2025
- By Format Type
- By Material
- By Format Size
- By End Use
- By Sales Channel
- Canada
- Pricing Analysis
- Market Share Analysis, 2025
- By Format Type
- By Material
- By Format Size
- By End Use
- By Sales Channel
- Mexico
- Pricing Analysis
- Market Share Analysis, 2025
- By Format Type
- By Material
- By Format Size
- By End Use
- By Sales Channel
- Brazil
- Pricing Analysis
- Market Share Analysis, 2025
- By Format Type
- By Material
- By Format Size
- By End Use
- By Sales Channel
- Chile
- Pricing Analysis
- Market Share Analysis, 2025
- By Format Type
- By Material
- By Format Size
- By End Use
- By Sales Channel
- Germany
- Pricing Analysis
- Market Share Analysis, 2025
- By Format Type
- By Material
- By Format Size
- By End Use
- By Sales Channel
- UK
- Pricing Analysis
- Market Share Analysis, 2025
- By Format Type
- By Material
- By Format Size
- By End Use
- By Sales Channel
- Italy
- Pricing Analysis
- Market Share Analysis, 2025
- By Format Type
- By Material
- By Format Size
- By End Use
- By Sales Channel
- Spain
- Pricing Analysis
- Market Share Analysis, 2025
- By Format Type
- By Material
- By Format Size
- By End Use
- By Sales Channel
- France
- Pricing Analysis
- Market Share Analysis, 2025
- By Format Type
- By Material
- By Format Size
- By End Use
- By Sales Channel
- India
- Pricing Analysis
- Market Share Analysis, 2025
- By Format Type
- By Material
- By Format Size
- By End Use
- By Sales Channel
- ASEAN
- Pricing Analysis
- Market Share Analysis, 2025
- By Format Type
- By Material
- By Format Size
- By End Use
- By Sales Channel
- Australia & New Zealand
- Pricing Analysis
- Market Share Analysis, 2025
- By Format Type
- By Material
- By Format Size
- By End Use
- By Sales Channel
- China
- Pricing Analysis
- Market Share Analysis, 2025
- By Format Type
- By Material
- By Format Size
- By End Use
- By Sales Channel
- Japan
- Pricing Analysis
- Market Share Analysis, 2025
- By Format Type
- By Material
- By Format Size
- By End Use
- By Sales Channel
- South Korea
- Pricing Analysis
- Market Share Analysis, 2025
- By Format Type
- By Material
- By Format Size
- By End Use
- By Sales Channel
- Russia
- Pricing Analysis
- Market Share Analysis, 2025
- By Format Type
- By Material
- By Format Size
- By End Use
- By Sales Channel
- Poland
- Pricing Analysis
- Market Share Analysis, 2025
- By Format Type
- By Material
- By Format Size
- By End Use
- By Sales Channel
- Hungary
- Pricing Analysis
- Market Share Analysis, 2025
- By Format Type
- By Material
- By Format Size
- By End Use
- By Sales Channel
- Kingdom of Saudi Arabia
- Pricing Analysis
- Market Share Analysis, 2025
- By Format Type
- By Material
- By Format Size
- By End Use
- By Sales Channel
- Türkiye
- Pricing Analysis
- Market Share Analysis, 2025
- By Format Type
- By Material
- By Format Size
- By End Use
- By Sales Channel
- South Africa
- Pricing Analysis
- Market Share Analysis, 2025
- By Format Type
- By Material
- By Format Size
- By End Use
- By Sales Channel
- USA
- Market Structure Analysis
- Competition Dashboard
- Competition Benchmarking
- Market Share Analysis of Top Players
- By Regional
- By Format Type
- By Material
- By Format Size
- By End Use
- By Sales Channel
- Emerging Startups
- Innovation Benchmarking
- Competition Analysis
- Competition Deep Dive
- Dart Container
- Overview
- Product Portfolio
- Profitability by Market Segments
- Sales Footprint
- Strategy Overview
- Marketing Strategy
- Product Strategy
- Channel Strategy
- Genpak
- Graphic Packaging
- Duni
- Berry Global
- Pactiv Evergreen
- Huhtamaki
- Detmold Group
- Novolex
- Sabert
- Dart Container
- Case Studies
- Success Stories
- Recent Developments
- Competition Deep Dive
- Assumptions & Acronyms Used


