

- Market Size (2026)
- USD 1012.4 Mn
- Forecast (2036)
- USD 1779.2 Mn
- CAGR (2026 to 2036)
- 5.8%
How big is Cubing Systems Market in 2026?
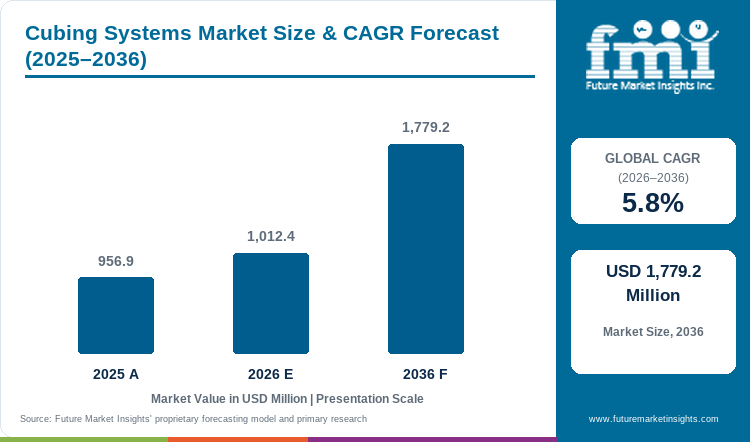
USD 1,012.4 million in 2026 and USD 1,779.2 million by 2036, expanding at 5.8% CAGR.
Cubing systems sales are expected to reach USD 1,012.4 million in 2026, rising from USD 956.9 million in 2025. The market is projected to reach USD 1,779.2 million by 2036 at a 5.8% CAGR. Density-based freight rules make accurate cube and weight data important for rating and billing. In April 2025, NMFTA said more than 2,000 LTL items would move to full density freight class on July 19, 2025. Teams need reliable dimension records before they rate a shipment or review an invoice. They can send those repeatable measurements directly to rating and invoice systems.
Rollout needs differ by country because shipping systems and transaction rules differ. The U.S. Census Bureau expected second-quarter 2026 retail e-commerce sales at USD 340.2 billion. That amount represented 17.1% of total retail sales. Germany's parcel network often requires careful retrofits. Japan adds demand for compact systems in sites with limited space. Brazil and Mexico place more weight on local service. Spain and Italy include medium-volume sites that can adopt modular systems before full conveyor automation.
Key Takeaways
- Density-based freight class makes repeatable cube and weight records more useful before teams tender a shipment.
- Parcel cubing systems are projected to account for 31.0% of system type in 2026. Frequent outbound measurement supports this share.
- 3D imaging is expected to hold 30.0% of technology in 2026. Its ability to capture irregular shapes supports this share.
- E-commerce fulfillment is set to hold 30.0% of end use in 2026. Frequent parcel handling supports this share.
- Legal measurement rules and host integration can lengthen start-up before live billing begins.
- Some of the key players in this market include Mettler-Toledo, SICK, Scaletronic, Datalogic, Cubiscan (Quantronix, Inc.), Rice Lake Weighing Systems, FreightSnap, Parcelcube, Dimensional Weighing, and NIDO Group.
Analyst Perspective
"What makes a dimension record reliable enough for billing? Operators need repeatable measurements with calibration evidence. They also need clear exception handling and reliable transfer into rating and warehouse systems."
- Nikhil Kaitwade, Principal Consultant, Future Market Insights.
How is the cubing systems market segmented?
The cubing systems market is segmented by System Type, Technology, End Use, Throughput, Sales Channel, and Region.
The cubing systems market is segmented by system type, technology, end use, throughput, sales channel and region. System type describes how teams use the measurement system. Technology describes the sensing method. End use shows the operating setting. Throughput groups sites by transaction volume. Sales channel separates direct equipment sales from integration-led rollouts.
Why do parcel cubing systems lead the system type category?
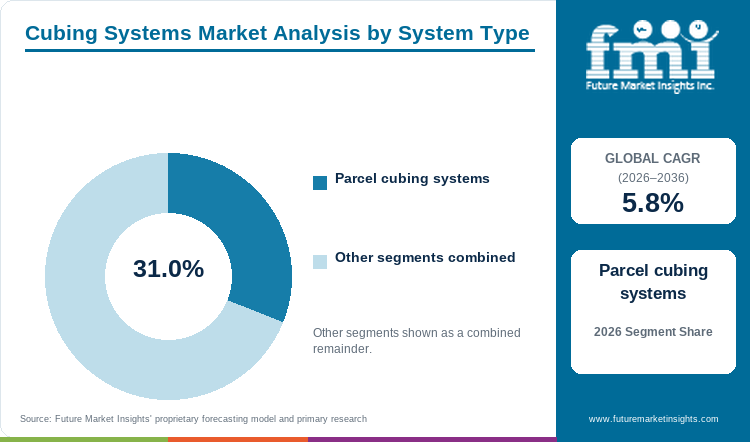
Parcel cubing systems measure items during packing or before a carrier creates the manifest. Static stations can handle cartons and odd-shaped parcels without taking up space for a pallet. In-motion dimensioning systems do the same job on conveyor lines when shipment volume grows. Teams can pair size data with weight and ID before rating or release. Parcel work also lets warehouses fix item records before bad size data changes carton choice or carrier bills. A site can start with one audit lane and keep the rest of the line unchanged. This setup can serve fulfillment centers and parcel carriers at many shipment volumes. It also works for 3PL operations.
- Parcel cubing systems are projected to account for 31.0% of system type in 2026. Frequent outbound measurement supports this share.
- Cubiscan documents in-motion systems that combine parcel dimensions with weight and host-system transfer.
Why does 3D imaging lead the technology category?
3D imaging captures the shape of an object's surface instead of treating every item as a box. It can measure soft packs and odd shapes that can confuse simpler sensors. Depth data gives teams a better record for visual review and problem checks. Buyers test light and surface type because dark or shiny items can hurt image quality. They also check the viewing area when item sizes vary at one station. Mixed-SKU sites can use one image process for size capture and proof storage. Teams can also use the same data for later digital models without changing the method for each shape.
- 3D imaging is expected to hold 30.0% of technology in 2026. Shape capture across irregular items supports this share.
- Integrated industrial weighing equipment adds weight to the dimension record for density calculations and trade-use workflows.
How does e-commerce fulfillment shape the end use category?
E-commerce fulfillment uses size data during item setup and outbound shipping. Cube data helps teams choose storage slots and cartons. Carriers use the same outbound record for rating. Warehouse robotics can reuse the size data for routing and space choices in automated storage or picking. Fast SKU turnover makes automatic master-data capture more useful because manual records can become incomplete or old. Returns and new suppliers create more points where teams need fresh size data. A cubing station gives the team one controlled way to update that data. The update happens before bad data affects storage space, package choice or transport charges.
- E-commerce fulfillment is forecast to hold 30.0% of end use in 2026. Frequent parcel handling supports this share.
- Automated material handling systems gain more value when teams keep dimensions consistent from item setup through dispatch.
What supports medium throughput in the throughput category?
Medium-throughput sites ship enough goods for manual work to cause delays. Their volume may still be too low for a hub-scale redesign. A fixed station can serve receiving or packing with little building work and simpler controls. Automated sortation systems can be added as volume grows without replacing the first measuring point. A step-by-step rollout lets teams prove billing or labor savings before they add more units. These sites often need standard software links more than custom conveyor work. They also gain from equipment that can move between audit, receiving and shipping tasks. This segment covers the payback range between hand measurement and high-speed DWS lines built for major hubs.
- Medium throughput is likely to capture 38.0% share in 2026. Measurable automation gains support demand without hub-scale engineering.
- Rice Lake's iDimension Flex combines approved trade-use measurement with API and software options. Teams can use those options for a staged rollout.
Why do automation integrators lead the sales channel category?
Automation setup firms link cubers with scales and scanners. They also connect the equipment to host software. They turn object mix and line speed into clear equipment and control needs before start-up. Fulfillment center design and integration services matter more when several systems must share conveyor timing and test work. Integrators map the data so size and weight records reach the right WMS or TMS fields. They also send ID records to the right fields. One team can then handle mechanical setup and control tests. The same team can train or hand work over to site staff. Direct system suppliers still matter for standard stations. Multi-system projects often need one firm that can fix interface problems without sending the warehouse to several vendors.
- Automation setup firms are forecast to hold 34.0% of sales channel in 2026. Cross-system start-up needs support this share.
- A cubing system creates more value when start-up also covers identification, exception handling and measurement accuracy.
What are the drivers, restraints and opportunities in the Cubing Systems Market?
Density-based freight rules and parcel activity increase the cost of weak dimensional data while integration work slows deployment and modular systems open a wider mid-throughput tier.
- Driver: Density-linked freight class and parcel traffic make accurate dimensions important for routine cost control.
- Restraint: Legal measurement rules and host integration can lengthen start-up before live billing begins.
- Opportunity: Modular systems can automate mid-volume sites without a full conveyor or software redesign.
Density-based freight rules turn cube data into a transaction control
Density freight class gives freight teams a clear reason to measure a shipment before tender. On July 19, 2025 the NMFC changes moved more than 2,000 items to full density-based freight class. NMFTA's April 2026 FAQ lists the 13-sub scale now used for density freight class. Accurate size and weight matter more during rating and review. Parcel teams face the same pressure because each outbound shipment creates another measure point. Teams can put cubing close to tender and shipping. The record can support checks before billing. It can also give proof for disputes in outbound logistics.
Certification and integration work can delay production use
The main restraint starts between equipment choice and live use. NIST Handbook 44 for 2026 lists rules for devices that measure dimensions for billing. A trade-use project can need approved equipment and controlled accuracy checks. The cuber must also share IDs with the warehouse or transport system. Teams must test conveyor timing and exception rules before they trust the data. These steps add engineering hours and can delay payback at smaller or older sites. Projects move faster when plans cover certification and accuracy checks. They also need a clear owner for local service before setup starts.
Modular systems open a larger mid-throughput automation tier
Some sites have outgrown tape measures but still cannot justify hub-scale automation. Compact 3D stations can measure mixed parcels. Pallet modules can support LTL freight without a fixed portal. Dimensional Weighing shows NTEP-certified SPS 3D systems with an open web-service API for WMS and ERP connections. Teams can start with one audit or receiving point. They can add more units after throughput data proves the value. The same approach can support container weighing systems when teams use both weight and size data for shipment prep. Local service can affect how fast a multi-site rollout moves.
Which country CAGRs are profiled in the Cubing Systems Market?
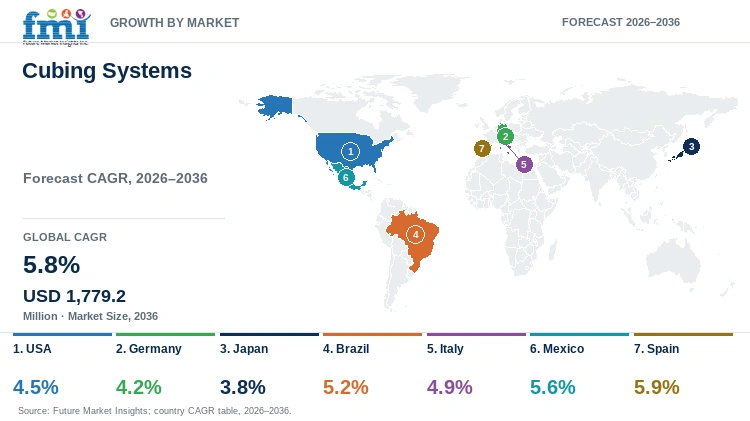
| Country | CAGR |
|---|---|
| USA | 4.5% |
| Germany | 4.2% |
| Japan | 3.8% |
| Brazil | 5.2% |
| Italy | 4.9% |
| Mexico | 5.6% |
| Spain | 5.9% |
How do country-level CAGRs compare in the Cubing Systems Market?
Growth differs between new sites and replacement projects. Spain, Mexico and Brazil have faster modeled CAGRs under their own rollout needs. The USA, Germany and Japan depend more on retrofit or replacement work. Existing automation can make system setup longer and add more acceptance tests at older sites.
- USA combines large e-commerce activity with strict billing measurement needs.
- Germany relies more on retrofits across established parcel automation networks.
- Japan favors compact systems that can integrate with existing operations.
- Brazil needs broad regional service as freight activity expands.
- Italy supports phased automation across warehouses with mixed shipment volumes.
- Mexico connects cubing demand with cross-border freight work.
- Spain expands demand for modular systems through widespread e-commerce sales.
Similar CAGRs can still create different buying needs because system setup and service vary by country. The full report provides country-level CAGR analysis across North America, Latin America, Western Europe and Eastern Europe. It also covers East Asia, South Asia and Pacific, and the Middle East and Africa.
Country-wise Analysis
- Cubing systems demand in the USA is forecast to rise at 4.5% CAGR over the forecast period. Heavy parcel activity and billing needs support this growth. The U.S. Census Bureau expected second-quarter 2026 retail e-commerce sales at USD 340.2 billion. E-commerce made up 17.1% of total retail sales in the quarter. NIST Handbook 44 gives a national code for devices that measure several dimensions. Many sites already use conveyor and shipping systems. New cubers must work with that installed setup. Teams need reliable system links and logged accuracy checks. Parcel and freight visibility improves when one shipment record moves into later systems. Shared records also help teams keep a clear audit trail.
- Germany's cubing systems outlook is expected to advance at 4.2% CAGR over the assessment period. A mature parcel network and local retrofit work support this growth. Bundesnetzagentur reported 4.36 billion parcels carried within Germany and across borders in 2023. Parcel revenue reached EUR 19.19 billion in the same year. Older networks create retrofit jobs that must work with current sorters and warehouse software. Legal measurement rules add another approval step for trade use. Good start-up work and local service help protect uptime after setup. Suppliers also need to prove repeatable measures without forcing a major control-system redesign. A stable start helps older sites avoid needless downtime.
- Adoption of cubing systems in Japan is expected to expand at 3.8% CAGR through 2036. Parcel sales and careful use of building space support this pace. METI measured Japan's B2C e-commerce market at 26.1 trillion yen in 2024. The total grew 5.1% from the prior year. Warehouse teams compare equipment size and uptime with measuring speed. Compact stations can update item data without taking over a full conveyor lane. Stable system links matter because current work steps leave little room for failed handoffs. Suppliers need Japanese-language support and clear accuracy check steps. A controlled test with the real item mix can lower setup risk.
- Brazil is expected to post 5.2% CAGR over the forecast period. Freight activity creates a need for faster and more consistent shipment data. The Ministry of Ports and Airports reported 308.7 thousand tonnes of air cargo in the first quarter of 2026. Air-cargo exports rose 43% and the ministry linked some demand to e-commerce. Warehouses and LTL teams also need better data even when their automation levels differ. Local service can affect uptime after setup. Remote checks and spare-parts planning matter during vendor choice. Modular stations suit teams that need better measures without a hub-scale system. Local service can cut avoidable downtime during daily work.
- Cubing systems sales in Italy are forecast to expand at 4.9% CAGR by 2036. Online retail growth and step-by-step warehouse automation support this pace. Istat reported that online retail sales rose 26.7% year over year in value during June 2026. Online sales volume increased 28.0% in the same comparison. More digital orders create more chances to measure items and outbound parcels. Many sites still work in existing buildings with mixed order volumes. Compact stations can start in one packing or receiving task before wider automation. Local support can link cubing data with current software. Good projects pair a clear payback case with room for later growth.
- Cubing systems demand in Mexico is forecast to rise at 5.6% CAGR over the forecast period. Digital commerce and the need for standard shipment data support this growth. INEGI measured e-commerce gross value added at 2.308 trillion pesos in 2024. The measure grew 7.1% in real terms from the prior year. Shipping networks include sites with different software and automation levels. That mix raises the value of flexible data exports and standard system links. Bilingual start-up help can reduce handoff problems at cross-border sites. Service near logistics routes also matters after go-live. Suppliers that support both parcel and pallet work can serve more site needs.
- Spain is expected to post 5.9% CAGR over the forecast period. A broad e-commerce base outside major parcel hubs supports demand. INE reported that 26.6% of enterprises with at least ten employees made e-commerce sales in 2024. Turnover from those sales increased 3.5% from 2023. Medium-sized sites need better measures without a full automation rebuild. Compact parcel systems and step-by-step software links suit that need. Sites with lower daily volume must still prove the payback case. Reusable setup plans and local service can help. Captured dimensions also support automated parcel delivery terminals that handle routed parcels. Reusable system links reduce duplicate data entry.
Who are the notable companies in the Cubing Systems Market?
Mettler-Toledo, SICK, Scaletronic, Datalogic, Cubiscan (Quantronix, Inc.), Rice Lake Weighing Systems, FreightSnap, Parcelcube, Dimensional Weighing, and NIDO Group operate within the defined cubing-system boundary.
Suppliers compete on the range of jobs they can cover and how well their systems connect. High-throughput projects favor systems that measure size and weight while also reading IDs and sending data to host software. Static parcel and pallet projects focus more on fast setup. Buyers also check trade-use options and local service.
- High-throughput DWS platforms: Mettler-Toledo and SICK compete with Datalogic and Scaletronic on conveyor measurement and system controls.
- Static and freight capture specialists: Cubiscan and Rice Lake Weighing Systems cover parcel and pallet work. FreightSnap focuses on shipment measurement and freight proof.
- Compact and software-led systems: Parcelcube and Dimensional Weighing focus on workstations and host-system links. NIDO Group covers static and dynamic DWS setups.
Competitive Benchmarking: Cubing Systems Market
| Company | Workflow Coverage | Host-System Integration | Freight and Parcel Breadth | Geographic Reach |
|---|---|---|---|---|
| Mettler-Toledo | High | High | High | Global |
| SICK | High | Medium | High | Global |
| Scaletronic | High | High | High | Europe plus international representation |
| Datalogic | Low | Medium | Low | Global |
| Cubiscan (Quantronix, Inc.) | High | High | High | North America plus international partners |
| Rice Lake Weighing Systems | High | High | High | Global |
| FreightSnap | High | High | High | North America plus international partners |
| Parcelcube | Low | High | Low | Europe plus international resellers |
| Dimensional Weighing | High | High | High | United States |
| NIDO Group | Medium | High | Medium | India-led warehouse automation delivery |
Scoring basis: High workflow coverage requires static and in-motion systems for parcel plus pallet or freight use. Medium covers two workflow classes. Low covers one. High host integration requires an API or a direct link to WMS or TMS or ERP software. Medium requires a recorded network link. Low requires basic output. High freight and parcel breadth requires systems for both formats. Medium covers one format in several modes. Low covers one recorded format.
Key Developments in the Cubing Systems Market
- In June 2026, FreightSnap announced a strategic channel partnership with Shiplify. The partnership combines certified shipment measurement and photo proof with accessorial intelligence for LTL work.
- In February 2026, Cubiscan launched the N9 pallet parcel-size system for LTL freight work. One scan gives automated dimensions and photo records.
- In February 2026, SICK said its LogiMAT display would include the new Cargosizer. The system gives 3D pallet load dimensions and volume data for billing and planning.
Key Players in the Cubing Systems Market
High-throughput DWS platforms
- Mettler-Toledo
- SICK
- Scaletronic
- Datalogic
Static and freight capture specialists
- Cubiscan (Quantronix, Inc.)
- Rice Lake Weighing Systems
- FreightSnap
Compact and software-led cubing tools
- Parcelcube
- Dimensional Weighing
- NIDO Group
Cubing Systems Market - Report Scope
| Coverage field | Report scope |
|---|---|
| Market breakdown | By System Type, Technology, End Use, Throughput, Sales Channel, and Region. |
| Quantitative Units | USD million. |
| Market Definition | Revenue includes cubing-system hardware and embedded control software supplied with the equipment plus configuration, installation, and related service or aftermarket revenue. Downstream parcel or freight revenue and standalone scales or barcode scanners are excluded. Independent WMS or TMS licenses and adjacent sortation machinery are also excluded. |
| Regions Covered | North America, Latin America, Western Europe, Eastern Europe, East Asia, South Asia and Pacific, and Middle East and Africa. |
| Countries Covered | USA, Germany, Japan, Brazil, Italy, Mexico, Spain, and more than twenty-five additional countries in the full report. |
| Key Companies Profiled | Mettler-Toledo, SICK, Scaletronic, Datalogic, Cubiscan (Quantronix, Inc.), Rice Lake Weighing Systems, FreightSnap, Parcelcube, Dimensional Weighing, and NIDO Group. |
| Forecast Period | 2026 to 2036. |
| Approach | Primary and secondary research with market triangulation. |
Cubing Systems Market - Research Methodology
| Method | Approach |
|---|---|
| Primary Research | FMI analysts gathered input from manufacturers, service providers, technology developers, distributors, end users, procurement teams, and subject-matter experts. Interviews examined purchasing decisions, product or service evaluation, adoption barriers, approval requirements, pricing considerations, and expectations for technical or commercial support. Respondents were also asked what evidence is required before a trial, pilot, or initial order develops into regular purchasing. |
| Desk Research | Desk research covered government statistics, regulatory publications, trade data, industry associations, technical literature, standards, company filings, product information, and official corporate announcements. Sources were reviewed for relevance, publication date, geographic coverage, and consistency with the defined market scope. Claims relating to performance, applications, approvals, capacity, investment, and commercial activity were retained only when supported by credible public evidence. |
| Market Sizing and Forecasting | The market model combined the baseline value with historical performance, segment structure, pricing and volume indicators, adoption levels, company participation, and country-level demand conditions. Forecast assumptions considered economic activity, investment trends, regulatory developments, technology adoption, purchasing cycles, supply availability, and barriers to wider market use. Segment and regional estimates were reconciled before the final market total was calculated. |
| Data Validation | Estimates were checked against multiple independent indicators, including public data, company activity, trade patterns, industry developments, and findings from primary interviews. Validation also tested whether products, services, applications, and company revenues fell within the defined market boundaries. Adjacent categories, unsupported claims, overlapping revenues, and activities without direct market relevance were excluded to reduce double counting and maintain consistency across segments and countries. |
Cubing Systems Market by Segments
Cubing Systems Market segmented by System Type:
- Parcel cubing systems
- Pallet cubing systems
- Freight cubing stations
- Mobile cubing carts
- Integrated WMS cubers
Cubing Systems Market segmented by Technology:
- 3D imaging
- Laser measurement
- Ultrasonic measurement
- Camera-based dimensioning
- Weigh-cube systems
Cubing Systems Market segmented by End Use:
- E-commerce fulfillment
- LTL freight
- Parcel carriers
- Warehouses
- Retail distribution
Cubing Systems Market segmented by Throughput:
- Low throughput
- Medium throughput
- High throughput
- Very high automated
Cubing Systems Market segmented by Sales Channel:
- Automation integrators
- Direct system suppliers
- WMS partners
- Aftermarket/service
Cubing Systems Market by Region:
- North America
- United States
- Canada
- Latin America
- Brazil
- Mexico
- Argentina
- Chile
- Rest of Latin America
- Western Europe
- Germany
- France
- United Kingdom
- Italy
- Spain
- Benelux
- Nordics
- Rest of Western Europe
- Eastern Europe
- Poland
- Czech Republic
- Romania
- Hungary
- Balkan and Baltic States
- Rest of Eastern Europe
- East Asia
- China
- Japan
- South Korea
- South Asia and Pacific
- India
- ASEAN
- Australia and New Zealand
- Rest of South Asia and Pacific
- Middle East and Africa
- GCC Countries
- South Africa
- Türkiye
- Israel
- Other African Union Countries
- Rest of Middle East and Africa
Research Sources and Bibliography
- National Motor Freight Traffic Association. (n.d.). How shippers can prepare for the 2025 NMFC changes. Retrieved September 20, 2026.
- National Motor Freight Traffic Association. (2026, April 7). NMFC Changes FAQ: Density and class breaks for the new 13-sub structure.
- Minnich, L., Lee, G., Williams, J., Baucom, I., Konijnenburg, J., McGuire, J., & Lippa, K. (2026). NIST Handbook 44: Specifications, tolerances and other technical requirements for weighing and measuring devices (2026 ed.). National Institute of Standards and Technology.
- U.S. Census Bureau. (2026, August 18). Quarterly retail e-commerce sales: Second quarter 2026.
- Bundesnetzagentur. (2025, April 2). Veröffentlichung der Zahlen für den Brief- und Paketmarkt 2023.
- Ministry of Economy, Trade and Industry, Japan. (2025, August 26). Results of FY2024 e-commerce market survey compiled.
- Ministry of Ports and Airports, Brazil. (2026, May 22). Exportações por carga aérea crescem 43% no primeiro trimestre de 2026.
- Istat. (2026, August 4). Retail trade - June 2026.
- Instituto Nacional de Estadística y Geografía. (2026, February 18). Valor Agregado Bruto del Comercio Electrónico 2024.
- Instituto Nacional de Estadística, Spain. (2025, October 22). Survey on the use of ICT and e-commerce in enterprises: Year 2024 - first quarter 2025.
- FreightSnap. (2026, June 28). FreightSnap and Shiplify announce strategic partnership to bring greater transparency and trust to LTL freight.
- Cubiscan. (2026, February 5). Cubiscan introduces N9 pallet dimensioning system to eliminate LTL reclasses and modernize warehouse data capture.
- SICK. (2026, February 3). Delivering more than just details: Smart sensors and digital solutions for intralogistics.
- Cubiscan. (2026, August 13). In-motion dimensioning for high-volume operations: A technical guide for systems integrators.
- Rice Lake Weighing Systems. (2026, March 10). Rice Lake's logistics solutions at MODEX 2026.
- Rice Lake Weighing Systems. (2026). All dimensioning systems.
- Datalogic. (n.d.). DM3610: Ultra-high performance in-motion overhead dimensioning unit. Retrieved September 20, 2026.
- SICK. (n.d.). DWS Dynamic: Dynamic identification measurement and weighing of objects. Retrieved September 20, 2026.
- Scaletronic. (n.d.). Scalable logistics automation by Scaletronic. Retrieved September 20, 2026.
- Dimensional Weighing. (n.d.). Static Package System 3D. Retrieved September 20, 2026.
- Dimensional Weighing. (n.d.). In-motion cubing systems for high-speed warehouse and distribution operations. Retrieved September 20, 2026.
- Parcelcube. (n.d.). Dimensioning software. Retrieved September 20, 2026.
- NIDO Automation. (n.d.). Dimensioning and weighing systems. Retrieved September 20, 2026.
- Cubiscan. (n.d.). International distributors. Retrieved September 20, 2026.
- Mettler-Toledo. (n.d.). Pallet and parcel dimensioning. Retrieved September 20, 2026.
- Mettler-Toledo. (n.d.). Global presence. Retrieved September 20, 2026.
- Rice Lake Weighing Systems. (n.d.). How to buy Rice Lake products. Retrieved September 20, 2026.
- Scaletronic. (n.d.). Pallet data capture. Retrieved September 20, 2026.
- Scaletronic. (n.d.). Software for high speed data capture and sortation. Retrieved September 20, 2026.
- FreightSnap. (n.d.). Dimensioning system products and solutions. Retrieved September 20, 2026.
- Dimensional Weighing. (n.d.). Pallet and large freight dimensioning. Retrieved September 20, 2026.
- Parcelcube. (n.d.). Resellers and distributors worldwide. Retrieved September 20, 2026.
- Datalogic. (n.d.). At a glance. Retrieved September 20, 2026.
- NIDO Automation. (n.d.). Static DWS system. Retrieved September 20, 2026.
- FreightSnap. (n.d.). International distributors. Retrieved September 20, 2026.
- SICK. (2023, October 15). We are SICK.
- European Parliament and Council of the European Union. (2026, March 11). Directive (EU) 2026/706 amending Directive 2014/32/EU on measuring instruments.
- Mettler-Toledo. (2026). Data Capture Software: Seamless connectivity and effective data management.
- SICK. (2026, February 19). DWS Pallet: Data sheet.
- NIDO Automation. (2026, March 30). Meet us at Intralogistics & Warehousing Expo.
- Parcelcube. (2026, March 25). Static dimensioning system: What is it and why do warehouses need it?
This bibliography is for reader reference. The full report contains the complete reference list and detailed citations.
This Report Answers
- How freight rules based on density change the value of cubing data.
- Which system type and technology segments hold the main 2026 shares.
- Why medium-throughput sites can pay back automation without a hub-scale rebuild.
- How country needs change setup plans and local service needs.
- Which companies offer both static and in-motion cubing with host-system links.
- How legal measurement rules and accuracy checks can slow a production rollout.
- What buyers should test before they use one station at several sites.
- How shipment images can help with freight reclass and invoice disputes.
Frequently Asked Questions
How big is the Mineral Processing Dispersants Market in 2026?
The Mineral Processing Dispersants Market is valued at USD 1,151.7 million in 2026. Demand is supported by the need to improve slurry handling, particle dispersion, and process efficiency across mineral beneficiation operations.
What is the CAGR of the Mineral Processing Dispersants Market from 2026 to 2036?
The Mineral Processing Dispersants Market is expected to grow at 5.8% CAGR between 2026 and 2036. Expansion is driven by increasing focus on ore recovery, water management, and process optimization in mining and mineral processing facilities.
Which chemistry leads the Mineral Processing Dispersants Market?
Polyacrylates are expected to hold 31.0% of chemistry demand in the Mineral Processing Dispersants Market in 2026. Their effective particle dispersion properties help improve slurry stability and processing performance.
Which application leads the Mineral Processing Dispersants Market?
Grinding dispersion is expected to account for 28.0% of application demand in the Mineral Processing Dispersants Market in 2026. Efficient dispersion during grinding supports better particle separation and downstream processing outcomes.
Which end use leads the Mineral Processing Dispersants Market?
Mining is expected to hold 41.0% of end-use demand in the Mineral Processing Dispersants Market in 2026. High mineral throughput and the need for efficient processing workflows sustain dispersant consumption across mining operations.
Preview the report firsthand - request a free sample
Get SampleGet the brochure for pricing and purchase details.
Get PDFTable of Content
- Key Takeaways
- Market Size and CAGR
- Top Growth Driver
- Fastest Growing Segment
- Leading Region
- Key Companies
- Emerging Opportunities
- Executive Summary
- Global Market Outlook
- Demand-side Trends
- Supply-side Trends
- Technology Roadmap Analysis
- Analysis and Recommendations
- Analyst Perspective (What is happening? Why now? What should investors know?)
- Key Questions Answered
- How large is the market?
- What is the CAGR?
- What are key trends?
- Which region dominates?
- Who are the leaders?
- Market Overview
- Market Coverage / Taxonomy
- Market Definition / Scope / Limitations
- Research Methodology
- Chapter Orientation
- Analytical Lens and Working Hypotheses
- Market Structure, Signals, and Trend Drivers
- Benchmarking and Cross-market Comparability
- Market Sizing, Forecasting, and Opportunity Mapping
- Research Design and Evidence Framework
- Desk Research Programme (Secondary Evidence)
- Expert Input and Fieldwork (Primary Evidence)
- Tooling, Models, and Reference Databases
- Data Engineering and Model Build
- Quality Assurance and Audit Trail
- Market Background
- Market Dynamics (Drivers, Restraints, Opportunity, Trends)
- Scenario Forecast (Optimistic, Likely, Conservative)
- Impact Analysis
- AI Impact
- Sustainability Impact
- Regulatory Impact
- Technology Impact
- Consumer / Buyer Analysis
- Purchase Drivers
- Adoption Barriers
- Buyer Journey
- Opportunity Map Analysis
- Product Life Cycle Analysis
- Supply Chain Analysis
- Investment Feasibility Matrix
- Value Chain Analysis
- PESTLE and Porter's Analysis
- Regulatory Landscape
- Regional Parent Market Outlook
- Production and Consumption Statistics
- Import and Export Statistics
- Global Market Analysis and Forecast, 2021 to 2036
- Historical Market Size Value (USD Million) Analysis, 2021 to 2025
- Current and Future Market Size Value (USD Million) Projections, 2026 to 2036
- Y-o-Y Growth Trend Analysis
- Absolute $ Opportunity Analysis
- Global Market Pricing Analysis, 2021 to 2036
- Global Market Analysis and Forecast, By System Type, 2021 to 2036
- Introduction / Key Findings
- Historical Market Size Value (USD Million) Analysis By System Type, 2021 to 2025
- Current and Future Market Size Value (USD Million) Analysis and Forecast By System Type, 2026 to 2036
- Parcel cubing systems
- Pallet cubing systems
- Freight cubing stations
- Mobile cubing carts
- Integrated WMS cubers
- Y-o-Y Growth Trend Analysis By System Type, 2021 to 2025
- Absolute $ Opportunity Analysis By System Type, 2026 to 2036
- Global Market Analysis and Forecast, By Technology, 2021 to 2036
- Introduction / Key Findings
- Historical Market Size Value (USD Million) Analysis By Technology, 2021 to 2025
- Current and Future Market Size Value (USD Million) Analysis and Forecast By Technology, 2026 to 2036
- 3D imaging
- Laser measurement
- Ultrasonic measurement
- Camera-based dimensioning
- Weigh-cube systems
- Y-o-Y Growth Trend Analysis By Technology, 2021 to 2025
- Absolute $ Opportunity Analysis By Technology, 2026 to 2036
- Global Market Analysis and Forecast, By End Use, 2021 to 2036
- Introduction / Key Findings
- Historical Market Size Value (USD Million) Analysis By End Use, 2021 to 2025
- Current and Future Market Size Value (USD Million) Analysis and Forecast By End Use, 2026 to 2036
- E-commerce fulfillment
- LTL freight
- Parcel carriers
- Warehouses
- Retail distribution
- Y-o-Y Growth Trend Analysis By End Use, 2021 to 2025
- Absolute $ Opportunity Analysis By End Use, 2026 to 2036
- Global Market Analysis and Forecast, By Throughput, 2021 to 2036
- Introduction / Key Findings
- Historical Market Size Value (USD Million) Analysis By Throughput, 2021 to 2025
- Current and Future Market Size Value (USD Million) Analysis and Forecast By Throughput, 2026 to 2036
- Low throughput
- Medium throughput
- High throughput
- Very high automated
- Y-o-Y Growth Trend Analysis By Throughput, 2021 to 2025
- Absolute $ Opportunity Analysis By Throughput, 2026 to 2036
- Global Market Analysis and Forecast, By Sales Channel, 2021 to 2036
- Introduction / Key Findings
- Historical Market Size Value (USD Million) Analysis By Sales Channel, 2021 to 2025
- Current and Future Market Size Value (USD Million) Analysis and Forecast By Sales Channel, 2026 to 2036
- Automation integrators
- Direct system suppliers
- WMS partners
- Aftermarket/service
- Y-o-Y Growth Trend Analysis By Sales Channel, 2021 to 2025
- Absolute $ Opportunity Analysis By Sales Channel, 2026 to 2036
- Global Market Analysis and Forecast, By Region, 2021 to 2036
- Introduction
- Historical Market Size Value (USD Million) Analysis By Region, 2021 to 2025
- Current Market Size Value (USD Million) Analysis and Forecast By Region, 2026 to 2036
- North America
- Latin America
- Western Europe
- Eastern Europe
- East Asia
- South Asia and Pacific
- Middle East and Africa
- Market Attractiveness Analysis By Region
- North America Market Analysis and Forecast, By Country, 2021 to 2036
- Historical Market Size Value (USD Million) Trend Analysis By Market Taxonomy, 2021 to 2025
- Market Size Value (USD Million) Forecast By Market Taxonomy, 2026 to 2036
- By Country
- United States
- Canada
- By System Type
- By Technology
- By End Use
- By Throughput
- By Sales Channel
- By Country
- Market Attractiveness Analysis
- By Country
- By System Type
- By Technology
- By End Use
- By Throughput
- By Sales Channel
- Key Takeaways
- Latin America Market Analysis and Forecast, By Country
- Historical Market Size Value (USD Million) Trend Analysis By Market Taxonomy, 2021 to 2025
- Market Size Value (USD Million) Forecast By Market Taxonomy, 2026 to 2036
- By Country
- Brazil
- Mexico
- Argentina
- Chile
- Rest of Latin America
- By System Type
- By Technology
- By End Use
- By Throughput
- By Sales Channel
- By Country
- Market Attractiveness Analysis
- By Country
- By System Type
- By Technology
- By End Use
- By Throughput
- By Sales Channel
- Key Takeaways
- Western Europe Market Analysis and Forecast, By Country
- Historical Market Size Value (USD Million) Trend Analysis By Market Taxonomy, 2021 to 2025
- Market Size Value (USD Million) Forecast By Market Taxonomy, 2026 to 2036
- By Country
- Germany
- France
- United Kingdom
- Italy
- Spain
- Benelux
- Nordics
- Rest of Western Europe
- By System Type
- By Technology
- By End Use
- By Throughput
- By Sales Channel
- By Country
- Market Attractiveness Analysis
- By Country
- By System Type
- By Technology
- By End Use
- By Throughput
- By Sales Channel
- Key Takeaways
- Eastern Europe Market Analysis and Forecast, By Country
- Historical Market Size Value (USD Million) Trend Analysis By Market Taxonomy, 2021 to 2025
- Market Size Value (USD Million) Forecast By Market Taxonomy, 2026 to 2036
- By Country
- Poland
- Czech Republic
- Romania
- Hungary
- Balkan and Baltic States
- Rest of Eastern Europe
- By System Type
- By Technology
- By End Use
- By Throughput
- By Sales Channel
- By Country
- Market Attractiveness Analysis
- By Country
- By System Type
- By Technology
- By End Use
- By Throughput
- By Sales Channel
- Key Takeaways
- East Asia Market Analysis and Forecast, By Country
- Historical Market Size Value (USD Million) Trend Analysis By Market Taxonomy, 2021 to 2025
- Market Size Value (USD Million) Forecast By Market Taxonomy, 2026 to 2036
- By Country
- China
- Japan
- South Korea
- By System Type
- By Technology
- By End Use
- By Throughput
- By Sales Channel
- By Country
- Market Attractiveness Analysis
- By Country
- By System Type
- By Technology
- By End Use
- By Throughput
- By Sales Channel
- Key Takeaways
- South Asia and Pacific Market Analysis and Forecast, By Country
- Historical Market Size Value (USD Million) Trend Analysis By Market Taxonomy, 2021 to 2025
- Market Size Value (USD Million) Forecast By Market Taxonomy, 2026 to 2036
- By Country
- India
- ASEAN
- Australia and New Zealand
- Rest of South Asia and Pacific
- By System Type
- By Technology
- By End Use
- By Throughput
- By Sales Channel
- By Country
- Market Attractiveness Analysis
- By Country
- By System Type
- By Technology
- By End Use
- By Throughput
- By Sales Channel
- Key Takeaways
- Middle East and Africa Market Analysis and Forecast, By Country
- Historical Market Size Value (USD Million) Trend Analysis By Market Taxonomy, 2021 to 2025
- Market Size Value (USD Million) Forecast By Market Taxonomy, 2026 to 2036
- By Country
- GCC Countries
- South Africa
- Türkiye
- Israel
- Other African Union Countries
- Rest of Middle East and Africa
- By System Type
- By Technology
- By End Use
- By Throughput
- By Sales Channel
- By Country
- Market Attractiveness Analysis
- By Country
- By System Type
- By Technology
- By End Use
- By Throughput
- By Sales Channel
- Key Takeaways
- Key Countries Market Analysis
- United States
- Pricing Analysis
- Market Share Analysis, 2025
- By System Type
- By Technology
- By End Use
- By Throughput
- By Sales Channel
- Canada
- Pricing Analysis
- Market Share Analysis, 2025
- By System Type
- By Technology
- By End Use
- By Throughput
- By Sales Channel
- Mexico
- Pricing Analysis
- Market Share Analysis, 2025
- By System Type
- By Technology
- By End Use
- By Throughput
- By Sales Channel
- Brazil
- Pricing Analysis
- Market Share Analysis, 2025
- By System Type
- By Technology
- By End Use
- By Throughput
- By Sales Channel
- Chile
- Pricing Analysis
- Market Share Analysis, 2025
- By System Type
- By Technology
- By End Use
- By Throughput
- By Sales Channel
- Germany
- Pricing Analysis
- Market Share Analysis, 2025
- By System Type
- By Technology
- By End Use
- By Throughput
- By Sales Channel
- United Kingdom
- Pricing Analysis
- Market Share Analysis, 2025
- By System Type
- By Technology
- By End Use
- By Throughput
- By Sales Channel
- Italy
- Pricing Analysis
- Market Share Analysis, 2025
- By System Type
- By Technology
- By End Use
- By Throughput
- By Sales Channel
- Spain
- Pricing Analysis
- Market Share Analysis, 2025
- By System Type
- By Technology
- By End Use
- By Throughput
- By Sales Channel
- France
- Pricing Analysis
- Market Share Analysis, 2025
- By System Type
- By Technology
- By End Use
- By Throughput
- By Sales Channel
- India
- Pricing Analysis
- Market Share Analysis, 2025
- By System Type
- By Technology
- By End Use
- By Throughput
- By Sales Channel
- ASEAN
- Pricing Analysis
- Market Share Analysis, 2025
- By System Type
- By Technology
- By End Use
- By Throughput
- By Sales Channel
- Australia and New Zealand
- Pricing Analysis
- Market Share Analysis, 2025
- By System Type
- By Technology
- By End Use
- By Throughput
- By Sales Channel
- China
- Pricing Analysis
- Market Share Analysis, 2025
- By System Type
- By Technology
- By End Use
- By Throughput
- By Sales Channel
- Japan
- Pricing Analysis
- Market Share Analysis, 2025
- By System Type
- By Technology
- By End Use
- By Throughput
- By Sales Channel
- South Korea
- Pricing Analysis
- Market Share Analysis, 2025
- By System Type
- By Technology
- By End Use
- By Throughput
- By Sales Channel
- Poland
- Pricing Analysis
- Market Share Analysis, 2025
- By System Type
- By Technology
- By End Use
- By Throughput
- By Sales Channel
- Hungary
- Pricing Analysis
- Market Share Analysis, 2025
- By System Type
- By Technology
- By End Use
- By Throughput
- By Sales Channel
- Türkiye
- Pricing Analysis
- Market Share Analysis, 2025
- By System Type
- By Technology
- By End Use
- By Throughput
- By Sales Channel
- South Africa
- Pricing Analysis
- Market Share Analysis, 2025
- By System Type
- By Technology
- By End Use
- By Throughput
- By Sales Channel
- United States
- Market Structure Analysis
- Competition Dashboard
- Competition Benchmarking
- Market Share Analysis of Top Players
- By Regional
- By System Type
- By Technology
- By End Use
- By Throughput
- By Sales Channel
- Emerging Startups
- Innovation Benchmarking
- Competition Analysis
- Competition Deep Dive
- Mettler-Toledo
- Overview
- Product Portfolio
- Profitability by Market Segments
- Sales Footprint
- Strategy Overview
- Marketing Strategy
- Product Strategy
- Channel Strategy
- SICK
- Scaletronic
- Datalogic
- Cubiscan (Quantronix, Inc.)
- Rice Lake Weighing Systems
- FreightSnap
- Parcelcube
- Dimensional Weighing
- NIDO Group
- Mettler-Toledo
- Case Studies
- Success Stories
- Recent Developments
- Competition Deep Dive
- Assumptions & Acronyms Used


