Damaged Starch Analyzer Market Forecast and Outlook 2025 to 2035

The damaged starch analyzers market is set to rise from USD 162 billion in 2025 to USD 282.0 billion by 2035 at a 5.7% CAGR. Growth is being anchored by flour milling and industrial baking, where tighter specification windows require consistent starch damage measurement to stabilize dough absorption, fermentation behavior, and crumb structure. Pharmaceutical excipient control is being treated as a second engine, since tablet hardness, disintegration, and release profiles depend on well-characterized starch fractions. In practical terms, procurement has shifted toward automated systems that cut operator variability, integrate LIMS, and deliver audit-ready traceability.

The Ampere method retains the installed-base edge in mills for speed and cost, while enzymatic assays gain traction in pharma and R&D for higher specificity. Asia Pacific is expected to post the fastest adoption due to millennial modernization and regulatory tightening in China and India. Europe sustains share through process discipline and standardization, and North America focuses on throughput, digital connectivity, and compliance documentation. Barriers do exist. Calibration governance, method comparability, and total cost of ownership still slow smaller plants. Even so, the competitive advantage sits with vendors that ship validated, multi-method platforms, deliver field calibration programs, and back it with dense service networks.
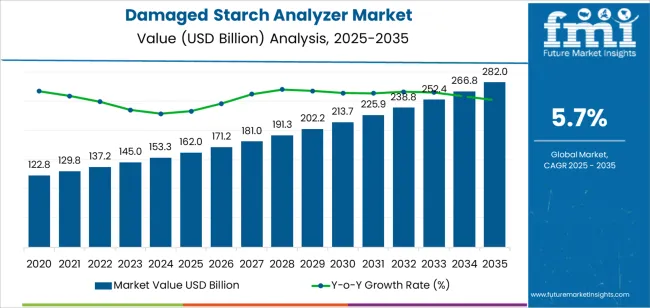
Quick Stats for Damaged Starch Analyzer Market

  • Damaged Starch Analyzer Market Value (2025): USD 162 billion
  • Damaged Starch Analyzer Market Forecast Value (2035): USD 282.0 billion
  • Damaged Starch Analyzer Market CAGR: 5.7%
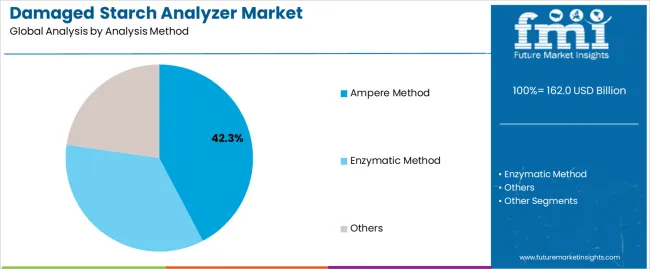
  • Leading Segment by Analysis Method (2025): Ampere Method (42.3%)
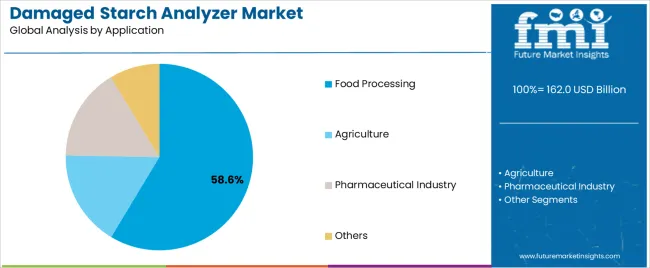
  • Leading Segment by Application (2025): Food Processing (58.6%)
  • Leading Segment by Distribution Channel (2025): Direct Sales (67.4%)
  • Key Growth Regions: Asia Pacific, Europe, and North America
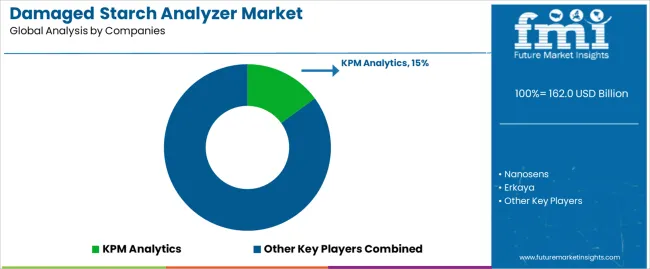
  • Top Companies by Market Share: KPM Analytics, Nanosens, Erkaya

Damaged Starch Analyzer Market Market Value Analysis

Pharmaceutical companies require precise damaged starch measurements to optimize excipient performance in tablet formulations and controlled-release applications. Agricultural research institutions are investing in advanced testing equipment to support crop breeding programs focused on starch quality improvement and variety selection.

Regional dynamics demonstrate concentrated growth in established manufacturing economies with mature food processing infrastructure and expanding pharmaceutical sectors. Asian markets, led by China and India, are experiencing accelerated adoption driven by food safety regulation enhancement and pharmaceutical manufacturing expansion. European markets maintain steady growth supported by stringent quality standards and continuous process improvement initiatives in food manufacturing. North American operations focus on automation integration and efficiency optimization across laboratory testing workflows.

Technology adoption patterns reflect the transition from manual testing procedures to automated measurement systems capable of rapid sample processing and comprehensive data analysis. Laboratory equipment manufacturers are developing integrated platforms that combine multiple testing methodologies with digital data management capabilities, addressing manufacturer requirements for operational efficiency and regulatory compliance. The market faces ongoing challenges related to equipment calibration requirements, measurement standardization across testing methodologies, and cost justification for smaller manufacturing operations with limited testing volumes.

Damaged Starch Analyzer Market Key Takeaways

Metric Value
Market Value (2025) USD 162 billion
Market Forecast Value (2035) USD 282.0 billion
Forecast CAGR (2025-2035) 5.7%

Why is the Damaged Starch Analyzer Market Growing?

QUALITY CONTROL REQUIREMENTS REGULATORY COMPLIANCE TECHNOLOGICAL ADVANCEMENT
Food Processing Standards Increasing quality specifications in flour milling and bakery ingredient manufacturing requiring precise starch damage measurement for product consistency and performance optimization. Pharmaceutical Excipient Testing Growing pharmaceutical manufacturing complexity demanding accurate starch characterization for excipient functionality and formulation stability in tablet production. Agricultural Breeding Programs Crop development initiatives requiring comprehensive starch quality assessment for variety selection and improvement programs across wheat and grain production. Food Safety Regulations Regulatory frameworks establishing mandatory quality testing protocols favoring automated measurement systems with comprehensive documentation capabilities. Pharmaceutical Manufacturing Standards GMP requirements necessitating validated testing methodologies and equipment qualification procedures for excipient characterization and quality verification. International Quality Standards ISO certification requirements and export market specifications driving investment in standardized testing equipment with traceability capabilities. Automated Testing Systems Development of integrated measurement platforms combining multiple testing methodologies with digital data management and reduced manual intervention requirements. Enhanced Measurement Accuracy Advanced sensor technologies and calibration procedures enabling precise starch damage quantification across diverse sample matrices and application requirements. Digital Integration Capabilities Laboratory information management systems integration and remote monitoring features supporting operational efficiency and regulatory compliance documentation.

How Is the Market Divided by Method, Application, and Region?

Category Segments Covered
By Analysis Method Ampere Method, Enzymatic Method, Others
By Application Food Processing, Agriculture, Pharmaceutical Industry, Others
By Region North America, Europe, Asia Pacific, Latin America, Middle East & Africa

Damaged Starch Analyzer Market Analysis by Analysis Method

Damaged Starch Analyzer Market Analysis By Analysis Method

Segment 2025 to 2035 Outlook
Ampere Method
  • Leader in 2025 with 42.3% market share projected to maintain dominance through 2035. Established measurement protocol with standardized procedures across flour milling operations and bakery ingredient testing. Rapid sample processing capability and proven correlation with baking performance characteristics.
  • Momentum: steady growth driven by food processing applications and equipment cost advantages.
  • Watchouts: competition from enzymatic methods in pharmaceutical applications and calibration maintenance requirements.
Enzymatic Method
  • Advancing segment with 36.8% market share benefiting from pharmaceutical manufacturing requirements and research applications. Superior accuracy for specific starch fraction measurement and compatibility with diverse sample matrices. Growing adoption in quality research programs and specialty applications requiring detailed starch characterization.
  • Momentum: rising through pharmaceutical sector expansion and laboratory automation integration.
  • Watchouts: higher reagent costs and extended testing time compared to electrical methods.
Others
  • Niche segment with 20.9% market share encompassing emerging measurement technologies and specialized testing protocols. Limited commercial adoption with focus on research institutions and method development programs. Small installed base concentrated in advanced laboratory facilities and university research centers.
  • Momentum: selective adoption in specialized research applications and method validation programs.
  • Watchouts: standardization challenges and limited equipment availability from mainstream manufacturers.

Damaged Starch Analyzer Market Analysis by Application

Damaged Starch Analyzer Market Analysis By Application

Segment 2025 to 2035 Outlook
Food Processing
  • Dominant segment at 58.6% market share in 2025 with established testing infrastructure across flour milling and bakery ingredient operations. Critical for product quality control and formulation optimization across industrial baking applications. Mature measurement protocols with standardized procedures and equipment specifications.
  • Momentum: steady growth driven by food safety regulations and quality improvement programs.
  • Watchouts: cost pressure from commodity flour markets and equipment maintenance requirements in high-volume testing operations.
Agriculture
  • Growing segment with 23.4% market share driven by crop breeding programs and grain quality assessment requirements. Essential for variety selection and crop improvement initiatives focusing on starch quality characteristics. Adoption concentrated in research institutions and seed development companies.
  • Momentum: moderate growth through agricultural research programs and grain quality enhancement initiatives.
  • Watchouts: seasonal testing patterns and budget constraints in public research institutions affecting equipment procurement.
Pharmaceutical Industry
  • Expanding segment at 12.7% share focused on excipient characterization and tablet formulation development. Premium applications requiring validated measurement methodologies and equipment qualification procedures. High margins supporting investment in advanced testing capabilities.
  • Momentum: strong growth driven by pharmaceutical manufacturing expansion and quality requirements.
  • Watchouts: regulatory validation complexity and equipment qualification expenses for GMP operations.
Others
  • Residual segment with 5.3% market share encompassing diverse industrial applications including adhesive manufacturing and paper production. Small volume with specialized testing requirements and limited standardized protocols. Adoption concentrated in specific industrial operations with starch-based material applications.
  • Momentum: flat to modest growth with application-specific requirements.
  • Watchouts: limited equipment optimization for specialized applications and small market size constraining manufacturer investment.

DRIVERS

DRIVERS RESTRAINTS KEY TRENDS
Quality Control Enhancement Expanding food processing quality requirements and pharmaceutical manufacturing standards driving investment in precise measurement systems for starch characterization and performance optimization. Laboratory Automation Growing emphasis on testing efficiency and throughput capacity creating demand for automated analysis systems with digital data management and reduced manual intervention. Regulatory Compliance Food safety regulations and pharmaceutical manufacturing standards requiring validated testing methodologies with comprehensive documentation and traceability capabilities. Equipment Cost Barriers High initial investment requirements and calibration maintenance expenses limiting adoption among smaller manufacturing operations and research institutions with constrained budgets. Standardization Challenges Variations in measurement methodologies across different testing protocols affecting result comparability and complicating equipment selection for diverse applications. Technical Expertise Requirements Specialized knowledge needed for equipment operation and result interpretation creating adoption barriers in facilities with limited technical staff and training resources. Digital Integration Laboratory information management system connectivity and automated data analysis capabilities enabling enhanced operational efficiency and regulatory compliance documentation. Multiparameter Platforms Development of integrated testing equipment combining starch damage measurement with additional quality parameters in unified systems supporting comprehensive ingredient characterization. Remote Monitoring Cloud connectivity and predictive maintenance capabilities providing operational insights and reducing equipment downtime through proactive service interventions.

Analysis of Damaged Starch Analyzer Market by Key Countries

Damaged Starch Analyzer Market Cagr Analysis By Country

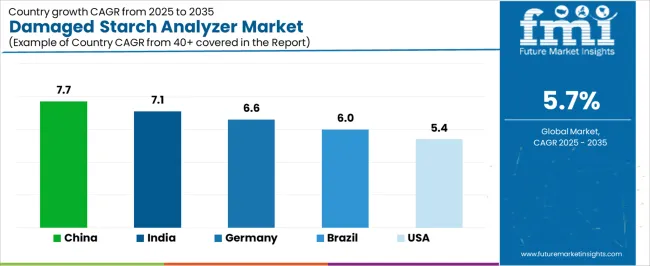
Country CAGR (2025-2035)
China 7.7%
India 7.1%
Germany 6.6%
Brazil 6.0%
United States 5.4%

How Is Food Processing Expansion Accelerating Market Growth in China?

Damaged Starch Analyzer Market Country Value Analysis

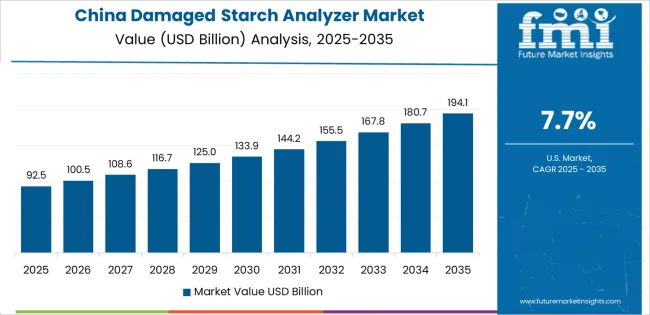
Revenue from Damaged Starch Analyzers in China is projected to exhibit strong growth with a market value of USD 76.9 million by 2035, driven by expanding flour milling infrastructure and comprehensive food safety regulation implementation creating substantial opportunities for laboratory equipment suppliers across food processing operations, pharmaceutical manufacturing facilities, and agricultural research institutions. The country's massive wheat processing capacity and expanding quality testing requirements are creating significant demand for automated measurement systems supporting operational efficiency and regulatory compliance. Major flour mills and food manufacturers are establishing comprehensive laboratory testing facilities to support large-scale production operations and meet growing domestic quality standards.

Food processing modernization programs are supporting widespread adoption of automated testing equipment across manufacturing operations, driving demand for measurement systems with proven performance capabilities. Quality standard enhancement initiatives and safety regulation implementation are creating substantial opportunities for equipment suppliers requiring reliable measurement accuracy and cost-effective operational performance. Manufacturing excellence programs and laboratory capability development are facilitating equipment adoption throughout major industrial regions.

Why Are Pharmaceutical Manufacturing Programs Enhancing Market Adoption in India?

Revenue from Damaged Starch Analyzers in India is expanding to reach USD 61.4 million by 2035, supported by extensive flour milling capacity expansion and comprehensive food processing industry development creating sustained demand for quality testing equipment across diverse manufacturing operations and agricultural research segments. The country's growing food safety awareness and expanding pharmaceutical manufacturing capabilities are driving demand for measurement systems that provide consistent analytical performance while supporting cost-effective laboratory operations. Equipment suppliers and manufacturers are investing in local service infrastructure to support growing testing requirements and equipment adoption.

Agricultural research program expansion and quality improvement initiatives are creating opportunities for testing equipment across diverse segments requiring reliable performance and competitive operational costs. Food manufacturing modernization and laboratory capability enhancement programs are driving investments in measurement systems supporting quality requirements throughout major production regions. Pharmaceutical sector growth and excipient testing development programs are enhancing demand for validated measurement equipment throughout manufacturing facilities.

How Does Precision Manufacturing Strengthen Market Leadership in Germany?

Demand for Damaged Starch Analyzers in Germany is projected to reach USD 18.7 million by 2035, supported by the country's leadership in food processing technology and advanced pharmaceutical manufacturing requiring sophisticated testing systems for quality control and research applications. German manufacturers implement high-precision measurement systems that support advanced testing protocols, operational reliability, and comprehensive quality documentation. The market is characterized by focus on equipment accuracy, measurement standardization, and compliance with stringent quality and validation requirements.

Food processing industry investments are prioritizing advanced testing technologies that demonstrate superior measurement precision and reliability while meeting German quality standards and food safety regulations. Manufacturing excellence programs and operational optimization initiatives are driving adoption of automated measurement systems that support efficient laboratory workflows and quality assurance protocols. Research and development programs for ingredient optimization are facilitating adoption of specialized testing capabilities throughout major industrial centers.

Why Is Agricultural Research Supporting Market Expansion in Brazil?

Revenue from Damaged Starch Analyzers in Brazil is growing to reach USD 15.0 million by 2035, driven by agricultural research expansion and wheat processing capacity development creating sustained opportunities for equipment suppliers serving both commercial flour mills and university research facilities. The country's extensive agricultural research infrastructure and expanding food processing capabilities are creating demand for testing equipment that supports diverse quality assessment requirements while maintaining operational performance standards. Manufacturers and research institutions are developing procurement strategies to support laboratory capability enhancement and quality program implementation.

Agricultural breeding programs and crop quality improvement initiatives are facilitating equipment adoption capable of supporting diverse research requirements and competitive performance specifications. Food processing development and quality testing expansion programs are enhancing demand for measurement systems that support operational efficiency and analytical reliability. Wheat industry modernization and laboratory infrastructure development are creating opportunities for automated testing capabilities across Brazilian research and manufacturing facilities.

How Is Laboratory Automation Driving Market Advancement in United States?

Demand for Damaged Starch Analyzers in United States is projected to reach USD 19.8 million by 2035, expanding at a CAGR of 5.4%, driven by food processing innovation and pharmaceutical manufacturing excellence supporting advanced quality control programs and comprehensive testing capabilities. The country's established laboratory infrastructure and growing automation emphasis are creating demand for integrated measurement systems that support operational efficiency and regulatory compliance standards. Equipment manufacturers and suppliers are maintaining comprehensive technical support capabilities to serve diverse testing requirements.

Food manufacturing advancement and quality program enhancement initiatives are supporting demand for automated testing equipment that meets contemporary performance and reliability standards. Pharmaceutical sector development and excipient characterization programs are creating opportunities for validated measurement systems that provide comprehensive analytical capabilities. Laboratory modernization and digital integration programs are facilitating adoption of advanced testing platforms throughout major manufacturing regions.
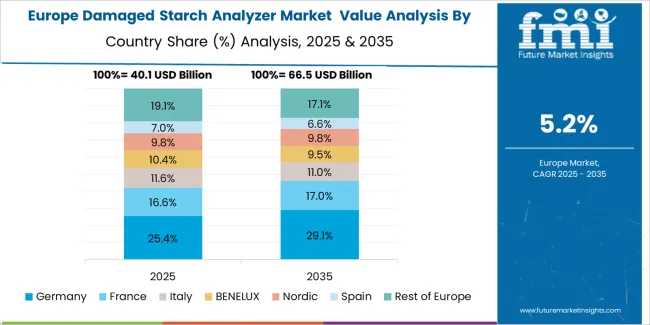
How Are Food Safety Regulations Supporting Market Expansion Across Europe?

Damaged Starch Analyzer Market Europe Country Market Share Analysis, 2025 & 2035

The damaged starch analyzer market in Europe is projected to grow from USD 38.7 million in 2025 to USD 67.4 million by 2035, registering a CAGR of 5.7% over the forecast period. Germany is expected to maintain its leadership position with a 28.4% market share in 2025, declining slightly to 27.8% by 2035, supported by its advanced food processing infrastructure and major flour milling operations concentrated in Bavaria and North Rhine-Westphalia.

France follows with a 21.6% share in 2025, projected to reach 22.1% by 2035, driven by comprehensive bakery ingredient manufacturing and pharmaceutical excipient production facilities. The United Kingdom holds a 18.9% share in 2025, expected to decrease to 18.3% by 2035 due to consolidation in flour milling operations. Italy commands a 15.7% share, while Spain accounts for 9.8% in 2025. The Rest of Europe region is anticipated to gain momentum, expanding its collective share from 5.6% to 6.3% by 2035, attributed to increasing quality testing adoption in Nordic countries and emerging Eastern European food processing operations implementing laboratory modernization programs.
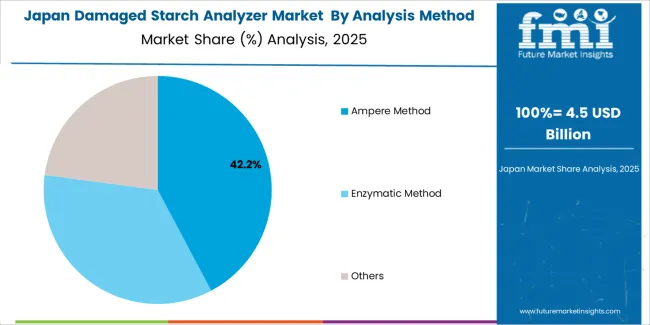
Quality Standards Define Japanese Market Operations

Damaged Starch Analyzer Market Japan Market Share Analysis By Analysis Method

Japanese damaged starch analyzer operations reflect the country's precise quality control standards in food manufacturing and pharmaceutical production. Major flour mills including Nisshin Seifun Group and Nitto Fuji require comprehensive starch quality testing protocols that exceed international standards, driving demand for automated measurement systems with validated performance specifications. Companies maintain rigorous equipment qualification procedures and calibration protocols supporting consistent quality assurance across production operations.

The pharmaceutical sector demonstrates particular strength in excipient characterization programs, with companies requiring detailed starch damage measurements for tablet formulation development and manufacturing quality control. Regulatory oversight through the Ministry of Health, Labour and Welfare emphasizes comprehensive testing documentation and equipment validation procedures that favor established manufacturers with proven measurement technologies.
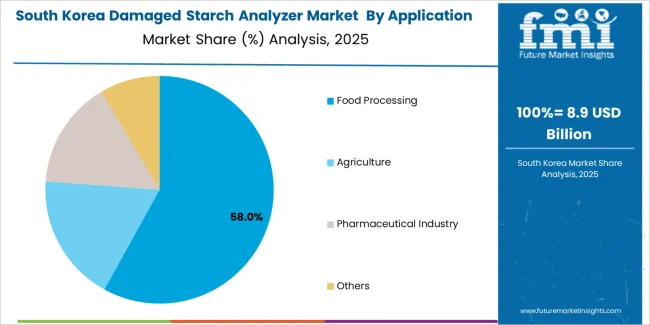
Manufacturing Excellence Drives South Korean Adoption

Damaged Starch Analyzer Market South Korea Market Share Analysis By Application

South Korean damaged starch analyzer operations reflect the country's advanced food manufacturing capabilities and pharmaceutical sector growth. Major flour processors including CJ CheilJedang and Daesang implement sophisticated quality testing programs supporting both domestic production and export operations targeting Asian markets. Companies are investing in automated testing systems to enhance operational efficiency while meeting international quality specifications.

The pharmaceutical ingredient manufacturing sector drives demand for validated measurement systems capable of supporting GMP compliance requirements and regulatory submissions. Korean food and pharmaceutical manufacturers prioritize equipment suppliers with comprehensive technical support capabilities and established service networks supporting rapid maintenance response and calibration services.
How Competitive Is the Global Damaged Starch Analyzer Market and Its Strategic Landscape?

Damaged Starch Analyzer Market Analysis By Company

Market dynamics favor established equipment manufacturers with proven measurement technologies and comprehensive service networks supporting food processing and pharmaceutical applications. Value concentration occurs around automated testing platforms capable of delivering precise measurement accuracy with minimal operator intervention, creating barriers for new entrants lacking validation documentation and installed base credibility. Several competitive archetypes dominate market positioning: global analytical equipment manufacturers leveraging broad laboratory equipment portfolios and established customer relationships across food and pharmaceutical sectors; specialized starch testing companies offering focused measurement solutions with deep application expertise in flour milling and grain quality assessment; regional equipment suppliers providing localized service capabilities and cost-competitive solutions for emerging market operations; and emerging automation providers developing integrated testing platforms combining multiple measurement methodologies with digital data management capabilities.

Switching costs remain elevated due to equipment validation requirements, operator training investments, and established testing protocols that favor incumbent suppliers in regulated pharmaceutical applications and quality-critical food processing operations. Technology transitions toward automated measurement systems and digital integration create opportunities for suppliers offering enhanced operational efficiency and comprehensive data management, though standardization challenges and method validation requirements slow adoption in conservative manufacturing environments. Consolidation pressure increases as larger analytical equipment companies acquire specialized testing manufacturers to expand application coverage and strengthen regional market positions.

Strategic positioning requires comprehensive validation support capabilities and proven measurement accuracy across diverse application requirements, particularly for pharmaceutical GMP operations and food safety compliance programs. Service network density and technical support responsiveness become critical differentiation factors as manufacturers prioritize equipment reliability and minimal downtime in high-volume testing operations. Market share stability depends on maintaining measurement standardization leadership and regulatory acceptance while adapting testing platforms to emerging automation requirements and digital laboratory management systems without disrupting established customer workflows or requiring extensive revalidation investments.

Key Players in the Damaged Starch Analyzer Market

  • KPM Analytics
  • Nanosens
  • Erkaya
  • Metron Group
  • SAYTEK
  • Yucebas Machinery Analytical Equipment Industry

Scope of the Report

Items Values
Quantitative Units USD 162 million
Analysis Method Ampere Method, Enzymatic Method, Others
Application Food Processing, Agriculture, Pharmaceutical Industry, Others
Regions Covered North America, Latin America, Europe, Asia Pacific, Middle East & Africa
Country Covered United States, Germany, China, India, Brazil, and other 40+ countries
Key Companies Profiled KPM Analytics, Nanosens, Erkaya, Metron Group, SAYTEK, Yucebas Machinery Analytical Equipment Industry
Additional Attributes Dollar sales by analysis method and application, regional demand across NA, EU, APAC, competitive landscape, technology adoption patterns, laboratory automation integration, and testing standardization initiatives driving measurement accuracy, operational efficiency, and quality compliance

Damaged Starch Analyzer Market Segmentation

Analysis Method

  • Ampere Method
  • Enzymatic Method
  • Others

Application

  • Food Processing
  • Agriculture
  • Pharmaceutical Industry
  • Others

By Region

  • North America
  • Europe
  • Asia Pacific
  • Latin America
  • Middle East & Africa

Frequently Asked Questions

How big is the damaged starch analyzer market in 2025?

The global damaged starch analyzer market is estimated to be valued at USD 162.0 billion in 2025.

What will be the size of damaged starch analyzer market in 2035?

The market size for the damaged starch analyzer market is projected to reach USD 282.0 billion by 2035.

How much will be the damaged starch analyzer market growth between 2025 and 2035?

The damaged starch analyzer market is expected to grow at a 5.7% CAGR between 2025 and 2035.

What are the key product types in the damaged starch analyzer market?

The key product types in damaged starch analyzer market are ampere method, enzymatic method and others.

Which application segment to contribute significant share in the damaged starch analyzer market in 2025?

In terms of application, food processing segment to command 58.6% share in the damaged starch analyzer market in 2025.

Table of Content

  1. Executive Summary
    • Global Market Outlook
    • Demand to side Trends
    • Supply to side Trends
    • Technology Roadmap Analysis
    • Analysis and Recommendations
  2. Market Overview
    • Market Coverage / Taxonomy
    • Market Definition / Scope / Limitations
  3. Market Background
    • Market Dynamics
      • Drivers
      • Restraints
      • Opportunity
      • Trends
    • Scenario Forecast
      • Demand in Optimistic Scenario
      • Demand in Likely Scenario
      • Demand in Conservative Scenario
    • Opportunity Map Analysis
    • Product Life Cycle Analysis
    • Supply Chain Analysis
    • Investment Feasibility Matrix
    • Value Chain Analysis
    • PESTLE and Porter’s Analysis
    • Regulatory Landscape
    • Regional Parent Market Outlook
    • Production and Consumption Statistics
    • Import and Export Statistics
  4. Global Market Analysis 2020 to 2024 and Forecast, 2025 to 2035
    • Historical Market Size Value (USD Million) Analysis, 2020 to 2024
    • Current and Future Market Size Value (USD Million) Projections, 2025 to 2035
      • Y to o to Y Growth Trend Analysis
      • Absolute $ Opportunity Analysis
  5. Global Market Pricing Analysis 2020 to 2024 and Forecast 2025 to 2035
  6. Global Market Analysis 2020 to 2024 and Forecast 2025 to 2035, By Analysis Method
    • Introduction / Key Findings
    • Historical Market Size Value (USD Million) Analysis By Analysis Method , 2020 to 2024
    • Current and Future Market Size Value (USD Million) Analysis and Forecast By Analysis Method , 2025 to 2035
      • Ampere Method
      • Enzymatic Method
      • Others
    • Y to o to Y Growth Trend Analysis By Analysis Method , 2020 to 2024
    • Absolute $ Opportunity Analysis By Analysis Method , 2025 to 2035
  7. Global Market Analysis 2020 to 2024 and Forecast 2025 to 2035, By Application
    • Introduction / Key Findings
    • Historical Market Size Value (USD Million) Analysis By Application, 2020 to 2024
    • Current and Future Market Size Value (USD Million) Analysis and Forecast By Application, 2025 to 2035
      • Food Processing
      • Agriculture
      • Pharmaceutical Industry
      • Others
    • Y to o to Y Growth Trend Analysis By Application, 2020 to 2024
    • Absolute $ Opportunity Analysis By Application, 2025 to 2035
  8. Global Market Analysis 2020 to 2024 and Forecast 2025 to 2035, By Region
    • Introduction
    • Historical Market Size Value (USD Million) Analysis By Region, 2020 to 2024
    • Current Market Size Value (USD Million) Analysis and Forecast By Region, 2025 to 2035
      • North America
      • Latin America
      • Western Europe
      • Eastern Europe
      • East Asia
      • South Asia and Pacific
      • Middle East & Africa
    • Market Attractiveness Analysis By Region
  9. North America Market Analysis 2020 to 2024 and Forecast 2025 to 2035, By Country
    • Historical Market Size Value (USD Million) Trend Analysis By Market Taxonomy, 2020 to 2024
    • Market Size Value (USD Million) Forecast By Market Taxonomy, 2025 to 2035
      • By Country
        • USA
        • Canada
        • Mexico
      • By Analysis Method
      • By Application
    • Market Attractiveness Analysis
      • By Country
      • By Analysis Method
      • By Application
    • Key Takeaways
  10. Latin America Market Analysis 2020 to 2024 and Forecast 2025 to 2035, By Country
    • Historical Market Size Value (USD Million) Trend Analysis By Market Taxonomy, 2020 to 2024
    • Market Size Value (USD Million) Forecast By Market Taxonomy, 2025 to 2035
      • By Country
        • Brazil
        • Chile
        • Rest of Latin America
      • By Analysis Method
      • By Application
    • Market Attractiveness Analysis
      • By Country
      • By Analysis Method
      • By Application
    • Key Takeaways
  11. Western Europe Market Analysis 2020 to 2024 and Forecast 2025 to 2035, By Country
    • Historical Market Size Value (USD Million) Trend Analysis By Market Taxonomy, 2020 to 2024
    • Market Size Value (USD Million) Forecast By Market Taxonomy, 2025 to 2035
      • By Country
        • Germany
        • UK
        • Italy
        • Spain
        • France
        • Nordic
        • BENELUX
        • Rest of Western Europe
      • By Analysis Method
      • By Application
    • Market Attractiveness Analysis
      • By Country
      • By Analysis Method
      • By Application
    • Key Takeaways
  12. Eastern Europe Market Analysis 2020 to 2024 and Forecast 2025 to 2035, By Country
    • Historical Market Size Value (USD Million) Trend Analysis By Market Taxonomy, 2020 to 2024
    • Market Size Value (USD Million) Forecast By Market Taxonomy, 2025 to 2035
      • By Country
        • Russia
        • Poland
        • Hungary
        • Balkan & Baltic
        • Rest of Eastern Europe
      • By Analysis Method
      • By Application
    • Market Attractiveness Analysis
      • By Country
      • By Analysis Method
      • By Application
    • Key Takeaways
  13. East Asia Market Analysis 2020 to 2024 and Forecast 2025 to 2035, By Country
    • Historical Market Size Value (USD Million) Trend Analysis By Market Taxonomy, 2020 to 2024
    • Market Size Value (USD Million) Forecast By Market Taxonomy, 2025 to 2035
      • By Country
        • China
        • Japan
        • South Korea
      • By Analysis Method
      • By Application
    • Market Attractiveness Analysis
      • By Country
      • By Analysis Method
      • By Application
    • Key Takeaways
  14. South Asia and Pacific Market Analysis 2020 to 2024 and Forecast 2025 to 2035, By Country
    • Historical Market Size Value (USD Million) Trend Analysis By Market Taxonomy, 2020 to 2024
    • Market Size Value (USD Million) Forecast By Market Taxonomy, 2025 to 2035
      • By Country
        • India
        • ASEAN
        • Australia & New Zealand
        • Rest of South Asia and Pacific
      • By Analysis Method
      • By Application
    • Market Attractiveness Analysis
      • By Country
      • By Analysis Method
      • By Application
    • Key Takeaways
  15. Middle East & Africa Market Analysis 2020 to 2024 and Forecast 2025 to 2035, By Country
    • Historical Market Size Value (USD Million) Trend Analysis By Market Taxonomy, 2020 to 2024
    • Market Size Value (USD Million) Forecast By Market Taxonomy, 2025 to 2035
      • By Country
        • Kingdom of Saudi Arabia
        • Other GCC Countries
        • Turkiye
        • South Africa
        • Other African Union
        • Rest of Middle East & Africa
      • By Analysis Method
      • By Application
    • Market Attractiveness Analysis
      • By Country
      • By Analysis Method
      • By Application
    • Key Takeaways
  16. Key Countries Market Analysis
    • USA
      • Pricing Analysis
      • Market Share Analysis, 2024
        • By Analysis Method
        • By Application
    • Canada
      • Pricing Analysis
      • Market Share Analysis, 2024
        • By Analysis Method
        • By Application
    • Mexico
      • Pricing Analysis
      • Market Share Analysis, 2024
        • By Analysis Method
        • By Application
    • Brazil
      • Pricing Analysis
      • Market Share Analysis, 2024
        • By Analysis Method
        • By Application
    • Chile
      • Pricing Analysis
      • Market Share Analysis, 2024
        • By Analysis Method
        • By Application
    • Germany
      • Pricing Analysis
      • Market Share Analysis, 2024
        • By Analysis Method
        • By Application
    • UK
      • Pricing Analysis
      • Market Share Analysis, 2024
        • By Analysis Method
        • By Application
    • Italy
      • Pricing Analysis
      • Market Share Analysis, 2024
        • By Analysis Method
        • By Application
    • Spain
      • Pricing Analysis
      • Market Share Analysis, 2024
        • By Analysis Method
        • By Application
    • France
      • Pricing Analysis
      • Market Share Analysis, 2024
        • By Analysis Method
        • By Application
    • India
      • Pricing Analysis
      • Market Share Analysis, 2024
        • By Analysis Method
        • By Application
    • ASEAN
      • Pricing Analysis
      • Market Share Analysis, 2024
        • By Analysis Method
        • By Application
    • Australia & New Zealand
      • Pricing Analysis
      • Market Share Analysis, 2024
        • By Analysis Method
        • By Application
    • China
      • Pricing Analysis
      • Market Share Analysis, 2024
        • By Analysis Method
        • By Application
    • Japan
      • Pricing Analysis
      • Market Share Analysis, 2024
        • By Analysis Method
        • By Application
    • South Korea
      • Pricing Analysis
      • Market Share Analysis, 2024
        • By Analysis Method
        • By Application
    • Russia
      • Pricing Analysis
      • Market Share Analysis, 2024
        • By Analysis Method
        • By Application
    • Poland
      • Pricing Analysis
      • Market Share Analysis, 2024
        • By Analysis Method
        • By Application
    • Hungary
      • Pricing Analysis
      • Market Share Analysis, 2024
        • By Analysis Method
        • By Application
    • Kingdom of Saudi Arabia
      • Pricing Analysis
      • Market Share Analysis, 2024
        • By Analysis Method
        • By Application
    • Turkiye
      • Pricing Analysis
      • Market Share Analysis, 2024
        • By Analysis Method
        • By Application
    • South Africa
      • Pricing Analysis
      • Market Share Analysis, 2024
        • By Analysis Method
        • By Application
  17. Market Structure Analysis
    • Competition Dashboard
    • Competition Benchmarking
    • Market Share Analysis of Top Players
      • By Regional
      • By Analysis Method
      • By Application
  18. Competition Analysis
    • Competition Deep Dive
      • KPM Analytics
        • Overview
        • Product Portfolio
        • Profitability by Market Segments (Product/Age /Sales Channel/Region)
        • Sales Footprint
        • Strategy Overview
          • Marketing Strategy
          • Product Strategy
          • Channel Strategy
      • Nanosens
      • Erkaya
      • Metron Group
      • SAYTEK
      • Yucebas Machinery Analytical Equipment Industry
  19. Assumptions & Acronyms Used
  20. Research Methodology

List of Tables

  • Table 1: Global Market Value (USD Million) Forecast by Region, 2020 to 2035
  • Table 2: Global Market Value (USD Million) Forecast by Analysis Method , 2020 to 2035
  • Table 3: Global Market Value (USD Million) Forecast by Application, 2020 to 2035
  • Table 4: North America Market Value (USD Million) Forecast by Country, 2020 to 2035
  • Table 5: North America Market Value (USD Million) Forecast by Analysis Method , 2020 to 2035
  • Table 6: North America Market Value (USD Million) Forecast by Application, 2020 to 2035
  • Table 7: Latin America Market Value (USD Million) Forecast by Country, 2020 to 2035
  • Table 8: Latin America Market Value (USD Million) Forecast by Analysis Method , 2020 to 2035
  • Table 9: Latin America Market Value (USD Million) Forecast by Application, 2020 to 2035
  • Table 10: Western Europe Market Value (USD Million) Forecast by Country, 2020 to 2035
  • Table 11: Western Europe Market Value (USD Million) Forecast by Analysis Method , 2020 to 2035
  • Table 12: Western Europe Market Value (USD Million) Forecast by Application, 2020 to 2035
  • Table 13: Eastern Europe Market Value (USD Million) Forecast by Country, 2020 to 2035
  • Table 14: Eastern Europe Market Value (USD Million) Forecast by Analysis Method , 2020 to 2035
  • Table 15: Eastern Europe Market Value (USD Million) Forecast by Application, 2020 to 2035
  • Table 16: East Asia Market Value (USD Million) Forecast by Country, 2020 to 2035
  • Table 17: East Asia Market Value (USD Million) Forecast by Analysis Method , 2020 to 2035
  • Table 18: East Asia Market Value (USD Million) Forecast by Application, 2020 to 2035
  • Table 19: South Asia and Pacific Market Value (USD Million) Forecast by Country, 2020 to 2035
  • Table 20: South Asia and Pacific Market Value (USD Million) Forecast by Analysis Method , 2020 to 2035
  • Table 21: South Asia and Pacific Market Value (USD Million) Forecast by Application, 2020 to 2035
  • Table 22: Middle East & Africa Market Value (USD Million) Forecast by Country, 2020 to 2035
  • Table 23: Middle East & Africa Market Value (USD Million) Forecast by Analysis Method , 2020 to 2035
  • Table 24: Middle East & Africa Market Value (USD Million) Forecast by Application, 2020 to 2035

List of Figures

  • Figure 1: Global Market Pricing Analysis
  • Figure 2: Global Market Value (USD Million) Forecast 2020-2035
  • Figure 3: Global Market Value Share and BPS Analysis by Analysis Method , 2025 and 2035
  • Figure 4: Global Market Y-o-Y Growth Comparison by Analysis Method , 2025-2035
  • Figure 5: Global Market Attractiveness Analysis by Analysis Method
  • Figure 6: Global Market Value Share and BPS Analysis by Application, 2025 and 2035
  • Figure 7: Global Market Y-o-Y Growth Comparison by Application, 2025-2035
  • Figure 8: Global Market Attractiveness Analysis by Application
  • Figure 9: Global Market Value (USD Million) Share and BPS Analysis by Region, 2025 and 2035
  • Figure 10: Global Market Y-o-Y Growth Comparison by Region, 2025-2035
  • Figure 11: Global Market Attractiveness Analysis by Region
  • Figure 12: North America Market Incremental Dollar Opportunity, 2025-2035
  • Figure 13: Latin America Market Incremental Dollar Opportunity, 2025-2035
  • Figure 14: Western Europe Market Incremental Dollar Opportunity, 2025-2035
  • Figure 15: Eastern Europe Market Incremental Dollar Opportunity, 2025-2035
  • Figure 16: East Asia Market Incremental Dollar Opportunity, 2025-2035
  • Figure 17: South Asia and Pacific Market Incremental Dollar Opportunity, 2025-2035
  • Figure 18: Middle East & Africa Market Incremental Dollar Opportunity, 2025-2035
  • Figure 19: North America Market Value Share and BPS Analysis by Country, 2025 and 2035
  • Figure 20: North America Market Value Share and BPS Analysis by Analysis Method , 2025 and 2035
  • Figure 21: North America Market Y-o-Y Growth Comparison by Analysis Method , 2025-2035
  • Figure 22: North America Market Attractiveness Analysis by Analysis Method
  • Figure 23: North America Market Value Share and BPS Analysis by Application, 2025 and 2035
  • Figure 24: North America Market Y-o-Y Growth Comparison by Application, 2025-2035
  • Figure 25: North America Market Attractiveness Analysis by Application
  • Figure 26: Latin America Market Value Share and BPS Analysis by Country, 2025 and 2035
  • Figure 27: Latin America Market Value Share and BPS Analysis by Analysis Method , 2025 and 2035
  • Figure 28: Latin America Market Y-o-Y Growth Comparison by Analysis Method , 2025-2035
  • Figure 29: Latin America Market Attractiveness Analysis by Analysis Method
  • Figure 30: Latin America Market Value Share and BPS Analysis by Application, 2025 and 2035
  • Figure 31: Latin America Market Y-o-Y Growth Comparison by Application, 2025-2035
  • Figure 32: Latin America Market Attractiveness Analysis by Application
  • Figure 33: Western Europe Market Value Share and BPS Analysis by Country, 2025 and 2035
  • Figure 34: Western Europe Market Value Share and BPS Analysis by Analysis Method , 2025 and 2035
  • Figure 35: Western Europe Market Y-o-Y Growth Comparison by Analysis Method , 2025-2035
  • Figure 36: Western Europe Market Attractiveness Analysis by Analysis Method
  • Figure 37: Western Europe Market Value Share and BPS Analysis by Application, 2025 and 2035
  • Figure 38: Western Europe Market Y-o-Y Growth Comparison by Application, 2025-2035
  • Figure 39: Western Europe Market Attractiveness Analysis by Application
  • Figure 40: Eastern Europe Market Value Share and BPS Analysis by Country, 2025 and 2035
  • Figure 41: Eastern Europe Market Value Share and BPS Analysis by Analysis Method , 2025 and 2035
  • Figure 42: Eastern Europe Market Y-o-Y Growth Comparison by Analysis Method , 2025-2035
  • Figure 43: Eastern Europe Market Attractiveness Analysis by Analysis Method
  • Figure 44: Eastern Europe Market Value Share and BPS Analysis by Application, 2025 and 2035
  • Figure 45: Eastern Europe Market Y-o-Y Growth Comparison by Application, 2025-2035
  • Figure 46: Eastern Europe Market Attractiveness Analysis by Application
  • Figure 47: East Asia Market Value Share and BPS Analysis by Country, 2025 and 2035
  • Figure 48: East Asia Market Value Share and BPS Analysis by Analysis Method , 2025 and 2035
  • Figure 49: East Asia Market Y-o-Y Growth Comparison by Analysis Method , 2025-2035
  • Figure 50: East Asia Market Attractiveness Analysis by Analysis Method
  • Figure 51: East Asia Market Value Share and BPS Analysis by Application, 2025 and 2035
  • Figure 52: East Asia Market Y-o-Y Growth Comparison by Application, 2025-2035
  • Figure 53: East Asia Market Attractiveness Analysis by Application
  • Figure 54: South Asia and Pacific Market Value Share and BPS Analysis by Country, 2025 and 2035
  • Figure 55: South Asia and Pacific Market Value Share and BPS Analysis by Analysis Method , 2025 and 2035
  • Figure 56: South Asia and Pacific Market Y-o-Y Growth Comparison by Analysis Method , 2025-2035
  • Figure 57: South Asia and Pacific Market Attractiveness Analysis by Analysis Method
  • Figure 58: South Asia and Pacific Market Value Share and BPS Analysis by Application, 2025 and 2035
  • Figure 59: South Asia and Pacific Market Y-o-Y Growth Comparison by Application, 2025-2035
  • Figure 60: South Asia and Pacific Market Attractiveness Analysis by Application
  • Figure 61: Middle East & Africa Market Value Share and BPS Analysis by Country, 2025 and 2035
  • Figure 62: Middle East & Africa Market Value Share and BPS Analysis by Analysis Method , 2025 and 2035
  • Figure 63: Middle East & Africa Market Y-o-Y Growth Comparison by Analysis Method , 2025-2035
  • Figure 64: Middle East & Africa Market Attractiveness Analysis by Analysis Method
  • Figure 65: Middle East & Africa Market Value Share and BPS Analysis by Application, 2025 and 2035
  • Figure 66: Middle East & Africa Market Y-o-Y Growth Comparison by Application, 2025-2035
  • Figure 67: Middle East & Africa Market Attractiveness Analysis by Application
  • Figure 68: Global Market - Tier Structure Analysis
  • Figure 69: Global Market - Company Share Analysis
Dashboard
Dashboard
Dashboard
Dashboard
Dashboard
Dashboard

Full Research Suite comprises of:

Market outlook & trends analysis

Market outlook & trends analysis

Interviews & case studies

Interviews & case studies

Strategic recommendations

Strategic recommendations

Vendor profiles & capabilities analysis

Vendor profiles & capabilities analysis

5-year forecasts

5-year forecasts

8 regions and 60+ country-level data splits

8 regions and 60+ country-level data splits

Market segment data splits

Market segment data splits

12 months of continuous data updates

12 months of continuous data updates

DELIVERED AS:

PDF EXCEL ONLINE

Full Research Suite


$3500

$5000

$6500

Buy Report Now
Similar Industry Reports

Similar Industry Reports

Starch-based Texturizing Agents Market

Starch-based Texturizing Agents Market Size and Share Forecast Outlook 2025 to 2035

Starch-based Packaging Market

Starch-based Packaging Market Size and Share Forecast Outlook 2025 to 2035

Starch-derived Fiber Market

Starch-derived Fiber Market Size and Share Forecast Outlook 2025 to 2035

Starch-Based Bioplastics Packaging Market

Starch-Based Bioplastics Packaging Market Insights - Growth & Forecast 2025 to 2035

Starch Derivative Market

Starch Derivatives Market by Product Type, Source, End Use and Region through 2035

Starches/Glucose Market

Starches/Glucose Market

Starch Glucose Syrup Market

Starch Glucose Syrup Market

Starch Recovery Systems Market

Starch Recovery Systems Market Outlook – Growth, Demand & Forecast 2023-2033

Distarch Phosphate Market

Distarch Phosphate Market Size and Share Forecast Outlook 2025 to 2035

UK Starch Derivatives Market

UK Starch Derivatives Market Report – Size, Share & Innovations 2025-2035

Cornstarch Packaging Market

Cornstarch Packaging Market Size and Share Forecast Outlook 2025 to 2035

Monostarch Phosphate Market

Monostarch Phosphate Market Size and Share Forecast Outlook 2025 to 2035

Pea Starch Market
Pea Starch Market

Pea Starch Market Analysis - Size, Share, and Forecast Outlook 2025 to 2035

USA Starch Derivatives Market

USA Starch Derivatives Market Analysis – Demand, Trends & Outlook 2025-2035

Pea Starch Concentrate Market

Pea Starch Concentrate Market Trends - Growth & Industry Forecast 2025 to 2035

Food Starch Market
Food Starch Market

Food Starch Market Analysis - Size, Share, and Forecast Outlook 2025 to 2035

Wheat Starch Market
Wheat Starch Market

Wheat Starch Market Size and Share Forecast Outlook 2025 to 2035

ASEAN Starch Derivatives Market

ASEAN Starch Derivatives Market Trends – Growth, Demand & Forecast 2025-2035

Native Starch Market

Native Starch Market Analysis - Size, Growth, and Forecast 2025 to 2035

Europe Starch Derivatives Market

Europe Starch Derivatives Market Insights – Growth, Demand & Forecast 2025-2035

Future Market Insights

Damaged Starch Analyzer Market

Chat With MaRIA

Chat With

MaRIA

Hi There, I am MaRIA, Your Market Research Intelligence Assistant. How may I help you?