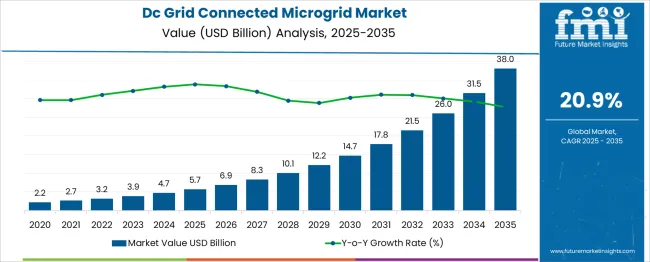
The DC Grid Connected Microgrid Market is estimated to be valued at USD 5.7 billion in 2025 and is projected to reach USD 38.0 billion by 2035, registering a compound annual growth rate (CAGR) of 20.9% over the forecast period. Between 2025 and 2030, the market will expand significantly, reaching USD 14.7 billion. Annual growth includes USD 6.9 billion in 2026, USD 8.3 billion in 2027, USD 10.1 billion in 2028, and USD 12.2 billion in 2029. This rapid scale-up supports market share gains for companies delivering modular, interoperable, and cost-efficient microgrid systems.
Vendors that provide integrated hardware and software solutions with reliable control systems will benefit from growing demand in industrial, commercial, and remote applications. Firms slow to adapt to region-specific grid regulations or those offering rigid, high-cost systems may lose ground. Delays in deployment, complex integration, or limited scalability could also erode market position. From 2025 to 2030, competitive advantage will depend on project turnaround speed, technical support, and pricing models. Players aligned with distributed energy trends and capable of forming public-private partnerships for infrastructure deployments are expected to outpace others. The market will reward those who combine technical flexibility with financing options and local customization.
| Metric | Value |
|---|---|
| DC Grid Connected Microgrid Market Estimated Value in (2025 E) | USD 5.7 billion |
| DC Grid Connected Microgrid Market Forecast Value in (2035 F) | USD 38.0 billion |
| Forecast CAGR (2025 to 2035) | 20.9% |
The DC grid-connected microgrid market demonstrates a clear two-phase growth trajectory when analyzed through the lens of early versus late growth curve comparison. During the early phase, from 2020 to 2025, the market grows from 2.2 to 5.7 billion USD, marking an increase of 3.5 billion USD or approximately 159%. This period reflects foundational developments, such as pilot projects, regulatory exploration, and initial demand from remote or off-grid applications. Adoption at this stage is relatively cautious, driven by early innovators and specific regional needs.
In contrast, the late growth phase from 2025 to 2035 reveals a rapid acceleration in market expansion, with the value rising from 5.7 to 38.0 billion USD. This represents a much larger increase of 32.3 billion USD, equating to nearly 567% growth. This surge is driven by widespread deployment across industrial zones, data centers, campuses, and utility-scale applications. Factors such as grid decentralization, rising electricity demand, and growing interest in direct current architecture for efficiency contribute to this sharp climb. The comparative analysis highlights a shift from slow, foundational growth to exponential value generation in the later phase, indicating that the market enters a maturity curve dominated by mass adoption, policy reinforcement, and technological readiness after 2025.
The DC Grid Connected Microgrid market is advancing steadily, driven by the rising demand for efficient and resilient energy systems that align with global decarbonization goals. The growing integration of distributed energy resources has prompted the adoption of direct current systems that enable higher energy efficiency and simplified power flow management. Supportive policy frameworks, increasing electricity demand across remote and industrial zones, and the rapid penetration of renewable technologies have created favorable conditions for market growth.
The need for uninterrupted power supply, especially in critical infrastructure and commercial hubs, has further accelerated the deployment of DC-based microgrids. The evolution of storage technologies and power electronics has enabled seamless operation of these systems with minimal conversion losses.
Grid modernization efforts, rising energy autonomy initiatives, and strategic investments by utilities and energy technology firms are shaping future opportunities. As sustainable electrification gains momentum, DC Grid Connected Microgrids are expected to play a central role in meeting efficiency and reliability benchmarks in the energy transition landscape..
The DC grid connected microgrid market is segmented by power source, storage device, and application and geographic regions. By power source, the DC grid-connected microgrid market is divided into Solar PV, Diesel generators, Natural gas, CHP, and Others. In terms of storage devices, the DC grid-connected microgrid market is classified into Lithium-ion, Lead acid, Flow battery, Flywheels, and Others. Based on the application of the DC grid-connected microgrid market, it is segmented into Industrial/Commercial, Healthcare, Educational institutes, Military, Utility, Remote, and Others. Regionally, the DC grid-connected microgrid industry is classified into North America, Latin America, Western Europe, Eastern Europe, Balkan & Baltic Countries, Russia & Belarus, Central Asia, East Asia, South Asia & Pacific, and the Middle East & Africa.
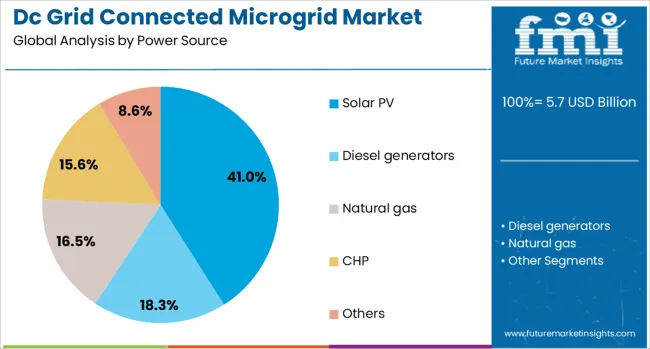
The solar PV subsegment within the power source segment is projected to account for 41% of the DC Grid Connected Microgrid market revenue share in 2025. This growth has been enabled by its compatibility with direct current systems, high modular scalability, and the increasing affordability of photovoltaic technology. Solar PV installations have been favored due to their ability to operate efficiently without requiring complex energy conversion, making them well-suited for DC-based architectures.
In regions with high solar irradiance and remote infrastructure, the integration of solar PV into microgrid designs has provided a sustainable and cost-effective energy solution. The segment has also benefited from government incentives and green energy mandates that encourage the adoption of clean generation sources.
Moreover, technological advancements in solar panel efficiency and durability have increased their deployment in both on-grid and off-grid applications. As demand rises for decentralized and resilient energy systems, the role of solar PV in powering DC microgrids is expected to remain substantial..
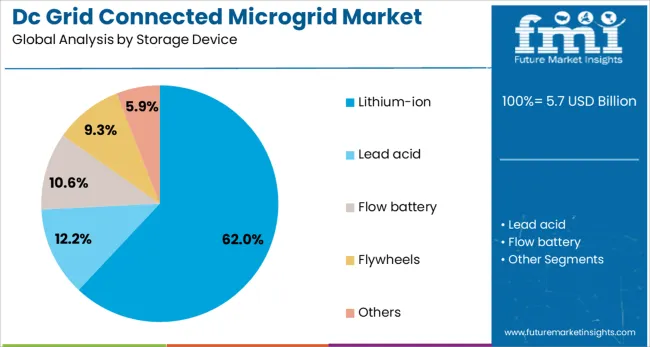
The lithium-ion subsegment within the storage device segment is expected to hold 62% of the DC Grid Connected Microgrid market revenue share in 2025, making it the leading storage technology. This dominance has been driven by the high energy density, fast charging capabilities, and declining cost trends associated with lithium-ion batteries. The segment has gained traction in DC microgrid systems due to its efficiency in storing renewable energy and its ability to support peak shaving and load balancing functions with precision.
Compact form factor and longer lifecycle performance have further increased the applicability of lithium-ion batteries across diverse end-use scenarios. Grid operators and system integrators have increasingly adopted this storage technology to enhance power quality and ensure an uninterrupted supply during generation variability.
Integration with smart control systems has also allowed for real-time energy management and improved system optimization. The segment’s sustained momentum is being supported by rapid innovation in battery chemistry and strong investments in energy storage manufacturing capacity worldwide..
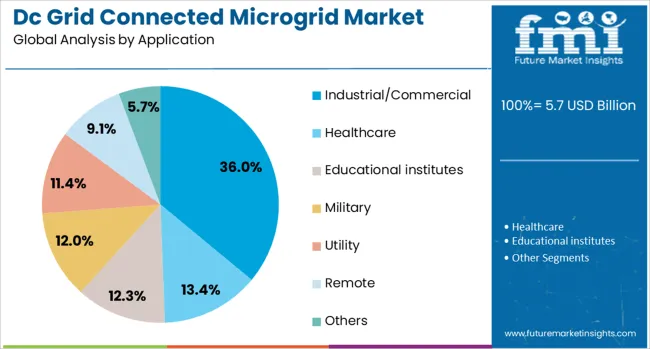
The industrial commercial subsegment within the application segment is projected to contribute 36% of the DC Grid Connected Microgrid market revenue share in 2025, positioning it as the leading area of application. Growth in this segment has been primarily influenced by the need for enhanced energy reliability, reduced operational costs, and improved sustainability performance across commercial buildings, manufacturing units, and large campuses.
Businesses operating in energy-intensive sectors have adopted DC microgrid systems to achieve high energy efficiency, minimize conversion losses, and support integration of on-site renewables and energy storage. Additionally, the ability to operate in both grid-connected and islanded modes has made DC microgrids attractive for industries that prioritize power continuity and resilience.
The growing pressure to meet environmental regulations and carbon reduction targets has also encouraged enterprises to transition toward distributed clean energy systems. With the ability to reduce energy bills and improve power quality, the industrial and commercial segment is poised to retain its lead in adopting DC grid-connected microgrid solutions across global markets..
The cotton processing equipment market is expanding steadily as global demand grows for cotton textiles, yarns, and industrial materials. Machines such as ginning units, balers, carding machines, and spinning equipment enable efficient removal of impurities and fiber preparation. Key demand sectors include textile manufacturing, garment production, and cottonseed utilization. Growth is strongest in regions with large agricultural and textile output such as Asia‑Pacific, Africa, and South Asia. Manufacturers are enhancing automation, fiber quality control, and energy efficiency in modern machinery. Sustainability expectations and labor savings support technology adoption across processing lines.
Cotton processing equipment supply chain fragmentation increases operational challenges for both machinery providers and processors. Raw tool suppliers, fiber line integrators, and equipment manufacturers must coordinate delivery schedules, compatibility standards, and maintenance routines. Small scale mills or coop operations may lack centralized procurement systems and require customized solutions. Equipment delivery depends on infrastructure such as port access, customs clearance, and local service networks. Delays in spare part availability or configuration mismatches can interrupt production cycles. Coordination among multiple stakeholders including local engineering firms and international OEMs requires clear communication. Machinery commissioning and operator training across dispersed processing regions add complexity. Ensuring compatibility with existing ginning and spinning lines at site level demands both logistical planning and technical alignment. Suppliers that support turnkey setups, field training, and localized spare inventory reduce disruption risk. Addressing this fragmentation through structured partnership and service networks enables smoother equipment adoption.
Automation innovations are transforming the cotton processing equipment market by improving throughput, fiber purity, and operational safety. Modern ginning and bale pressing machines incorporate sensor-based monitoring for humidity, trash content, and fiber breakage rates. Automated bale weighing, packaging, and module tracking reduce manual handling. Carding lines now use optical detection of foreign matter and motoring controls to stabilize sliver consistency. Integration of PLC systems and human‑machine interfaces enable predictive maintenance and reduce downtime. These automation enhancements also reduce labor requirements and improve workplace safety. As processors scale up to meet textile demand, automated lines deliver reliable, repeatable output quality. Vendors offering modular systems with remote diagnostics and consistency benchmarking win favor among processors seeking to improve efficiency and reduce waste. Automation further supports compliance with quality certification standards in international textile supply chains.
Variability in raw cotton quality presents a key operational challenge for cotton processing equipment users. Differences in staple length, moisture, botanical impurities, and fiber maturity impact ginning efficiency and end-product performance. Equipment settings such as rotor speed, lint cleaning intensity, and carder adjustment must be calibrated to raw input conditions. Inconsistent inputs can lead to increased fiber breakage, neps formation, or damaged cotton fibers risking yarn strength and textile quality. This requires processor teams to conduct frequent quality testing and machine fine‑tuning. Lack of consistent local cotton quality complicates machine adoption in emerging regions. Suppliers may provide guidance on fiber pre-sorting, moisture control, and pre-cleaning modules. Without reliable material preparation protocols, even advanced machinery fails to deliver consistent output. Developing calibration frameworks and providing technical training on raw quality influence empowers processors to adapt equipment to real-world conditions and sustain consistent fiber quality.
Increasing emphasis on energy consumption and environmental impact is shifting cotton equipment selection toward efficient designs. Modern machines incorporate energy-saving motors, waste heat recovery systems, and optimized hydraulic circuits. Low-noise, low-vibration models reduce environmental burden near processing facilities. Dust collection and lint control systems minimize emissions and improve air quality. Sustainable certifications or credible energy usage reporting support processor acceptance in environmentally conscious textile supply chains. Renewable power integration for equipment such as solar-assisted blowers or drying units helps reduce operating cost and carbon footprint. Equipment providers that highlight lifecycle efficiency and reduced maintenance burdens gain preference. As sustainability criteria become integral to textile brand sourcing, cotton processing machinery that aligns with green manufacturing goals becomes increasingly valuable. Suppliers demonstrating both operational efficiency and environmental responsibility are better positioned for long-term market relevance in the modern textile ecosystem.
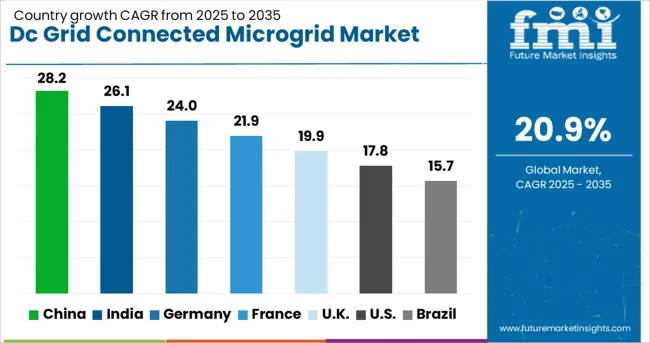
| Country | CAGR |
|---|---|
| China | 28.2% |
| India | 26.1% |
| Germany | 24.0% |
| France | 21.9% |
| UK | 19.9% |
| USA | 17.8% |
| Brazil | 15.7% |
The DC grid connected microgrid market is projected to expand at a robust CAGR of 20.9% through 2035, driven by the rising demand for resilient, efficient, and decentralized energy infrastructure. China leads the global growth at 28.2%, propelled by substantial investments in smart grid integration and renewable-powered microgrids across industrial zones. India follows at 26.1%, with strong government support and rural electrification efforts enhancing microgrid deployment. Germany, with a 24.0% growth rate, is advancing regulatory standards and implementing microgrids in commercial and urban developments. The UK, growing at 19.9%, is promoting energy independence through local energy grids and grid decarbonization strategies. The USA, expanding at 17.8%, is commercializing microgrids in campuses, military bases, and industrial parks with a focus on sustainability and energy security. This report includes insights on 40+ countries; the top five markets are shown here for reference.
China achieved a CAGR of 28.2% in the dc grid connected microgrid market, driven by increasing demand for stable power in remote industrial regions and high-density urban zones. Industrial parks and manufacturing clusters integrated dc microgrids to reduce transmission losses and manage load fluctuations. Government energy plans promoted distributed energy systems, making dc-based solutions a preferred choice for solar-heavy regions. Many projects integrated storage with photovoltaic arrays to supply power independently of the main grid. Local firms designed systems compatible with varying voltage demands across rural and urban areas. Real-time energy flow control helped users maintain grid stability without manual intervention. Equipment manufacturers produced compact controllers and scalable battery units suited for tight spaces. Pilot projects in provinces such as Jiangsu and Zhejiang served as models for other regions. These installations often bundled microgrid management software for improved oversight and long-term cost control.
India recorded a CAGR of 26.1% in the dc grid connected microgrid market, supported by demand for reliable energy in rural and off-grid locations. Public-private programs introduced dc microgrids in remote villages where conventional grid expansion was delayed or uneconomical. These systems enabled continuous access to lighting, mobile charging, and irrigation support. Project developers emphasized low maintenance and modular designs, making units easier to scale across varied geographies. Educational institutions, community centers, and agricultural cooperatives were early adopters. State-level funding schemes reduced upfront capital requirements, encouraging participation from small utilities and energy startups. Some providers bundled after-sales service and local training into their offerings. Installations often paired solar input with dc storage units, bypassing the need for ac conversion. Load management tools helped balance supply during monsoon and peak agricultural use periods. Demand also rose from mobile towers and cold storage units in semi-urban belts.
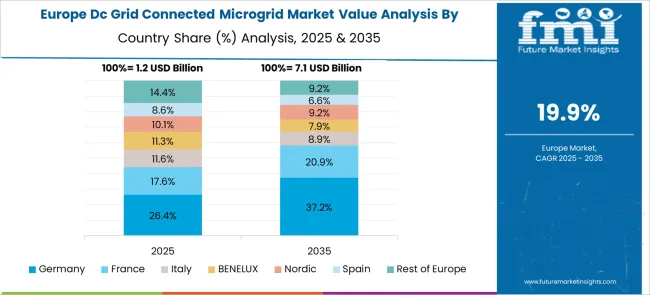
Germany reached a CAGR of 24.0% in the dc grid connected microgrid market, due to rising integration of local energy assets in mixed-use developments. Housing complexes and industrial buildings adopted dc microgrids to optimize energy use from rooftop solar, storage, and electric vehicle charging points. Projects often featured bi-directional controllers for flexible load control and energy trading within micro-communities. Building owners selected dc-based configurations to reduce system losses and increase power quality. Vendors provided all-in-one solutions with battery management, demand forecasting, and remote diagnostics. Regulatory updates allowed shared energy usage across connected properties, increasing adoption. Installations typically emphasized compact footprints and were incorporated into building designs at early construction stages. Equipment firms focused on plug-and-play models to minimize installation time. The market benefited from collaborations between engineering firms and construction contractors, ensuring systems were installed seamlessly across residential and light commercial sites.
The United Kingdom recorded a CAGR of 19.9% in the dc grid connected microgrid market, driven by rising energy costs and the need for decentralized solutions in urban developments. Housing developers and local councils adopted dc microgrids to manage on-site solar generation and battery use in new residential projects. High energy price volatility led building managers to prioritize systems with predictable operation costs. Installations were often paired with demand management software to shift loads during peak pricing hours. Systems featured flexible wiring and compact design for easy integration into retrofitted buildings. Pilot installations in London and Manchester informed broader deployment strategies. Utility partnerships ensured grid compliance while supporting local autonomy. Some installations included local user interfaces for households to track usage in real time. Market growth also stemmed from the retrofit sector, where older buildings sought cost-effective energy improvements without full rewiring.
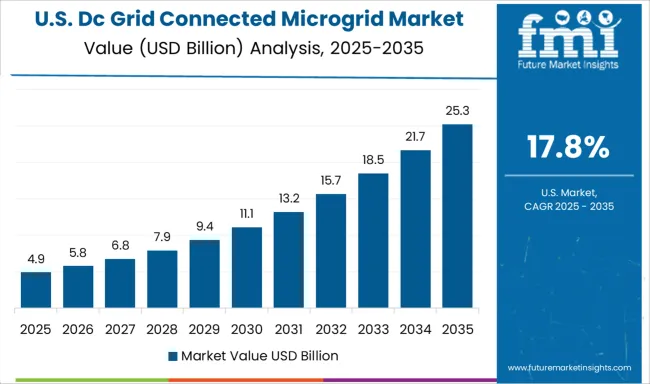
The United States observed a CAGR of 17.8% in the dc grid connected microgrid market, shaped by energy resilience initiatives and grid stability challenges. Universities, data centers, and municipal buildings adopted dc microgrids to manage intermittent energy supply and reduce outage impacts. Installations combined solar input with high-capacity battery storage to maintain critical operations during disruptions. Federal grants and local programs supported pilot projects across California, Texas, and New York. Some states introduced microgrid incentives tied to disaster preparedness. Developers emphasized quick deployment and minimal on-site engineering to reduce costs. Modular kits allowed phased expansion, especially in campus settings. Equipment manufacturers incorporated load segmentation tools, enabling facilities to prioritize essential systems. Commercial users focused on peak shaving to reduce demand charges. The rise in electric vehicle fleets further supported the rollout of local dc systems for charging and energy balancing.
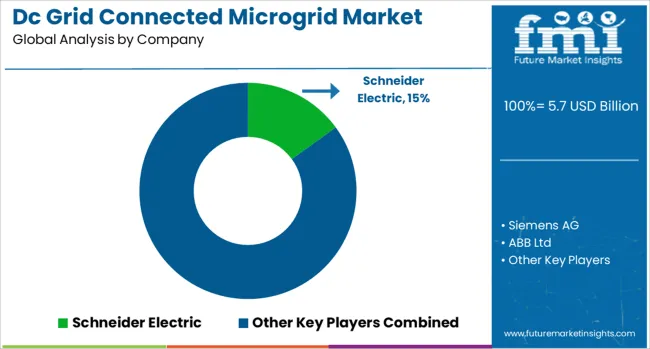
The DC grid connected microgrid market is witnessing rapid growth as industries, campuses, and remote communities seek reliable, efficient, and renewable-integrated power solutions. Unlike traditional AC systems, DC microgrids offer lower conversion losses, better compatibility with solar PV and battery storage, and simplified control. The push toward electrification, decentralized energy, and carbon neutrality is making DC-based architectures an attractive proposition for both grid-tied and hybrid applications. Schneider Electric is a global leader, offering comprehensive microgrid solutions with a strong focus on digital energy management, modular DC architecture, and integration with renewable energy sources. Their EcoStruxure™ platform provides end-to-end control, making DC microgrids more adaptable and scalable. Siemens AG supports DC microgrids through its SICAM and Sitras platforms, specializing in transportation, industrial campuses, and military applications, where real-time energy optimization is critical.
ABB Ltd and Hitachi Energy are known for robust power electronics, DC-DC converters, and protection systems that form the backbone of high-efficiency DC microgrids. They also offer software-defined grid control that enables seamless islanding and grid reconnection. Eaton Corporation rounds out the field with its power distribution and energy storage integration capabilities, providing tailored microgrid controllers and switchgear suited for commercial and utility applications. As microgrids shift from pilot to mainstream deployments, vendors that combine hardware strength with software intelligence and renewable alignment will continue to lead the global transformation toward resilient, low-carbon energy systems.
As mentioned in Microgrid Knowledge (April 15, 2025), the Current/OS Foundation, backed by Schneider Electric and 83 partners, is advancing DC microgrid adoption by promoting renewable integration, direct DC device connectivity, and improved grid-edge efficiency to reduce energy demand and enhance system sustainability.
| Item | Value |
|---|---|
| Quantitative Units | USD 5.7 Billion |
| Power Source | Solar PV, Diesel generators, Natural gas, CHP, and Others |
| Storage Device | Lithium-ion, Lead acid, Flow battery, Flywheels, and Others |
| Application | Industrial/Commercial, Healthcare, Educational institutes, Military, Utility, Remote, and Others |
| Regions Covered | North America, Europe, Asia-Pacific, Latin America, Middle East & Africa |
| Country Covered | United States, Canada, Germany, France, United Kingdom, China, Japan, India, Brazil, South Africa |
| Key Companies Profiled | Schneider Electric, Siemens AG, ABB Ltd, Hitachi Energy, and Eaton Corporation |
| Additional Attributes | Dollar sales by cotton processing equipment type including ginning machines, cleaning units, carding, spinning, weaving, and finishing systems, by application in textile manufacturing and cottonseed processing, and by geographic region including North America, Europe, and Asia‑Pacific; demand driven by rising cotton production and apparel/textile demand; innovation in IoT-enabled automated gins, AI monitoring, and energy-efficient systems; costs influenced by steel and component prices, machine sophistication, and automation overhead; and emerging use cases in mobile ginning units and real-time predictive maintenance across small and large-scale operations. |
The global dc grid connected microgrid market is estimated to be valued at USD 5.7 billion in 2025.
The market size for the dc grid connected microgrid market is projected to reach USD 38.0 billion by 2035.
The dc grid connected microgrid market is expected to grow at a 20.9% CAGR between 2025 and 2035.
The key product types in dc grid connected microgrid market are solar pv, diesel generators, natural gas, chp and others.
In terms of storage device, lithium-ion segment to command 62.0% share in the dc grid connected microgrid market in 2025.


Our Research Products

The "Full Research Suite" delivers actionable market intel, deep dives on markets or technologies, so clients act faster, cut risk, and unlock growth.

The Leaderboard benchmarks and ranks top vendors, classifying them as Established Leaders, Leading Challengers, or Disruptors & Challengers.

Locates where complements amplify value and substitutes erode it, forecasting net impact by horizon

We deliver granular, decision-grade intel: market sizing, 5-year forecasts, pricing, adoption, usage, revenue, and operational KPIs—plus competitor tracking, regulation, and value chains—across 60 countries broadly.

Spot the shifts before they hit your P&L. We track inflection points, adoption curves, pricing moves, and ecosystem plays to show where demand is heading, why it is changing, and what to do next across high-growth markets and disruptive tech

Real-time reads of user behavior. We track shifting priorities, perceptions of today’s and next-gen services, and provider experience, then pace how fast tech moves from trial to adoption, blending buyer, consumer, and channel inputs with social signals (#WhySwitch, #UX).

Partner with our analyst team to build a custom report designed around your business priorities. From analysing market trends to assessing competitors or crafting bespoke datasets, we tailor insights to your needs.
Supplier Intelligence
Discovery & Profiling
Capacity & Footprint
Performance & Risk
Compliance & Governance
Commercial Readiness
Who Supplies Whom
Scorecards & Shortlists
Playbooks & Docs
Category Intelligence
Definition & Scope
Demand & Use Cases
Cost Drivers
Market Structure
Supply Chain Map
Trade & Policy
Operating Norms
Deliverables
Buyer Intelligence
Account Basics
Spend & Scope
Procurement Model
Vendor Requirements
Terms & Policies
Entry Strategy
Pain Points & Triggers
Outputs
Pricing Analysis
Benchmarks
Trends
Should-Cost
Indexation
Landed Cost
Commercial Terms
Deliverables
Brand Analysis
Positioning & Value Prop
Share & Presence
Customer Evidence
Go-to-Market
Digital & Reputation
Compliance & Trust
KPIs & Gaps
Outputs
Full Research Suite comprises of:
Market outlook & trends analysis
Interviews & case studies
Strategic recommendations
Vendor profiles & capabilities analysis
5-year forecasts
8 regions and 60+ country-level data splits
Market segment data splits
12 months of continuous data updates
DELIVERED AS:
PDF EXCEL ONLINE
DC Traction Switchgear Market Size and Share Forecast Outlook 2025 to 2035
DC Electromagnetic Brakes Market Size and Share Forecast Outlook 2025 to 2035
DC and PKI Market Size and Share Forecast Outlook 2025 to 2035
DCIM Market Size and Share Forecast Outlook 2025 to 2035
DC Contactor Market Size and Share Forecast Outlook 2025 to 2035
DC Solar Cable Market Size and Share Forecast Outlook 2025 to 2035
DC Servo Motors and Drives Market Size and Share Forecast Outlook 2025 to 2035
DC BEV On-Board Charger Market Size and Share Forecast Outlook 2025 to 2035
DC Motor Control Devices Market Size and Share Forecast Outlook 2025 to 2035
DC Powered Servers Market Size and Share Forecast Outlook 2025 to 2035
DC Switchgear Market - Size, Share, and Forecast 2025 to 2035
DC Power Supplies Market - Size, Share, and Forecast 2025 to 2035
DC Power Systems Market Trends - Growth, Demand & Forecast 2025 to 2035
DC Power Supply Module Market – Powering IoT & Electronics
DC Drive Market Size, Share, Trends & Forecast 2024-2034
DC-DC Converter Market Insights – Size, Demand & Forecast 2023-2033
ADC & DAC In Quantum Computing Market Size and Share Forecast Outlook 2025 to 2035
PDC Drill Bits Market Size and Share Forecast Outlook 2025 to 2035
HVDC Transmission System Market Size and Share Forecast Outlook 2025 to 2035
HVDC Converter Market Size and Share Forecast Outlook 2025 to 2035

Thank you!
You will receive an email from our Business Development Manager. Please be sure to check your SPAM/JUNK folder too.
Chat With
MaRIA